Pensacola, FL
Demographics And Statistics
Living In Pensacola, Florida Summary
Life in Pensacola research summary. HomeSnacks has been using Saturday Night Science to research the quality of life in Pensacola over the past nine years using Census, FBI, Zillow, and other primary data sources. Based on the most recently available data, we found the following about life in Pensacola:
The population in Pensacola is 54,059.
The median home value in Pensacola is $257,979.
The median income in Pensacola is $67,722.
The cost of living in Pensacola is 93 which is 0.9x lower than the national average.
The median rent in Pensacola is $1,150.
The unemployment rate in Pensacola is 5.5%.
The poverty rate in Pensacola is 14.1%.
The average high in Pensacola is 76.8° and the average low is 59.1°.
Pensacola SnackAbility
Overall SnackAbility
Pensacola, FL Crime Report
Crime in Pensacola summary. We use data from the FBI to determine the crime rates in Pensacola. Key points include:
There were 1,870 total crimes in Pensacola in the last reporting year.
The overall crime rate per 100,000 people in Pensacola is 3,522.8 / 100k people.
The violent crime rate per 100,000 people in Pensacola is 616.0 / 100k people.
The property crime rate per 100,000 people in Pensacola is 2,906.8 / 100k people.
Overall, crime in Pensacola is 51.57% above the national average.
Total Crimes
Above National Average
Crime In Pensacola Comparison Table
| Statistic | Count Raw |
Pensacola / 100k People |
Florida / 100k People |
National / 100k People |
|---|---|---|---|---|
| Total Crimes Per 100K | 1,870 | 3,522.8 | 2,153.0 | 2,324.2 |
| Violent Crime | 327 | 616.0 | 383.6 | 369.8 |
| Murder | 5 | 9.4 | 5.9 | 6.3 |
| Robbery | 52 | 98.0 | 62.2 | 66.1 |
| Aggravated Assault | 244 | 459.7 | 280.1 | 268.2 |
| Property Crime | 1,543 | 2,906.8 | 1,769.4 | 1,954.4 |
| Burglary | 191 | 359.8 | 240.6 | 269.8 |
| Larceny | 1,272 | 2,396.2 | 1,352.7 | 1,401.9 |
| Car Theft | 80 | 150.7 | 176.1 | 282.7 |
Pensacola, FL Cost Of Living
Cost of living in Pensacola summary. We use data on the cost of living to determine how expensive it is to live in Pensacola. Real estate prices drive most of the variance in cost of living around Florida. Key points include:
The cost of living in Pensacola is 93 with 100 being average.
The cost of living in Pensacola is 0.9x lower than the national average.
The median home value in Pensacola is $257,979.
The median income in Pensacola is $67,722.
Pensacola's Overall Cost Of Living
Lower Than The National Average
Cost Of Living In Pensacola Comparison Table
| Living Expense | Pensacola | Florida | National Average | |
|---|---|---|---|---|
| Overall | 93 | 101 | 100 | |
| Services | 93 | 98 | 100 | |
| Groceries | 96 | 101 | 100 | |
| Health | 91 | 96 | 100 | |
| Housing | 84 | 108 | 100 | |
| Transportation | 91 | 98 | 100 | |
| Utilities | 116 | 100 | 100 | |
Pensacola, FL Weather
The average high in Pensacola is 76.8° and the average low is 59.1°.
There are 77.2 days of precipitation each year.
Expect an average of 66.4 inches of precipitation each year with 0.0 inches of snow.
| Stat | Pensacola |
|---|---|
| Average Annual High | 76.8 |
| Average Annual Low | 59.1 |
| Annual Precipitation Days | 77.2 |
| Average Annual Precipitation | 66.4 |
| Average Annual Snowfall | 0.0 |
Average High
Days of Rain
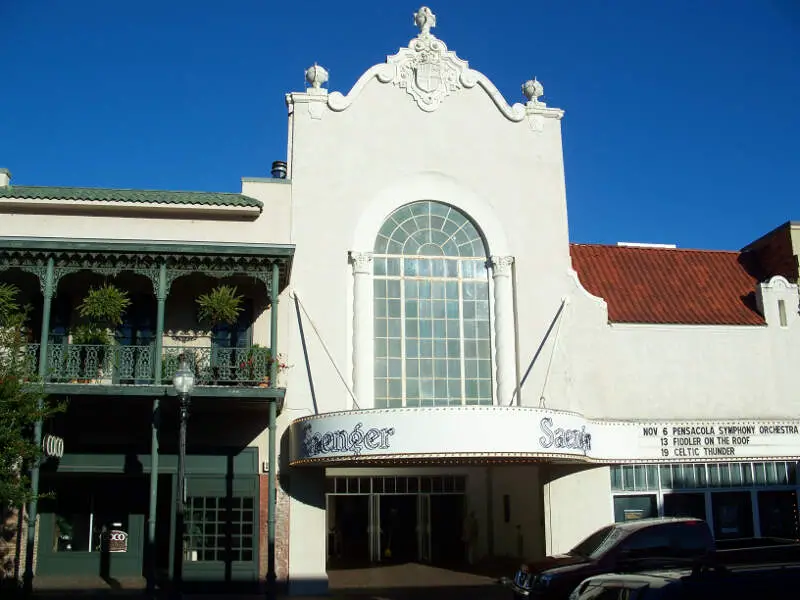
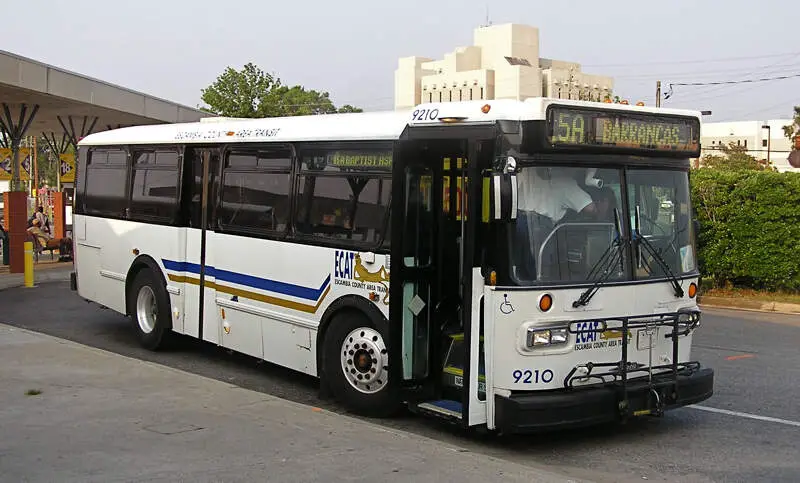
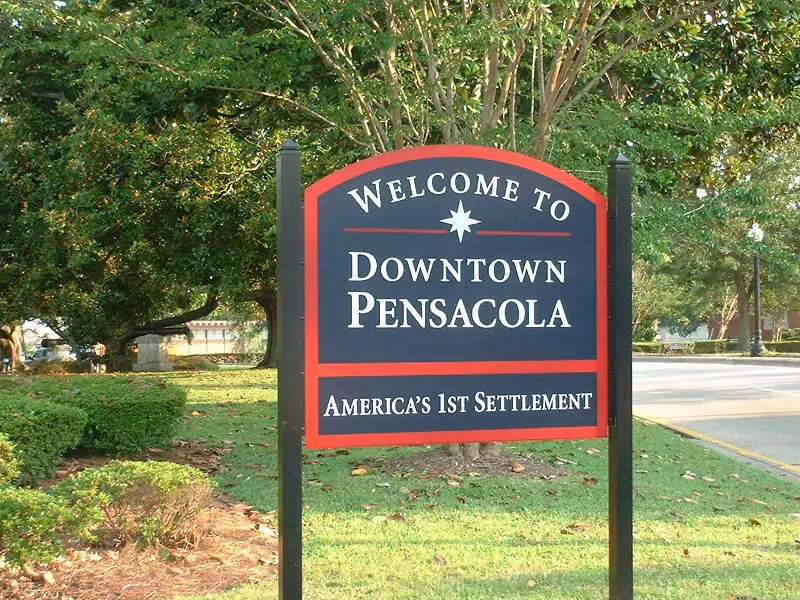
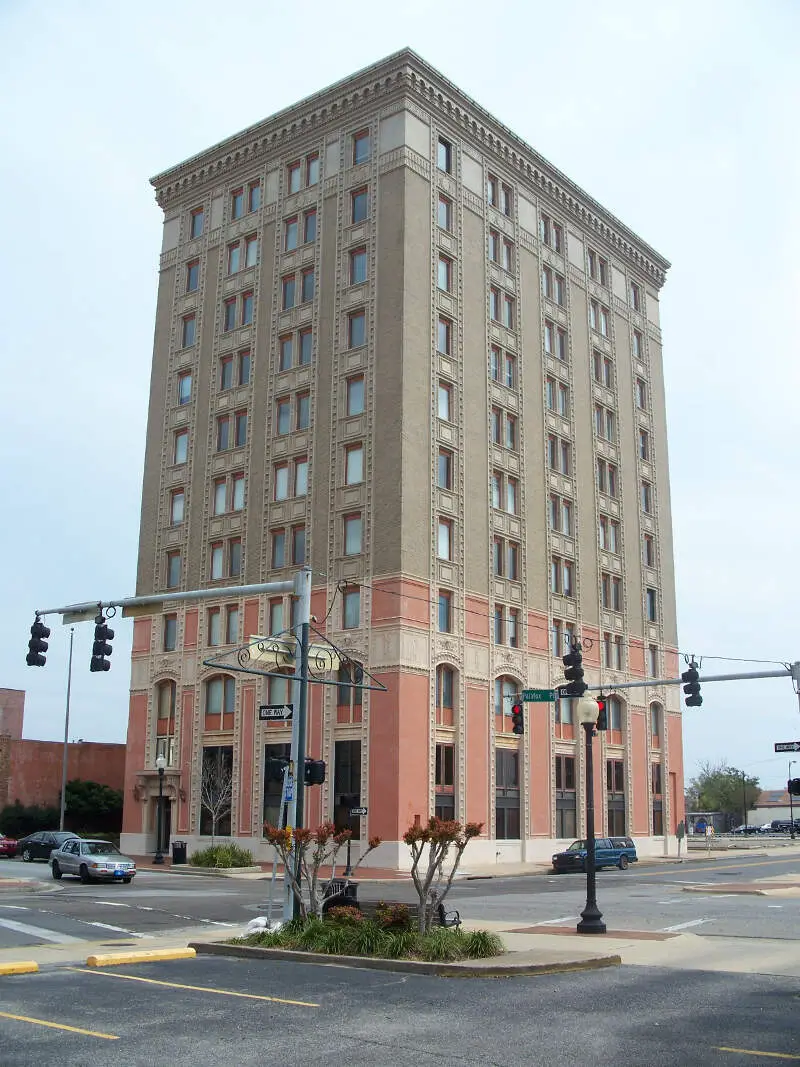
Pensacola, FL Photos


1 Reviews & Comments About Pensacola
/5

Jonathan Johnson -
I live in Pensacola and people leave that town due to crime
Rankings for Pensacola in Florida


Locations Around Pensacola
Map Of Pensacola, FL
Best Places Around Pensacola
Gonzalez, FL
Population 13,579
Pace, FL
Population 25,657
Navarre, FL
Population 38,829
Bellview, FL
Population 24,035
Myrtle Grove, FL
Population 16,945
Ferry Pass, FL
Population 32,447
Ensley, FL
Population 22,148
Brent, FL
Population 22,969
West Pensacola, FL
Population 21,246
Warrington, FL
Population 16,567
Pensacola Demographics And Statistics
Population over time in Pensacola
The current population in Pensacola is 54,059. The population has increased 2.2% from 2010.
| Year | Population | % Change |
|---|---|---|
| 2022 | 54,059 | 2.8% |
| 2021 | 52,562 | -0.2% |
| 2020 | 52,689 | -1.1% |
| 2019 | 53,250 | 0.9% |
| 2018 | 52,752 | 0.5% |
| 2017 | 52,505 | 0.5% |
| 2016 | 52,268 | 0.0% |
| 2015 | 52,246 | -0.4% |
| 2014 | 52,482 | -0.8% |
| 2013 | 52,903 | - |
Race / Ethnicity in Pensacola
Pensacola is:
64.3% White with 34,756 White residents.
23.1% African American with 12,475 African American residents.
0.0% American Indian with 26 American Indian residents.
2.0% Asian with 1,079 Asian residents.
0.1% Hawaiian with 53 Hawaiian residents.
0.5% Other with 260 Other residents.
5.5% Two Or More with 2,967 Two Or More residents.
4.5% Hispanic with 2,443 Hispanic residents.
| Race | Pensacola | FL | USA |
|---|---|---|---|
| White | 64.3% | 52.0% | 58.9% |
| African American | 23.1% | 14.9% | 12.1% |
| American Indian | 0.0% | 0.1% | 0.6% |
| Asian | 2.0% | 2.8% | 5.7% |
| Hawaiian | 0.1% | 0.1% | 0.2% |
| Other | 0.5% | 0.5% | 0.4% |
| Two Or More | 5.5% | 3.1% | 3.5% |
| Hispanic | 4.5% | 26.5% | 18.7% |
Gender in Pensacola
Pensacola is 52.4% female with 28,337 female residents.
Pensacola is 47.6% male with 25,721 male residents.
| Gender | Pensacola | FL | USA |
|---|---|---|---|
| Female | 52.4% | 50.8% | 50.4% |
| Male | 47.6% | 49.2% | 49.6% |
Highest level of educational attainment in Pensacola for adults over 25
2.0% of adults in Pensacola completed < 9th grade.
6.0% of adults in Pensacola completed 9-12th grade.
20.0% of adults in Pensacola completed high school / ged.
21.0% of adults in Pensacola completed some college.
11.0% of adults in Pensacola completed associate's degree.
22.0% of adults in Pensacola completed bachelor's degree.
11.0% of adults in Pensacola completed master's degree.
4.0% of adults in Pensacola completed professional degree.
3.0% of adults in Pensacola completed doctorate degree.
| Education | Pensacola | FL | USA |
|---|---|---|---|
| < 9th Grade | 2.0% | 6.0% | 4.0% |
| 9-12th Grade | 6.0% | 6.0% | 6.0% |
| High School / GED | 20.0% | 28.0% | 26.0% |
| Some College | 21.0% | 19.0% | 20.0% |
| Associate's Degree | 11.0% | 10.0% | 9.0% |
| Bachelor's Degree | 22.0% | 20.0% | 21.0% |
| Master's Degree | 11.0% | 8.0% | 10.0% |
| Professional Degree | 4.0% | 2.0% | 2.0% |
| Doctorate Degree | 3.0% | 1.0% | 2.0% |
Household Income For Pensacola, Florida
5.5% of households in Pensacola earn Less than $10,000.
5.4% of households in Pensacola earn $10,000 to $14,999.
7.4% of households in Pensacola earn $15,000 to $24,999.
8.3% of households in Pensacola earn $25,000 to $34,999.
11.7% of households in Pensacola earn $35,000 to $49,999.
16.8% of households in Pensacola earn $50,000 to $74,999.
12.6% of households in Pensacola earn $75,000 to $99,999.
16.6% of households in Pensacola earn $100,000 to $149,999.
7.1% of households in Pensacola earn $150,000 to $199,999.
8.6% of households in Pensacola earn $200,000 or more.
| Income | Pensacola | FL | USA |
|---|---|---|---|
| Less than $10,000 | 5.5% | 5.2% | 4.9% |
| $10,000 to $14,999 | 5.4% | 3.7% | 3.8% |
| $15,000 to $24,999 | 7.4% | 7.6% | 7.0% |
| $25,000 to $34,999 | 8.3% | 8.3% | 7.4% |
| $35,000 to $49,999 | 11.7% | 12.1% | 10.7% |
| $50,000 to $74,999 | 16.8% | 17.6% | 16.1% |
| $75,000 to $99,999 | 12.6% | 13.2% | 12.8% |
| $100,000 to $149,999 | 16.6% | 16.0% | 17.1% |
| $150,000 to $199,999 | 7.1% | 7.4% | 8.8% |
| $200,000 or more | 8.6% | 9.0% | 11.4% |


