While most places in Massachusetts are downright lovely, some spots in The Bay State deserve special attention for standing out as exceptionally safe. This is why we created a list of the top ten safest places to live in Massachusetts for 2026.
How exactly is one to tell where the safest places are to live in Massachusetts? Well, data, of course.
We've broken down the safest cities in The Baked Bean State based on the most recent FBI data on property and violent crime in places with more than 5,000 residents. And at this point, we're quite the experts on ranking safe cities; it's the eleventh time we've ranked the safest places in Massachusetts.
Whether your looking to move to a quintessential "Old World" type place like New Bedford, a family-friendly town like Wellesley, or a place for young professionals like Waltham, there is a safe place for everyone.
So, where can your kids play outside safely until the street lights come on in Massachusetts? Keep reading.
16 violent / 0 property per 100k
Data | Crime | Cost of living | Movers

11 violent / 85 property per 100k
0 violent / 145 property per 100k
The third safest city in Massachusetts is Boxford.
Believe it or not, coming in third is actually a bit of tumble for the city as it topped the list last year. There is still basically no violent crime in town, which is the best in the state, but property crime climb a small tick.
Boxford's population is extremely well educated with a good 40% plus of the residents having at least a bachelor's. That probably has something to do with the whole no violent crime thing.
29 violent / 44 property per 100k
Groveland may only place fourth on this list, but if violent crime is especially worrisome to you, then Groveland is definitely the place to be. The town had zilch in terms of violence in the last year of available data. Nada. Everyone's too tired from action-packed weekends at Pines Recreation Area to start an underground fight club.
Now if Groveland can improve its property crime numbers, it can definitely work its way up this list.
Groveland is about an hour north of Boston.
13 violent / 188 property per 100k
Northborough, a historic town in Central Massachusetts, only counted 2 violent crimes and a modest 30 incidents of property crime, reflecting its position as the fifth safest city in the state.
Its safety and small-town essence are preserved from its founding in 1656 by the Nipmuc people and Europeans through to the present day, supported by solid police work and community efforts that yield a total crime rate of 200/100k people per capita and ranks fifth safest for violent crime and 19th safest for property crime within Massachusetts.
Data | Crime | Cost of living | Movers
35 violent / 105 property per 100k
44 violent / 57 property per 100k
If you make your way to Clinton, you won't have to worry about crime. It's one of the safest communities in the state.
Fan of baseball history? You might want to add Clinton, Massachusetts, to your next historical road trip. It boasts Fuller Field, which saw its first game in 1878 and has hosted teams ever since. That makes it the oldest baseball field in the world that's been used continuous since it was built.
Located along the Wachusett Reservoir, Clinton sits about an hour west of Boston. With a population of 15,864, it reported a tiny number of crimes over the course of a year. It saw 7 violent crimes and 9 property crimes.
These figures equate to a per-capita crime rate of 100/100k people, making Clinton the number 7 safest community in Massachusetts.
Data | Crime | Cost of living | Movers
41 violent / 117 property per 100k
Data | Crime | Cost of living | Movers
42 violent / 126 property per 100k
Known for its safety, Rockport boasts the title of the ninth safest city for 2026. With 3 violent crimes, it earned a state ranking of 21st safest for violent crimes.
The city's unique past as a granite and fishing center, alongside community vigilance, has fostered an environment where property crime is minimal, placing it at ninth safest in the state. Rockport's 7,120 residents relish in this tranquility, enriched by its historical tapestry and coastal setting.
0 violent / 229 property per 100k
Lincoln, in Massachusetts's Middlesex County, has a strong sense of community among its population of 6,985. Its low crime rates, with just 0 violent crimes and no murder, ranks it second safest in the state for violent crme safety. Property crimes are similarly scarce at 16 incidents, placing it at 29th safest in Massachusetts. The combination of its conservation-rich environment, history linked to Concord, and the tenth spot for overall safety in Massachusetts make Lincoln highly desirable.
The receipts
Compare the top ten
Pick a metric. The bars rescale. The red line is Massachusetts's statewide median. Lower is safer.
Massachusetts statewide median: 153
Massachusetts statewide median: 579
On the map
Where the safety is in Massachusetts
Saturday Night Science
Methodology: How we calculated the safest cities in Massachusetts for 2026
While there are surveys and public polls on what cities in Massachusetts are the safest, we wanted to rely on something other than speculation and opinion. Instead, we looked at the hard numbers from the FBI's most recent crime report in Massachusetts.
Specifically, we used Saturday Night Science to analyze the FBI's Uniform Crime Report, which summarizes the number of property and violent crimes in each city annually. We used two criteria:
- Violent crimes per capita (murders, assaults, rapes, armed robberies)
- Property crimes per capita (thefts, burglaries, motor vehicle thefts)
For example, there were 35 crimes committed in Worcester, with a reported population of 212,425. That means the number of crimes per capita is 0.0002, which translates into a 1 in 6,069 chance of being the victim of a crime.
We only looked at Massachusetts cities that have populations of more than 5,000. This filter left us with 254 of the biggest cities in Massachusetts to rank.
We ranked each city for each criterion from 1 to 254 where 1 in any particular category is the safest.
Next, we averaged each place's two criteria to create a Safety Index. We crowned the place with the lowest overall Safety Score, "The Safest Place In Massachusetts," with any ties going to the bigger city.
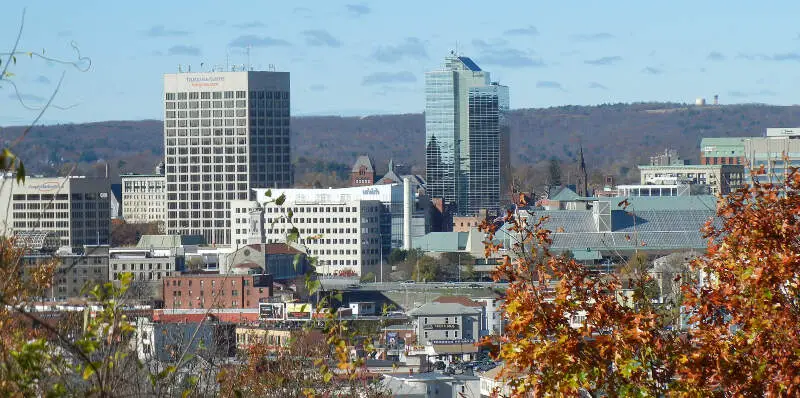
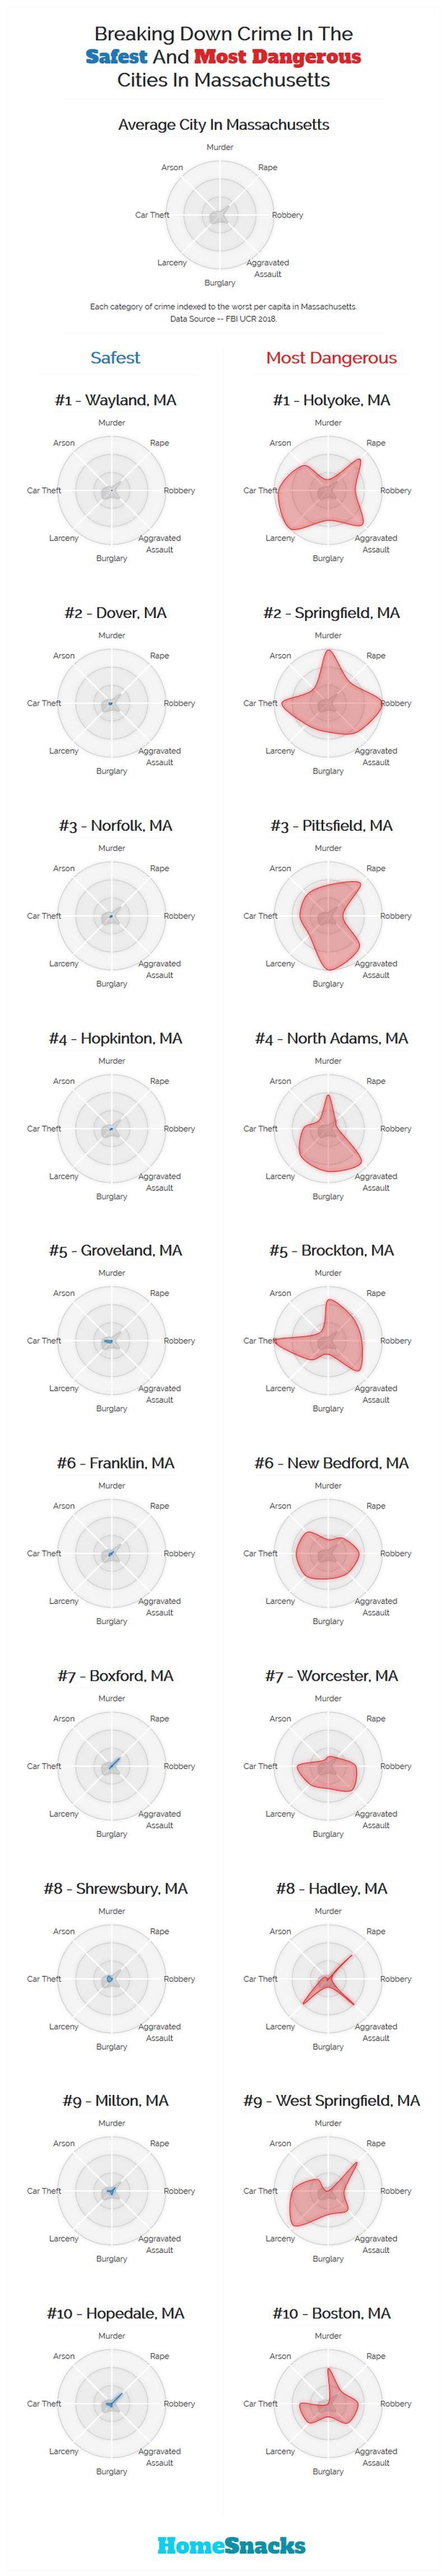
The safest city in Massachusetts, based on our criteria, is Worcester. The most dangerous city in Massachusetts? Holyoke, where residents had a 1 in 18 chance of being the victim of a crime.
This article has been update for 2026. This report marks our eleventh time ranking the safest places to live in Massachusetts. All the data comes from the FBI's Crime In The USA 2024 report.
Summary
Summary: The Safest Cities In The Bay State
Looking at the data, you can tell that Worcester is as safe as they come in Massachusetts, according to science and data.
But as most Massachusetts residents would agree, almost every place here has its safe and not safe parts. So just make sure you're informed ahead of time.
The safest places in Massachusetts are .
For more reading, check out:
The full plate
Where Are The Safest Cities In Massachusetts For 2026?
Click any column to sort. All 254 ranked Massachusetts cities.
| Rank | City | Population | Violent / 100k | Property / 100k | Murders / 100k | Murders |
|---|---|---|---|---|---|---|
| 1 | Worcester, MA | 212,425 | 16 | 0 | 7 | 16 |
| 2 | Millis, MA | 9,370 | 10 | 85 | 0 | 0 |
| 3 | Boxford, MA | 8,291 | 0 | 144 | 0 | 0 |
| 4 | Groveland, MA | 6,869 | 29 | 43 | 0 | 0 |
| 5 | Northborough, MA | 15,975 | 12 | 187 | 0 | 0 |
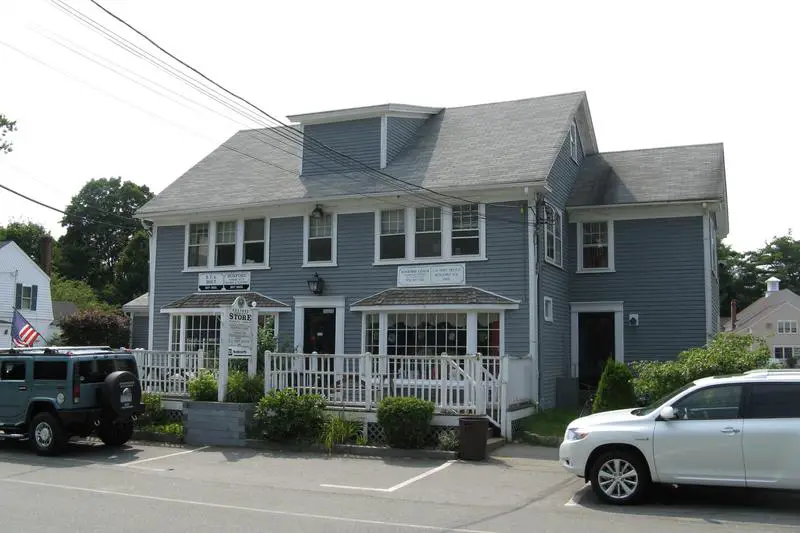
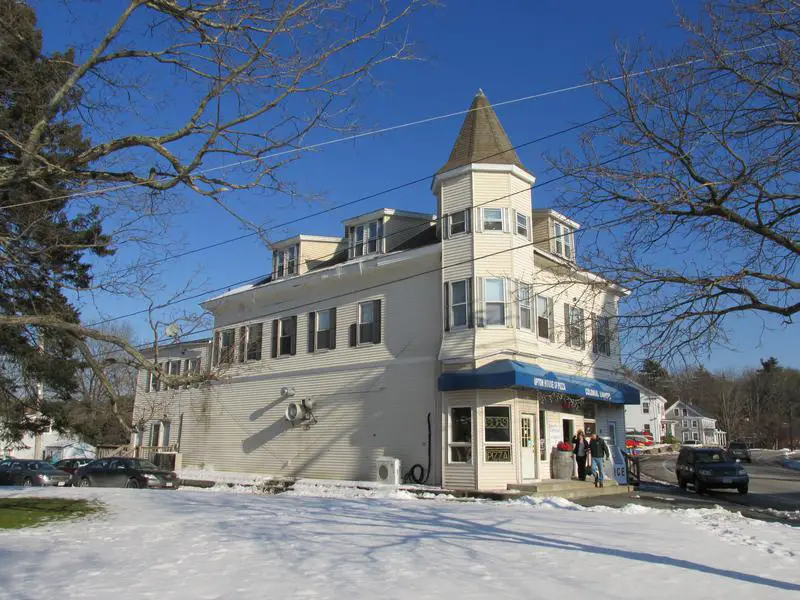
| 6 | Upton, MA | 8,575 | 34 | 104 | 0 | 0 |
| 7 | Clinton, MA | 15,864 | 44 | 56 | 0 | 0 |
| 8 | Scituate, MA | 19,735 | 40 | 116 | 0 | 0 |
| 9 | Rockport, MA | 7,120 | 42 | 126 | 0 | 0 |
| 10 | Lincoln, MA | 6,985 | 0 | 229 | 0 | 0 |
| 11 | Holliston, MA | 15,309 | 32 | 182 | 0 | 0 |
| 12 | Merrimac, MA | 6,846 | 14 | 219 | 0 | 0 |
| 13 | Topsfield, MA | 6,664 | 0 | 255 | 0 | 0 |
| 14 | Groton, MA | 11,487 | 43 | 191 | 0 | 0 |
| 15 | Manchester-by-the-Sea, MA | 5,501 | 18 | 236 | 0 | 0 |
| 16 | Sharon, MA | 18,754 | 37 | 239 | 0 | 0 |
| 17 | Harvard, MA | 7,086 | 56 | 155 | 0 | 0 |
| 18 | Hampden, MA | 5,002 | 59 | 199 | 0 | 0 |
| 19 | Southborough, MA | 10,620 | 56 | 225 | 0 | 0 |
| 20 | Grafton, MA | 20,464 | 68 | 175 | 0 | 0 |
| 21 | Georgetown, MA | 8,597 | 34 | 314 | 0 | 0 |
| 22 | Southampton, MA | 6,187 | 32 | 323 | 0 | 0 |
| 23 | Holden, MA | 20,322 | 54 | 260 | 0 | 0 |
| 24 | Hamilton, MA | 7,738 | 64 | 219 | 0 | 0 |
| 25 | Bridgewater, MA | 29,465 | 74 | 200 | 0 | 0 |
| 26 | Stow, MA | 7,198 | 55 | 263 | 13 | 1 |
| 27 | Granby, MA | 6,046 | 49 | 297 | 0 | 0 |
| 28 | Rochester, MA | 6,032 | 49 | 298 | 0 | 0 |
| 29 | Sudbury, MA | 19,939 | 55 | 280 | 0 | 0 |
| 30 | Hopedale, MA | 6,149 | 65 | 243 | 0 | 0 |
| 31 | Winchester, MA | 23,238 | 17 | 382 | 0 | 0 |
| 32 | Dalton, MA | 6,161 | 113 | 81 | 0 | 0 |
| 33 | Medway, MA | 13,980 | 64 | 286 | 0 | 0 |
| 34 | Hopkinton, MA | 20,171 | 84 | 242 | 4 | 1 |
| 35 | Carlisle, MA | 5,276 | 56 | 303 | 0 | 0 |
| 36 | Lexington, MA | 34,350 | 52 | 334 | 0 | 0 |
| 37 | Bedford, MA | 14,659 | 13 | 443 | 13 | 2 |
| 38 | Berkley, MA | 6,969 | 114 | 143 | 0 | 0 |
| 39 | Rehoboth, MA | 13,844 | 86 | 267 | 0 | 0 |
| 40 | Rutland, MA | 9,721 | 102 | 216 | 0 | 0 |
| 41 | Newburyport, MA | 19,232 | 46 | 395 | 0 | 0 |
| 42 | Spencer, MA | 12,130 | 82 | 280 | 0 | 0 |
| 43 | Norfolk, MA | 11,824 | 50 | 380 | 0 | 0 |
| 44 | Blackstone, MA | 9,391 | 117 | 170 | 0 | 0 |
| 45 | Sterling, MA | 8,437 | 94 | 272 | 0 | 0 |
| 46 | Northbridge, MA | 16,813 | 71 | 333 | 0 | 0 |
| 47 | Weston, MA | 12,041 | 58 | 357 | 0 | 0 |
| 48 | Westford, MA | 24,946 | 68 | 336 | 0 | 0 |
| 49 | Franklin, MA | 33,716 | 94 | 287 | 0 | 0 |
| 50 | Acton, MA | 24,506 | 65 | 350 | 4 | 1 |
| 51 | Wenham, MA | 5,058 | 98 | 276 | 0 | 0 |
| 52 | Hanson, MA | 10,772 | 120 | 204 | 0 | 0 |
| 53 | Duxbury, MA | 16,527 | 114 | 229 | 0 | 0 |
| 54 | Cohasset, MA | 8,555 | 81 | 327 | 0 | 0 |
| 55 | Paxton, MA | 5,135 | 58 | 370 | 0 | 0 |
| 56 | Dudley, MA | 12,053 | 141 | 149 | 0 | 0 |
| 57 | Wellesley, MA | 31,973 | 46 | 484 | 0 | 0 |
| 58 | Shirley, MA | 6,857 | 102 | 277 | 0 | 0 |
| 59 | Arlington, MA | 46,956 | 55 | 434 | 0 | 0 |
| 60 | Reading, MA | 25,871 | 38 | 533 | 0 | 0 |
| 61 | Marshfield, MA | 26,238 | 144 | 167 | 3 | 1 |
| 62 | Middleton, MA | 10,115 | 88 | 336 | 0 | 0 |
| 63 | Norwell, MA | 11,498 | 52 | 478 | 0 | 0 |
| 64 | East Bridgewater, MA | 14,671 | 122 | 231 | 0 | 0 |
| 65 | Littleton, MA | 10,485 | 57 | 438 | 0 | 0 |
| 66 | Norton, MA | 19,484 | 159 | 76 | 0 | 0 |
| 67 | North Reading, MA | 16,531 | 66 | 405 | 0 | 0 |
| 68 | Southwick, MA | 9,378 | 74 | 383 | 0 | 0 |
| 69 | Concord, MA | 18,335 | 49 | 539 | 0 | 0 |
| 70 | Brewster, MA | 10,600 | 122 | 245 | 0 | 0 |
| 71 | Marion, MA | 5,376 | 18 | 595 | 0 | 0 |
| 72 | Pembroke, MA | 18,610 | 91 | 354 | 0 | 0 |
| 73 | Acushnet, MA | 10,817 | 129 | 240 | 0 | 0 |
| 74 | West Boylston, MA | 7,990 | 112 | 287 | 0 | 0 |
| 75 | Ashburnham, MA | 6,572 | 106 | 334 | 0 | 0 |
| 76 | Medfield, MA | 13,434 | 148 | 230 | 0 | 0 |
| 77 | Shrewsbury, MA | 39,837 | 30 | 642 | 0 | 0 |
| 78 | Milton, MA | 28,832 | 52 | 561 | 0 | 0 |
| 79 | Templeton, MA | 8,457 | 118 | 295 | 0 | 0 |
| 80 | Newton, MA | 89,935 | 48 | 599 | 0 | 0 |
| 81 | Ipswich, MA | 14,215 | 133 | 274 | 0 | 0 |
| 82 | Mattapoisett, MA | 6,827 | 58 | 527 | 0 | 0 |
| 83 | Mendon, MA | 6,486 | 123 | 292 | 0 | 0 |
| 84 | Wayland, MA | 13,959 | 78 | 479 | 0 | 0 |
| 85 | Boylston, MA | 5,107 | 176 | 156 | 0 | 0 |
| 86 | Charlton, MA | 13,672 | 117 | 336 | 0 | 0 |
| 87 | Uxbridge, MA | 14,915 | 107 | 368 | 0 | 0 |
| 88 | Douglas, MA | 9,500 | 168 | 210 | 0 | 0 |
| 89 | Pepperell, MA | 11,970 | 108 | 367 | 0 | 0 |
| 90 | Billerica, MA | 42,332 | 101 | 411 | 0 | 0 |
| 91 | Melrose, MA | 29,784 | 100 | 429 | 0 | 0 |
| 92 | Newbury, MA | 6,911 | 101 | 434 | 0 | 0 |
| 93 | Westport, MA | 16,811 | 118 | 350 | 0 | 0 |
| 94 | Needham, MA | 32,779 | 51 | 646 | 0 | 0 |
| 95 | Sutton, MA | 9,643 | 124 | 342 | 0 | 0 |
| 96 | Boxborough, MA | 5,540 | 162 | 270 | 0 | 0 |
| 97 | Belmont, MA | 27,280 | 51 | 703 | 0 | 0 |
| 98 | Sandwich, MA | 20,931 | 157 | 315 | 0 | 0 |
| 99 | Townsend, MA | 9,139 | 109 | 481 | 0 | 0 |
| 100 | Dighton, MA | 8,362 | 179 | 263 | 0 | 0 |
Breaking Down Crime In The Safest And Most Dangerous Cities In Massachusetts
Keep exploring