Research Summary. We used Saturday Night Science to look at the last five years of Census Data. We determined the divorce rate for each state in the United States. And while 50% of couples marrying for the first time have a chance of ending in divorce, the currently divorced rate and population are much lower at any given time. Here are our key findings:
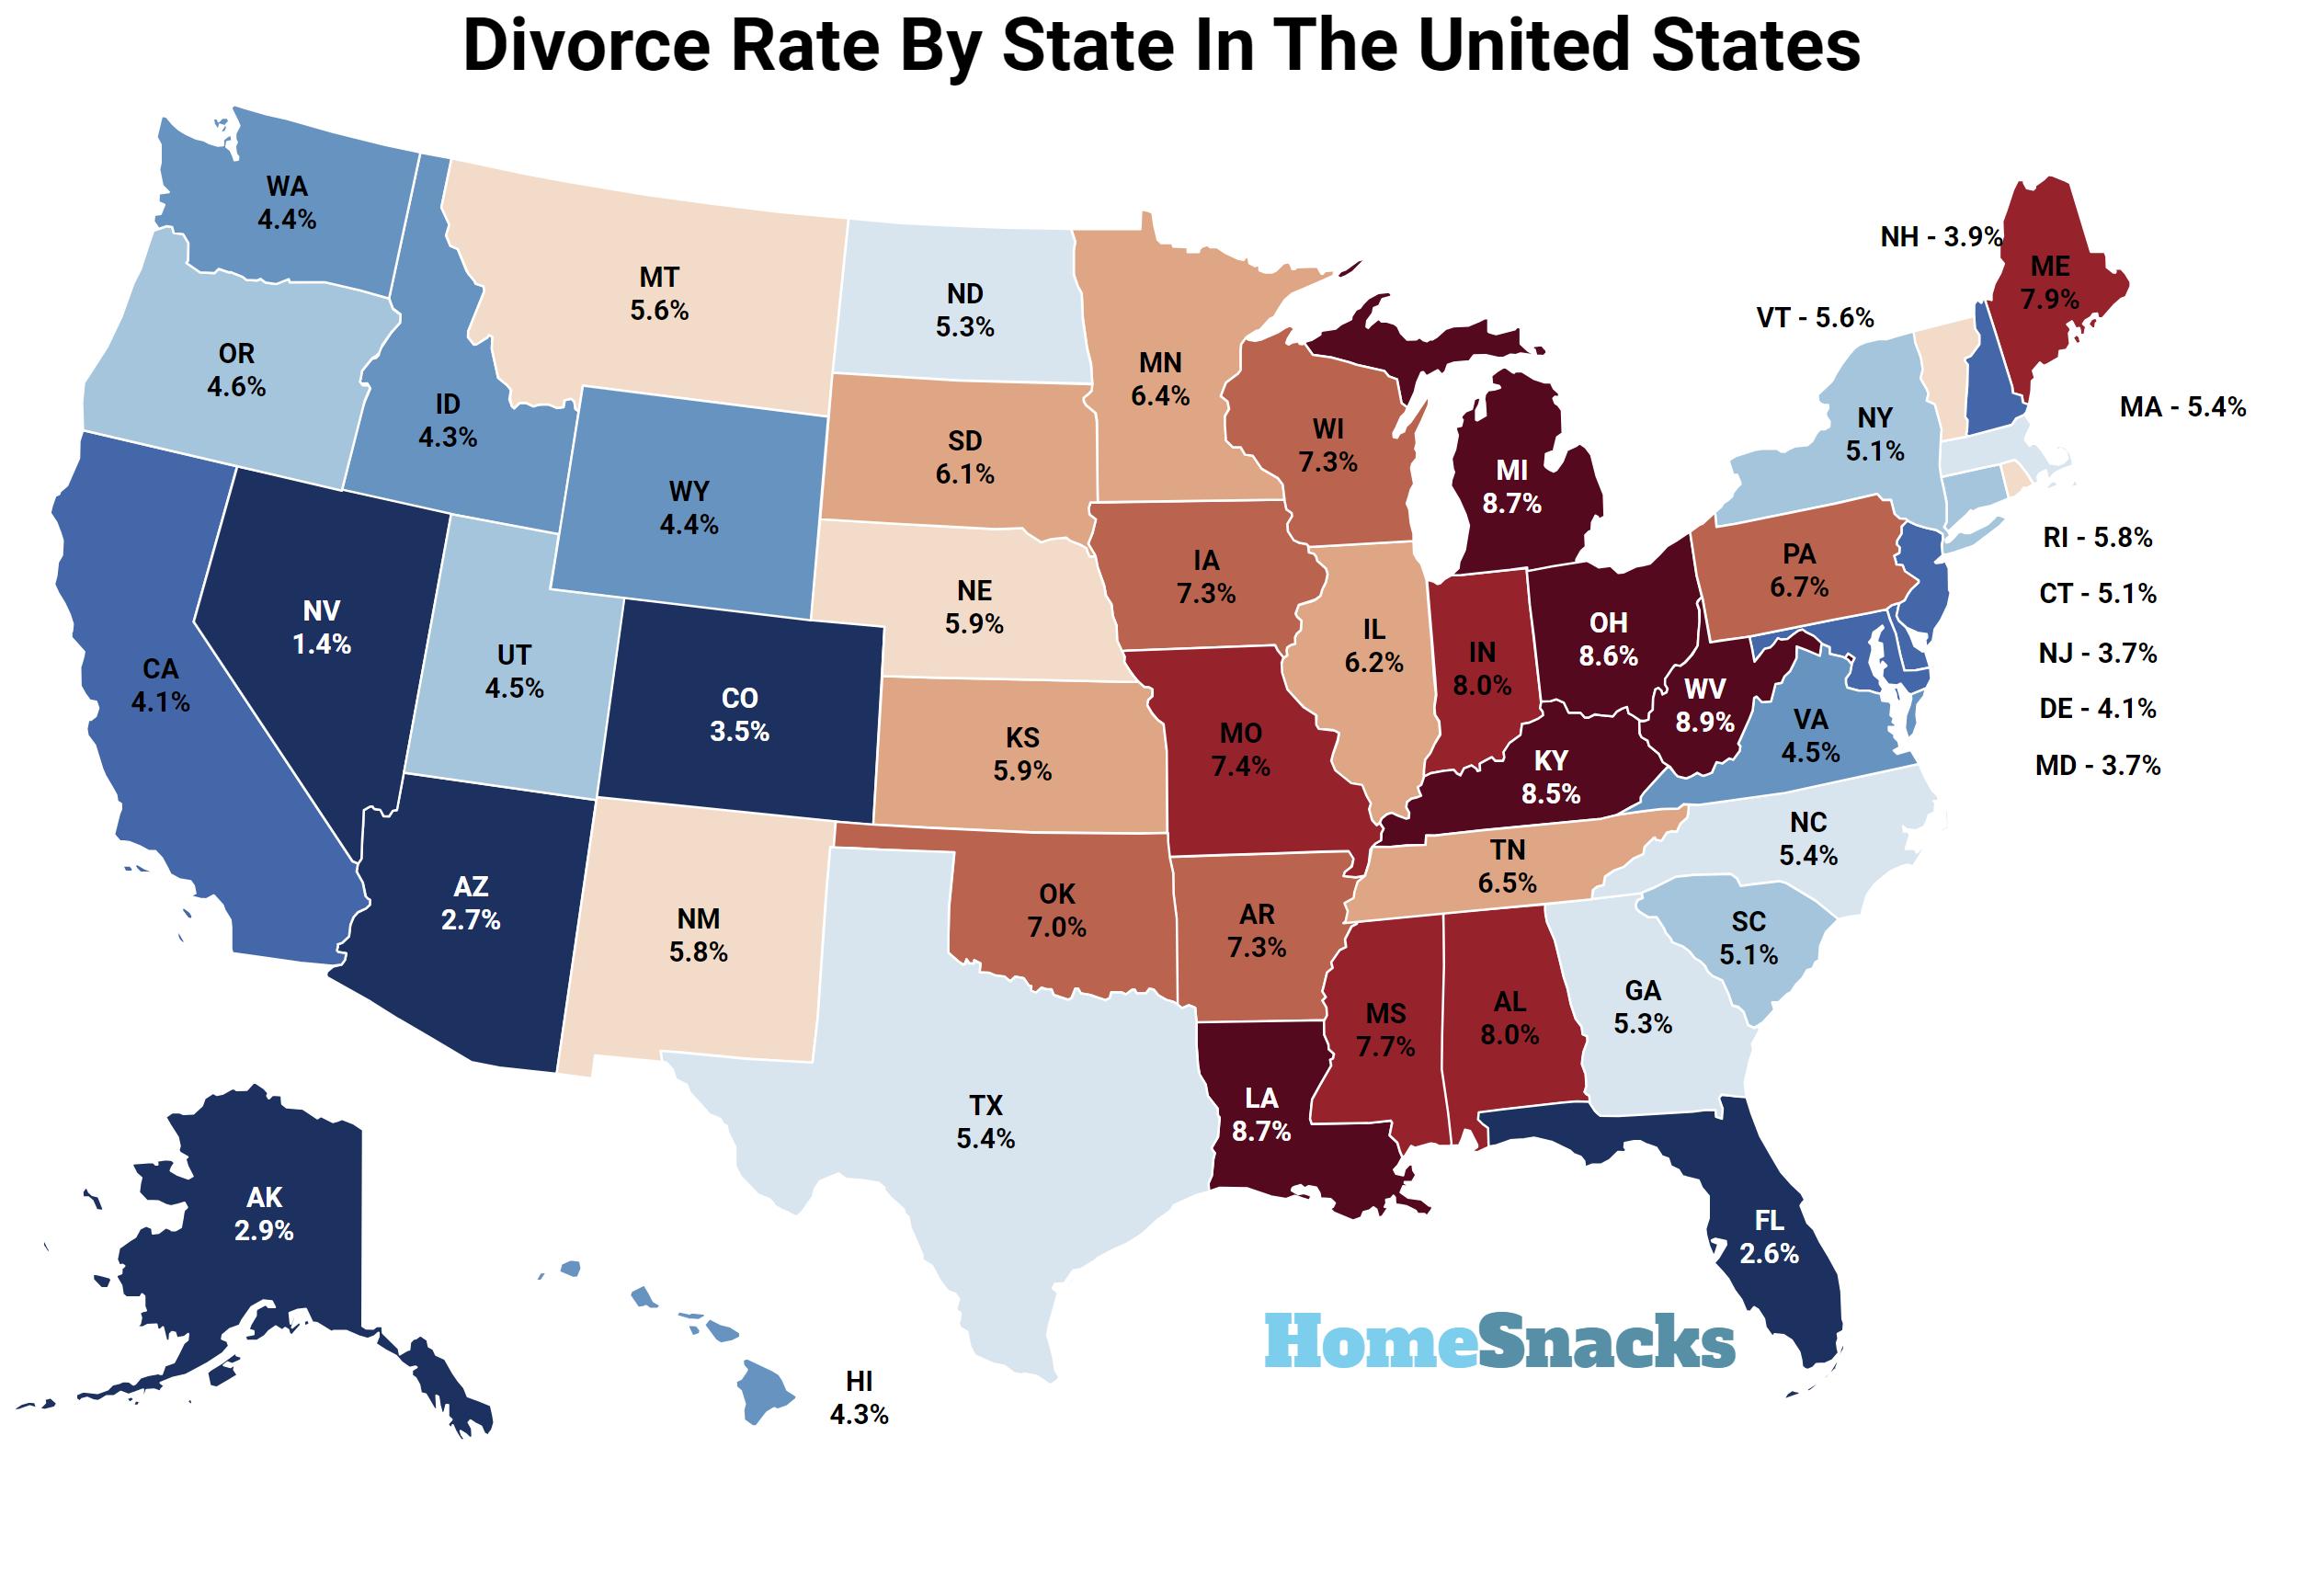
5.29% of Americans are currently divorced.
There are a total of 14,497,349 currently divorced people in the United States.
Louisiana has the highest percentage of divorced people with 8.70%.
Nevada has the lowest percentage of divorced people with 1.35%.
California has the highest number of divorced people at 1,292,248.
Alaska has the lowest number of divorced people at 16,554.
Divorce Rate By State Analysis For 2026
The variation in divorce rates across states in the United States can be attributed to a complex interplay of numerous social, economic, and cultural factors. Here is an analysis of why divorce rates vary by states, drawing from the provided background and additional context:
Income Levels.States with higher average incomes tend to have lower divorce rates. Financial stability and security can reduce marital stress and conflict, making couples less likely to divorce.
Education. Higher levels of education are associated with lower divorce rates. States with a well-educated population tend to have lower divorce rates as individuals may have better problem-solving skills and communication.
Religion. States with a higher proportion of religious populations often exhibit lower divorce rates. Many religious communities discourage divorce and provide social support for couples facing marital challenges.
Cultural Norms. Cultural attitudes toward divorce can vary widely. States with more conservative or traditional cultural values may have lower divorce rates due to social stigma associated with divorce.
Early Marriages. States with a higher prevalence of early marriages are more likely to have higher divorce rates. Marrying at a younger age is associated with a higher likelihood of divorce.
It’s important to note that these factors do not operate in isolation and often interact with one another in complex ways. Therefore, divorce rates can vary significantly from state to state due to the unique combination of these factors in each region. Additionally, societal trends and attitudes toward divorce can change over time, leading to shifts in divorce rates within states.
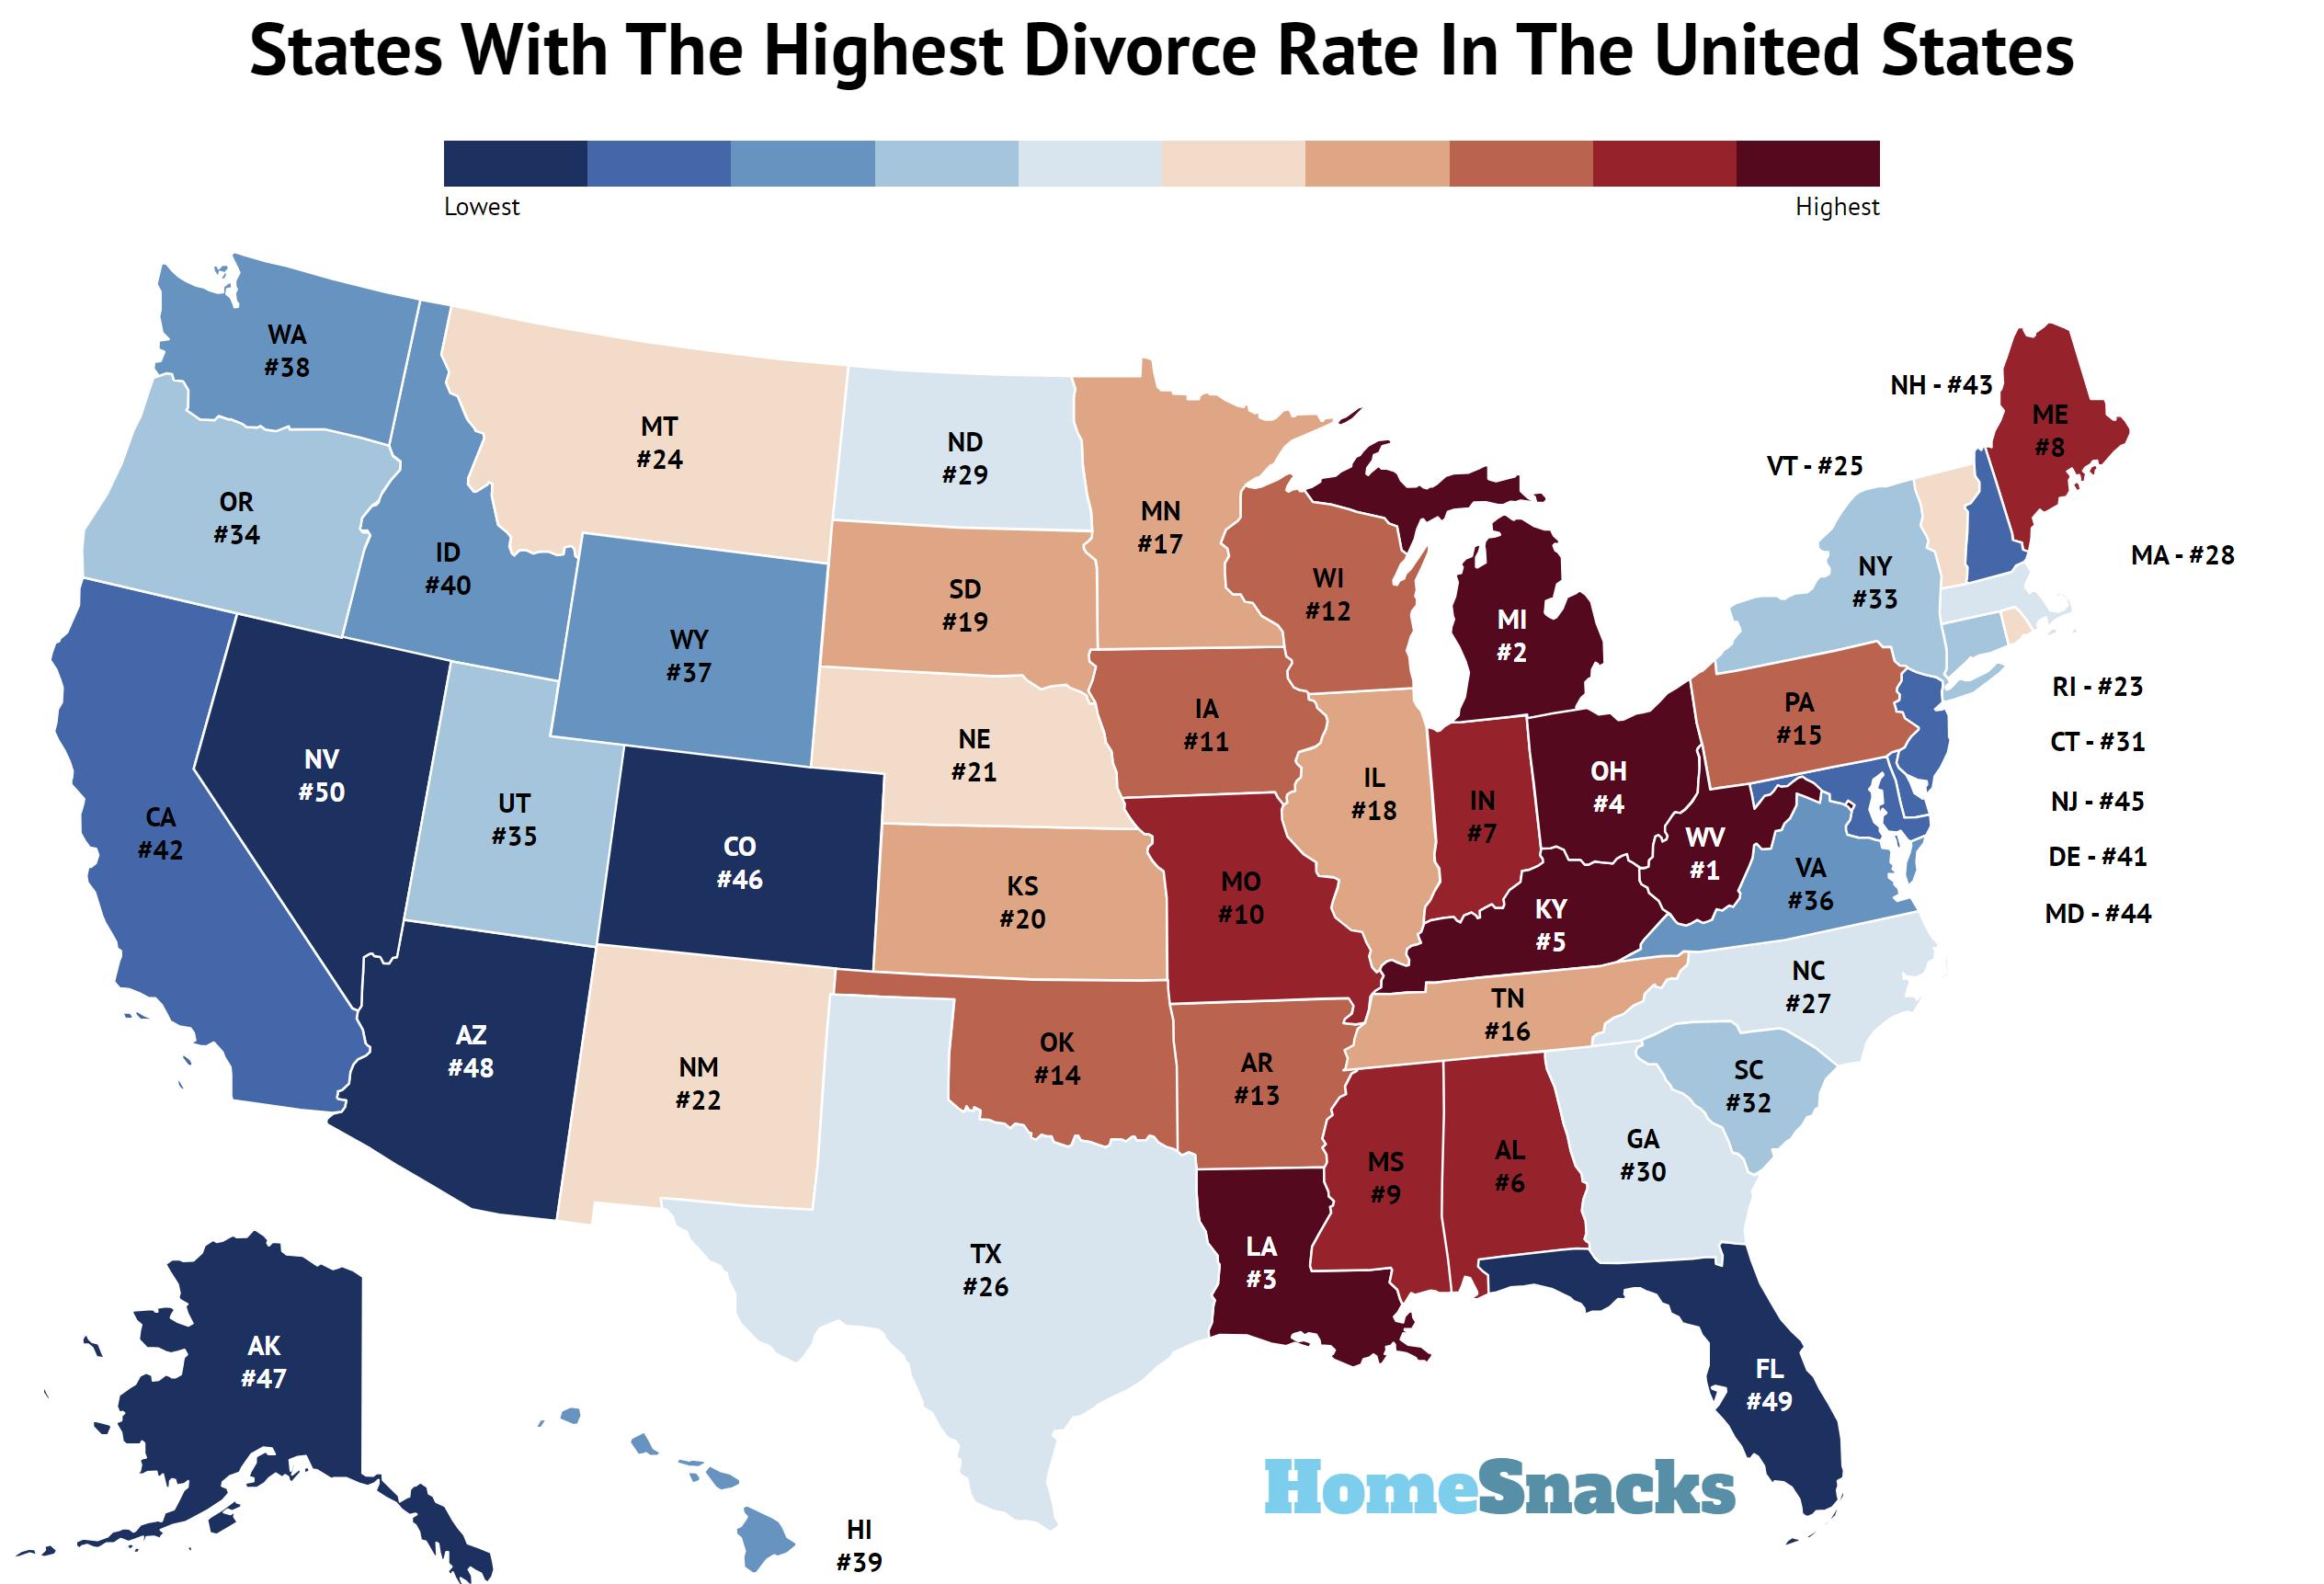
States With Hghest Divorce Rate
The following are the top ten states ranked by the percent of the population over 15 that is divorced:
- Louisiana – 8.7% Divorced
- West Virginia – 8.6% Divorced
- Ohio – 8.5% Divorced
- Michigan – 8.5% Divorced
- Kentucky – 8.4% Divorced
- Indiana – 7.8% Divorced
- Mississippi – 7.8% Divorced
- Alabama – 7.7% Divorced
- Maine – 7.3% Divorced
- Missouri – 7.2% Divorced
States With Lowest Divorce Rate
And these are the top ten states ranked by the the least percent divorced population:
- Nevada – 1.4% Divorced
- Florida – 2.6% Divorced
- Arizona – 2.6% Divorced
- Alaska – 2.8% Divorced
- Colorado – 3.3% Divorced
- New Jersey – 3.6% Divorced
- Maryland – 3.6% Divorced
- Delaware – 3.9% Divorced
- New Hampshire – 4.0% Divorced
- California – 4.0% Divorced
Number And Percent Divorced By State: Table
| Rank | State | % Divorced Population | Population | Divorced Population |
|---|---|---|---|---|
| 1 | Louisiana | 8.7% | 4,611,961 | 323,203 |
| 2 | West Virginia | 8.6% | 1,778,373 | 128,281 |
| 3 | Ohio | 8.5% | 11,810,293 | 825,600 |
| 4 | Michigan | 8.5% | 10,077,761 | 708,243 |
| 5 | Kentucky | 8.4% | 4,534,824 | 308,511 |
| 6 | Indiana | 7.8% | 6,851,073 | 432,645 |
| 7 | Mississippi | 7.8% | 2,946,779 | 186,217 |
| 8 | Alabama | 7.7% | 5,086,768 | 321,202 |
| 9 | Maine | 7.3% | 1,387,817 | 86,874 |
| 10 | Missouri | 7.2% | 6,191,814 | 365,859 |
| 11 | Wisconsin | 7.1% | 5,914,872 | 348,831 |
| 12 | Iowa | 7.1% | 3,210,507 | 185,942 |
| 13 | Arkansas | 7.0% | 3,049,391 | 173,067 |
| 14 | Oklahoma | 6.7% | 4,028,634 | 217,793 |
| 15 | Pennsylvania | 6.6% | 13,018,639 | 719,635 |
| 16 | Minnesota | 6.3% | 5,739,445 | 292,084 |
| 17 | Tennessee | 6.3% | 7,066,383 | 361,822 |
| 18 | Illinois | 6.2% | 12,694,798 | 643,834 |
| 19 | South Dakota | 5.9% | 907,428 | 42,856 |
| 20 | Nebraska | 5.9% | 1,978,707 | 93,256 |
| 21 | Kansas | 5.8% | 2,947,197 | 137,405 |
| 22 | New Mexico | 5.5% | 2,120,246 | 96,804 |
| 23 | Rhode Island | 5.5% | 1,101,801 | 51,473 |
| 24 | Montana | 5.4% | 1,116,875 | 49,713 |
| 25 | Vermont | 5.4% | 647,106 | 29,739 |
| 26 | North Dakota | 5.3% | 784,841 | 33,669 |
| 27 | Texas | 5.2% | 30,188,424 | 1,245,802 |
| 28 | Massachusetts | 5.2% | 7,044,056 | 307,813 |
| 29 | Georgia | 5.0% | 10,940,407 | 447,054 |
| 30 | North Carolina | 5.0% | 10,730,404 | 443,148 |
| 31 | New York | 5.0% | 19,852,366 | 826,679 |
| 32 | South Carolina | 5.0% | 5,296,225 | 217,105 |
| 33 | Connecticut | 4.9% | 3,624,508 | 147,500 |
| 34 | Oregon | 4.5% | 4,254,293 | 159,907 |
| 35 | Utah | 4.4% | 3,392,331 | 116,143 |
| 36 | Hawaii | 4.4% | 1,445,235 | 52,272 |
| 37 | Virginia | 4.4% | 8,705,170 | 312,777 |
| 38 | Washington | 4.3% | 7,816,116 | 278,141 |
| 39 | Wyoming | 4.1% | 582,397 | 19,715 |
| 40 | Idaho | 4.1% | 1,934,262 | 63,999 |
| 41 | California | 4.0% | 39,287,377 | 1,292,248 |
| 42 | New Hampshire | 4.0% | 1,394,868 | 47,013 |
| 43 | Delaware | 3.9% | 1,021,191 | 32,767 |
| 44 | Maryland | 3.6% | 6,206,011 | 184,553 |
| 45 | New Jersey | 3.6% | 9,343,809 | 277,634 |
| 46 | Colorado | 3.3% | 5,862,189 | 162,570 |
| 47 | Alaska | 2.8% | 735,706 | 16,554 |
| 48 | Arizona | 2.6% | 7,378,838 | 160,344 |
| 49 | Florida | 2.6% | 22,416,077 | 485,727 |
| 50 | Nevada | 1.4% | 3,184,612 | 35,326 |
Methodology: How We Determined The Average Divorce Rate In Each State
To calculate the divorce rate by state, we analyzed the most recent Census American Community Survey data for 2020-2024. In particular, we looked at Table B06008: PLACE OF BIRTH BY MARITAL STATUS IN THE UNITED STATES. This table contains data on the marital status of individuals over the age of 15 in the United States. So we took the divorced population over 15 and divided by the total population over 15 for each state.
Conclusion
Our analysis of divorce rates in the United States based on the most recent Census American Community Survey data for 2020-2024 has provided valuable insights into the state of marital relationships across the nation. The findings reveal that while the commonly cited statistic that 50% of first marriages end in divorce may hold true over a lifetime, the currently divorced rate and population are considerably lower at any given point in time.
The states with the highest divorce rate are Louisiana, West Virginia, Ohio, Michigan, Kentucky, Indiana, Mississippi, Alabama, Maine, and Missouri.
The states with the lowest divorce rate are Nevada, Florida, Arizona, Alaska, Colorado, New Jersey, Maryland, Delaware, New Hampshire, and California.
As of 2024, our research indicates that 5.29% of Americans are currently divorced, with a total population of 14,497,349 divorced individuals across the country. The data also highlights significant variations from state to state, with Louisiana having the highest percentage of divorced individuals at 8.70%, and Nevada recording the lowest percentage of divorced individuals at 1.35%. Furthermore, we observed California to have the highest number of divorced people at 1,292,248, while Alaska has the lowest number at 16,554.


