Gayest places in Illinois research summary. We used Saturday Night Science to research the cities in Illinois with the highest percent of same-sex households for 2026. The data comes from the American Community Survey 2020-2024 5-year vintage, which counts same-sex married spouses and same-sex unmarried partners at the city level.
11.7% gay households · #1 gayest in Illinois
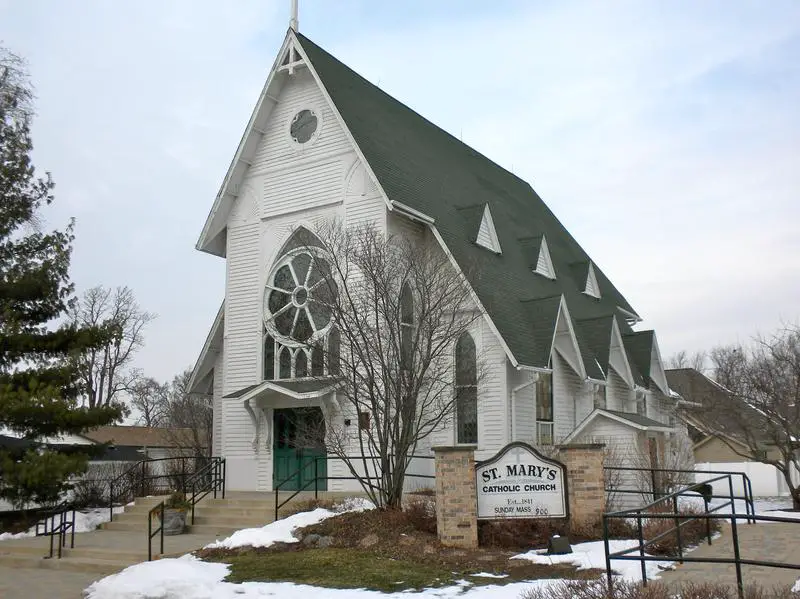
Gilberts is a village in Kane County, Illinois, United States. The population was 1,279 at the 2000 census. The population has grown to 6,879 according to the 2010 census. The population continues to grow at rapid rates.
Data | Crime | Cost of living | Movers
4.6% gay households · #2 gayest in Illinois
4.2% gay households · #3 gayest in Illinois
4.1% gay households · #4 gayest in Illinois
Data | Movers
3.8% gay households · #5 gayest in Illinois
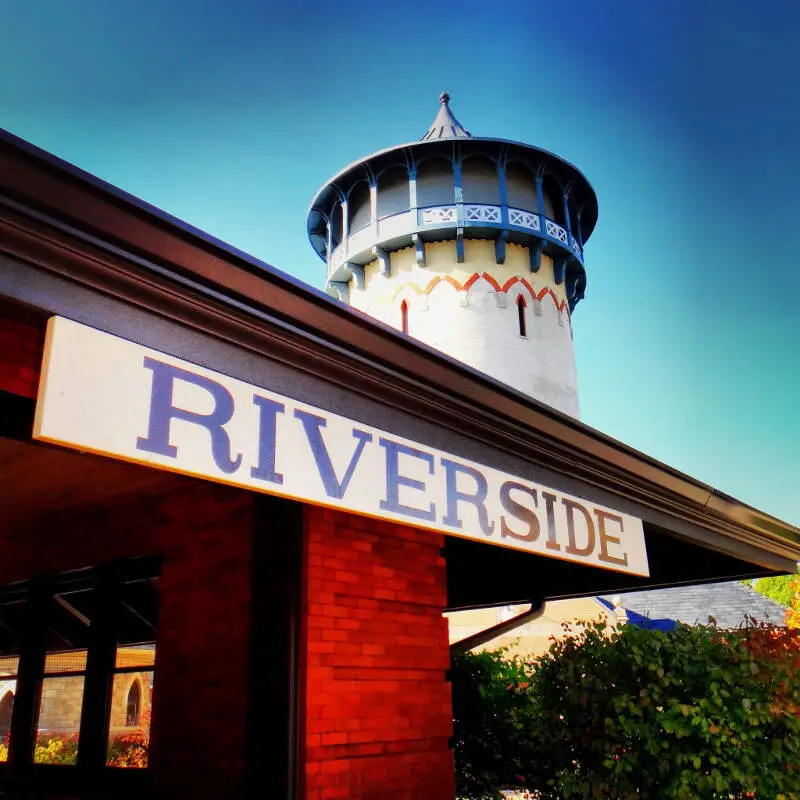
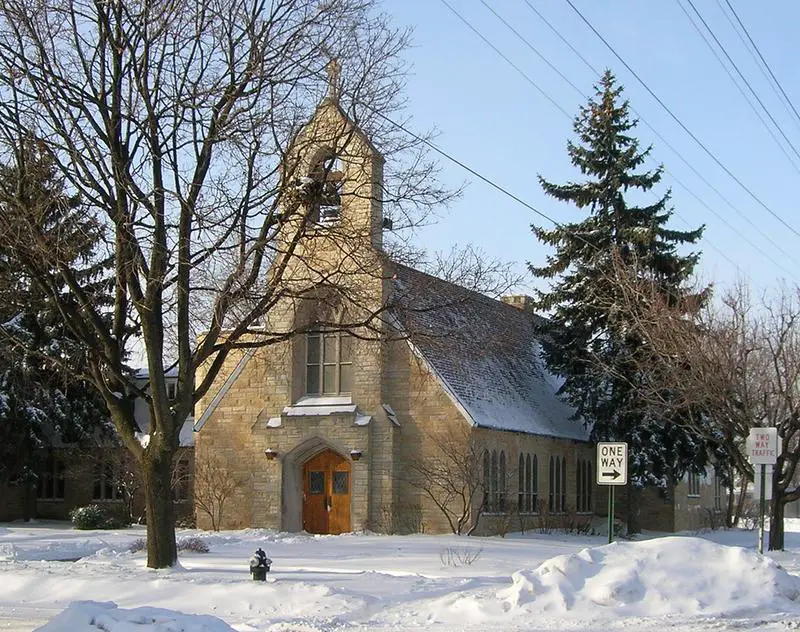
Riverside is a suburban village in Cook County, Illinois, United States. A significant portion of the village is in the Riverside Landscape Architecture District, designated a National Historic Landmark in 1970. The population of the village was 8,875 at the 2010 census. It is a suburb of Chicago, located roughly 9 miles west of downtown Chicago and 2 miles outside city limits.
Data | Crime | Cost of living | Movers
3.7% gay households · #6 gayest in Illinois
Data | Crime | Cost of living | Movers
2.8% gay households · #7 gayest in Illinois
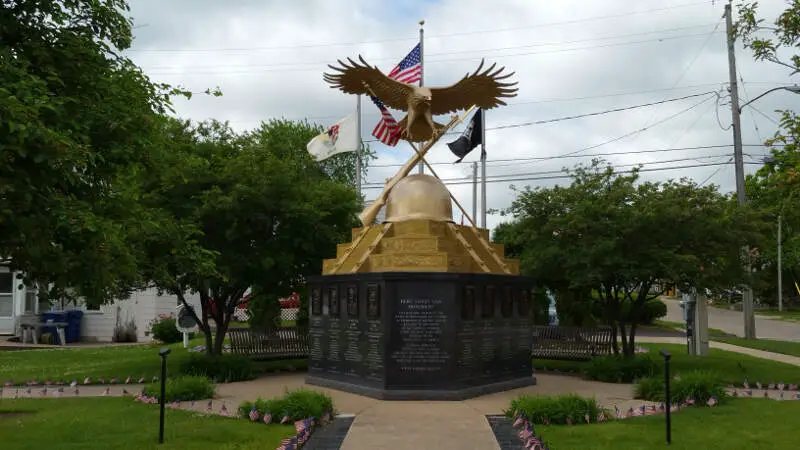
Silvis is a city in Rock Island County, Illinois, United States. It is part of a larger metropolitan area known as the Quad Cities. The Quad Cities Metropolitan Area is situated across four counties in Illinois and Iowa. Silvis is the first community one encounters when entering the Quad Cities from the east on Interstate 88. Four miles from the intersection of Interstate 80 and Interstate 88, Chicago, Des Moines and Omaha are just a few hours away.
Data | Crime | Cost of living | Movers
2.7% gay households · #8 gayest in Illinois
River Grove is a village in Cook County, Illinois, United States. The population was 10,227 at the 2010 census.
Data | Crime | Cost of living | Movers
2.6% gay households · #9 gayest in Illinois
Data | Movers
2.5% gay households · #10 gayest in Illinois
Data | Crime | Cost of living | Movers
The receipts
Compare the top ten
Pick a metric. The bars rescale. The red line is Illinois’s statewide median.
On the map
Where Illinois’s LGBTQ households are
Saturday Night Science
How we determined the gayest places in Illinois for 2026
In order to rank the gayest cities in Illinois, we used Saturday Night Science and the 2020-2024 American Community Survey 5-year estimates from the U.S. Census. We looked at:
- Percentage of all households that are unmarried, same-sex partners
We limited the analysis to non-CDPs that have over 1,000 households.
We ranked each place from 1 to 447 with the city containing the highest percentage of unmarried, same-sex partner households being the most gay.
In the end, Gilberts ended up being the most gay place with 11.7% gay households.
Skip to the end to see the list of all the places in the state from gayest to straightest.
We updated this report for 2026. This report is our eleventh time ranking the gayest places in Illinois.
The full plate
Gayest Places In Illinois
Click any column to sort. Search by city name.
| Rank | City | Households | LGBTQ Households | % Gay Households |
|---|---|---|---|---|
| 1 | Gilberts | 2,812 | 328 | 11.7% |
| 2 | Polo | 1,075 | 49 | 4.6% |
| 3 | Mount Morris | 1,332 | 56 | 4.2% |
| 4 | Johnston City | 1,449 | 59 | 4.1% |
| 5 | Riverside | 3,516 | 132 | 3.8% |
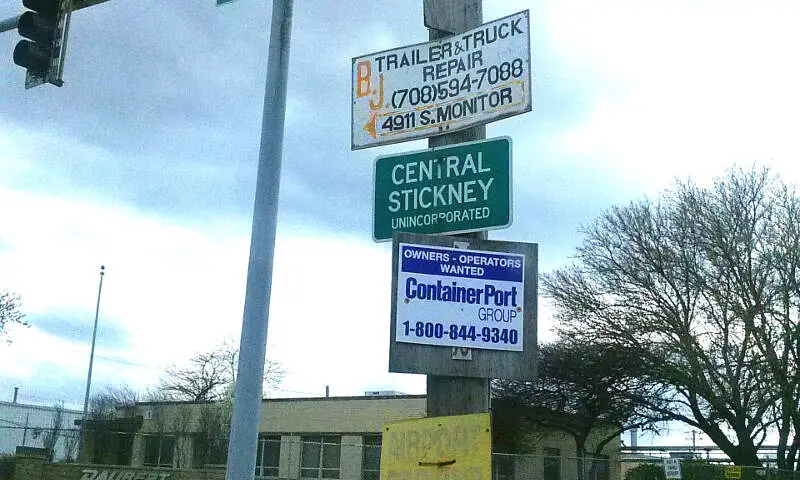
| 6 | Stickney | 2,403 | 90 | 3.7% |
| 7 | Silvis | 4,156 | 115 | 2.8% |
| 8 | River Grove | 4,196 | 115 | 2.7% |
| 9 | Olympia Fields | 1,951 | 50 | 2.6% |
| 10 | Wadsworth | 1,278 | 32 | 2.5% |
| 11 | Auburn | 1,685 | 42 | 2.5% |
| 12 | Schiller Park | 4,353 | 106 | 2.4% |
| 13 | Sycamore | 7,401 | 178 | 2.4% |
| 14 | Alsip | 7,724 | 185 | 2.4% |
| 15 | Evanston | 31,705 | 727 | 2.3% |
| 16 | Galena | 1,717 | 39 | 2.3% |
| 17 | Metamora | 1,442 | 32 | 2.2% |
| 18 | North Barrington | 1,107 | 24 | 2.2% |
| 19 | Sauk Village | 3,070 | 66 | 2.1% |
| 20 | Lakemoor | 2,483 | 50 | 2.0% |
| 21 | Dupo | 1,598 | 32 | 2.0% |
| 22 | Dwight | 1,652 | 33 | 2.0% |
| 23 | Northlake | 4,277 | 83 | 1.9% |
| 24 | Evergreen Park | 7,215 | 139 | 1.9% |
| 25 | Carpentersville | 11,583 | 218 | 1.9% |
| 26 | Edwardsville | 9,828 | 184 | 1.9% |
| 27 | Jacksonville | 6,745 | 126 | 1.9% |
| 28 | West Peoria | 1,902 | 35 | 1.8% |
| 29 | Lena | 1,197 | 22 | 1.8% |
| 30 | Lansing | 11,236 | 206 | 1.8% |
| 31 | Broadview | 3,157 | 57 | 1.8% |
| 32 | Crest Hill | 8,153 | 146 | 1.8% |
| 33 | Berkeley | 1,789 | 32 | 1.8% |
| 34 | Posen | 1,512 | 27 | 1.8% |
| 35 | Carterville | 2,454 | 43 | 1.8% |
| 36 | Manhattan | 3,632 | 63 | 1.7% |
| 37 | Shorewood | 6,852 | 115 | 1.7% |
| 38 | Arthur | 1,034 | 17 | 1.6% |
| 39 | Chicago | 1,160,205 | 18,849 | 1.6% |
| 40 | Bensenville | 7,015 | 109 | 1.6% |
| 41 | Flossmoor | 3,540 | 55 | 1.6% |
| 42 | Alton | 10,714 | 165 | 1.5% |
| 43 | Metropolis | 2,430 | 37 | 1.5% |
| 44 | Berwyn | 20,476 | 311 | 1.5% |
| 45 | Merrionette Park | 1,054 | 16 | 1.5% |
| 46 | Oak Park | 23,387 | 353 | 1.5% |
| 47 | Monmouth | 3,323 | 49 | 1.5% |
| 48 | Robinson | 2,587 | 38 | 1.5% |
| 49 | Marshall | 1,898 | 27 | 1.4% |
| 50 | Indian Head Park | 1,783 | 25 | 1.4% |
| 51 | Effingham | 5,423 | 76 | 1.4% |
| 52 | Pittsfield | 1,934 | 27 | 1.4% |
| 53 | Riverwoods | 1,241 | 17 | 1.4% |
| 54 | Quincy | 17,620 | 240 | 1.4% |
| 55 | DeKalb | 16,388 | 222 | 1.4% |
| 56 | Normal | 20,387 | 276 | 1.4% |
| 57 | Wauconda | 5,039 | 68 | 1.3% |
| 58 | Washington | 6,053 | 81 | 1.3% |
| 59 | Kildeer | 1,499 | 20 | 1.3% |
| 60 | Hainesville | 1,219 | 16 | 1.3% |
| 61 | Galesburg | 12,628 | 165 | 1.3% |
| 62 | Fairview Heights | 7,221 | 94 | 1.3% |
| 63 | Belleville | 17,646 | 228 | 1.3% |
| 64 | Antioch | 5,297 | 68 | 1.3% |
| 65 | Lake Villa | 3,116 | 40 | 1.3% |
| 66 | Belvidere | 9,589 | 121 | 1.3% |
| 67 | Skokie | 24,382 | 307 | 1.3% |
| 68 | Beardstown | 2,328 | 29 | 1.2% |
| 69 | Rockford | 61,324 | 758 | 1.2% |
| 70 | Villa Park | 8,363 | 103 | 1.2% |
| 71 | Oglesby | 1,549 | 19 | 1.2% |
| 72 | Forest Park | 7,085 | 85 | 1.2% |
| 73 | East Dundee | 1,521 | 18 | 1.2% |
| 74 | Lyons | 4,022 | 47 | 1.2% |
| 75 | St. Joseph | 1,462 | 17 | 1.2% |
| 76 | Colona | 1,978 | 23 | 1.2% |
| 77 | Champaign | 36,815 | 428 | 1.2% |
| 78 | Green Oaks | 1,552 | 18 | 1.2% |
| 79 | Homewood | 7,082 | 82 | 1.2% |
| 80 | Highland | 4,931 | 57 | 1.2% |
| 81 | Wheeling | 15,171 | 175 | 1.2% |
| 82 | Hoopeston | 1,999 | 23 | 1.2% |
| 83 | Algonquin | 10,968 | 126 | 1.1% |
| 84 | Charleston | 7,447 | 85 | 1.1% |
| 85 | Troy | 4,389 | 50 | 1.1% |
| 86 | Lincoln | 6,102 | 69 | 1.1% |
| 87 | Beach Park | 5,143 | 58 | 1.1% |
| 88 | Burr Ridge | 4,536 | 51 | 1.1% |
| 89 | La Grange Park | 5,285 | 59 | 1.1% |
| 90 | Zion | 8,813 | 98 | 1.1% |
| 91 | Oak Brook | 3,061 | 34 | 1.1% |
| 92 | Rockton | 2,910 | 32 | 1.1% |
| 93 | Lebanon | 1,564 | 17 | 1.1% |
| 94 | Lake Bluff | 2,212 | 24 | 1.1% |
| 95 | Henry | 1,034 | 11 | 1.1% |
| 96 | Brookfield | 7,683 | 81 | 1.1% |
| 97 | Oakbrook Terrace | 1,334 | 14 | 1.0% |
| 98 | Wilmington | 2,296 | 24 | 1.0% |
| 99 | Justice | 4,900 | 51 | 1.0% |
| 100 | Mount Vernon | 6,108 | 63 | 1.0% |
Source: U.S. Census ACS 2020-2024. Places with over 1,000 households.
Summary
There You Have It – The Most LGBT Friendly Cities In Illinois For 2026
If you’re looking at the number of gay households in Illinois, this is an accurate list.
The gayest cities in Illinois are Gilberts, Polo, Mount Morris, Johnston City, Riverside, Stickney, Silvis, River Grove, Olympia Fields, and Wadsworth. Not sold on Illinois? Take the two-minute Find Your Place quiz and see which state actually fits you.


