100 Biggest Cities In Massachusetts For 2026
Using the latest Census data, we detail the 100 biggest cities in Massachusetts. You can all see a comprehensive list of all 212 cities and places in Massachusetts.

We all love the biggest cities that the Bay State has to offer. You know the places like Boston and Worcester which make all the headlines.
But there are a bunch of other great large cities in Massachusetts that don't get as much love.
We're going to change that right now.
Using the most recent Census data, we can tell you about all the places in Massachusetts with a focus on the biggest. We update the data each year and this is our fourth time doing this.
Table Of Contents: Top Ten | Methodology | Table
The Largest Cities In Massachusetts For 2026:
You can click here to see a full table of the full of the 100 biggest cities in Massachusetts, along with every other place over 1,000 people big. It is sortable by clicking on the headers.
Read on below to see more on the biggest cities. Or for more reading on places to live in Massachusetts, check out:
- Best Places To Live In Massachusetts
- Cheapest Places To Live In Massachusetts
- Most Dangerous Cities In Massachusetts
The 10 Biggest Cities In Massachusetts

/10
Rank Last Year: 1 (No Change)
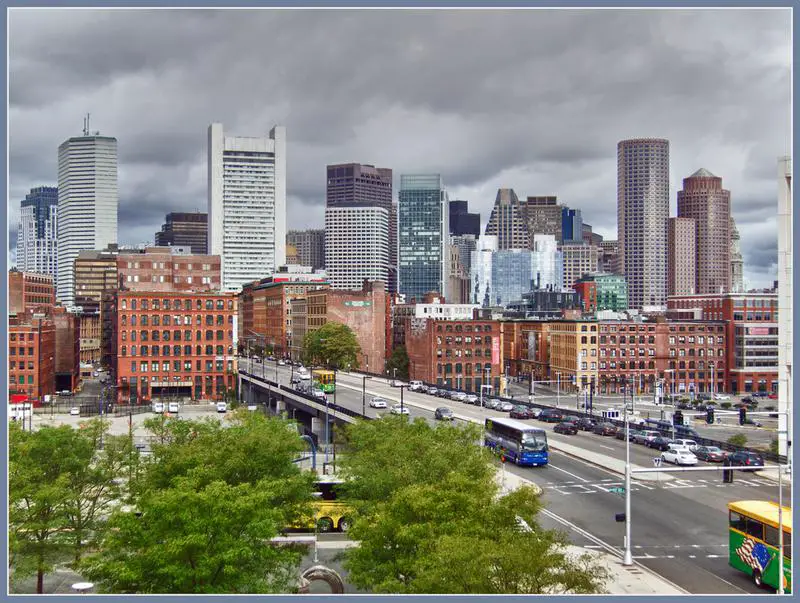
Population: 666,442.0
Population 2010: 602,609
Growth: 10.6%
More on Boston: Data | Crime | Cost Of Living | Real Estate

/10
Rank Last Year: 2 (No Change)
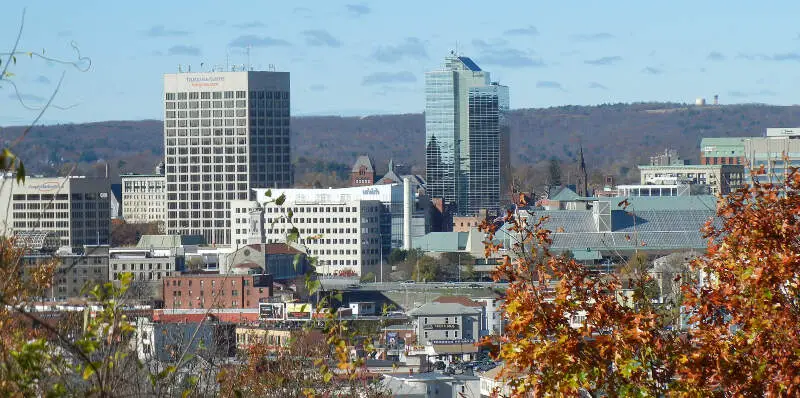
Population: 207,055.0
Population 2010: 179,994
Growth: 15.0%
More on Worcester: Data | Crime | Cost Of Living | Real Estate

/10
Rank Last Year: 3 (No Change)
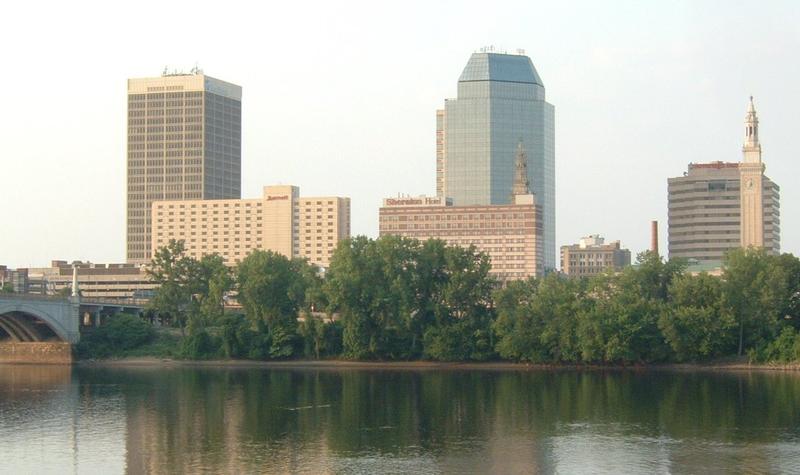
Population: 154,749.0
Population 2010: 152,906
Growth: 1.2%
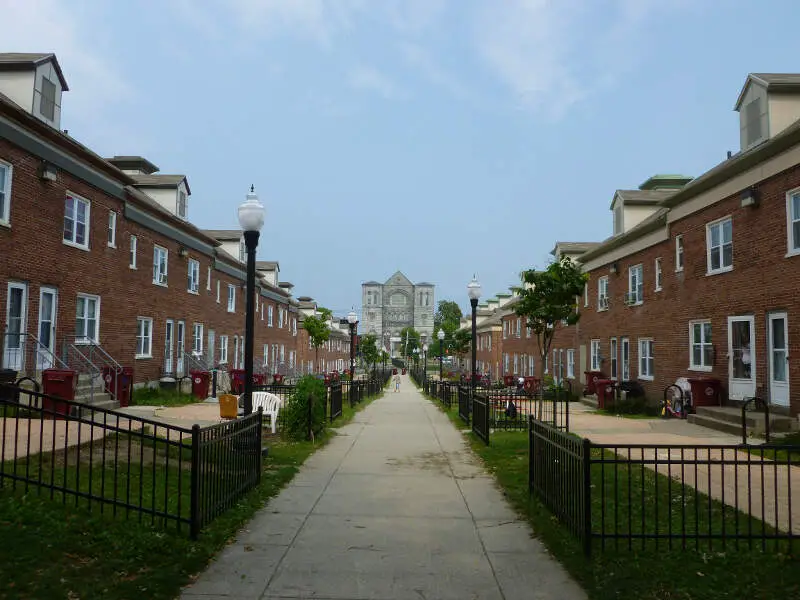
More on Springfield: Data | Crime | Cost Of Living | Real Estate

/10
Rank Last Year: 4 (No Change)
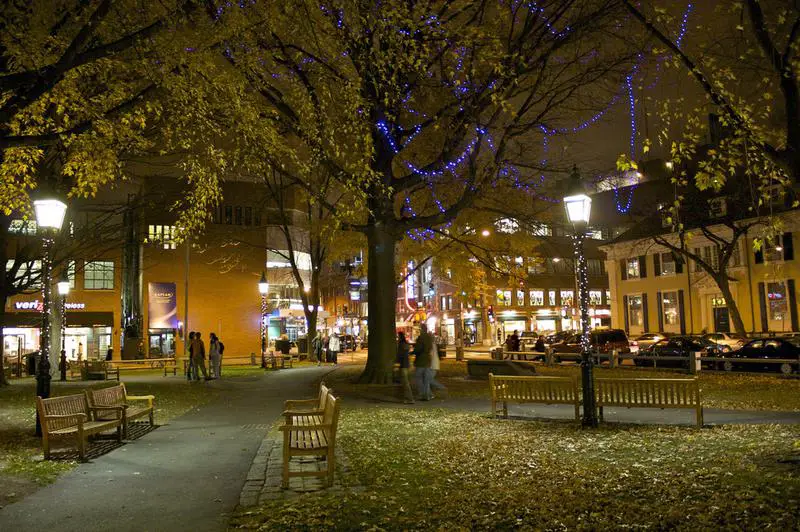
Population: 118,796.0
Population 2010: 103,506
Growth: 14.8%
More on Cambridge: Data | Crime | Cost Of Living | Real Estate

/10
Rank Last Year: 5 (No Change)
Population: 118,368.0
Population 2010: 105,089
Growth: 12.6%
More on Lowell: Data | Crime | Cost Of Living | Real Estate

/10
Rank Last Year: 6 (No Change)
Population: 105,386.0
Population 2010: 93,869
Growth: 12.3%
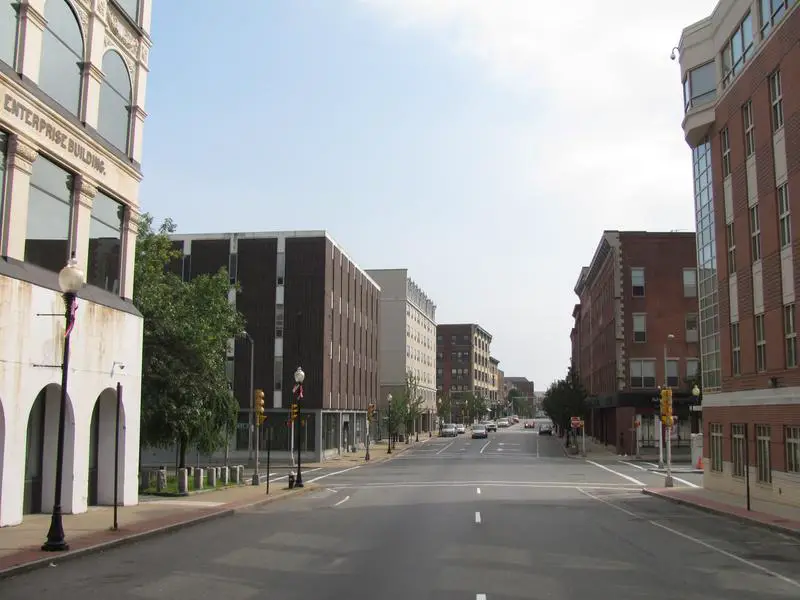
More on Brockton: Data | Crime | Cost Of Living | Real Estate

/10
Rank Last Year: 7 (No Change)
Population: 102,114.0
Population 2010: 90,780
Growth: 12.5%
More on Quincy: Data | Crime | Cost Of Living | Real Estate

/10
Rank Last Year: 8 (No Change)
Population: 101,709.0
Population 2010: 89,625
Growth: 13.5%
More on Lynn: Data | Crime | Cost Of Living | Real Estate

/10
Rank Last Year: 9 (No Change)
Population: 100,998.0
Population 2010: 94,945
Growth: 6.4%
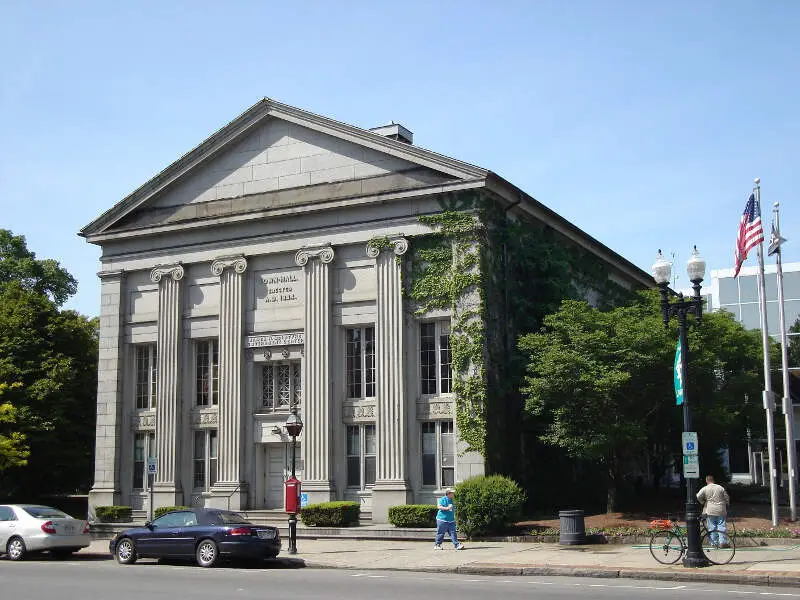
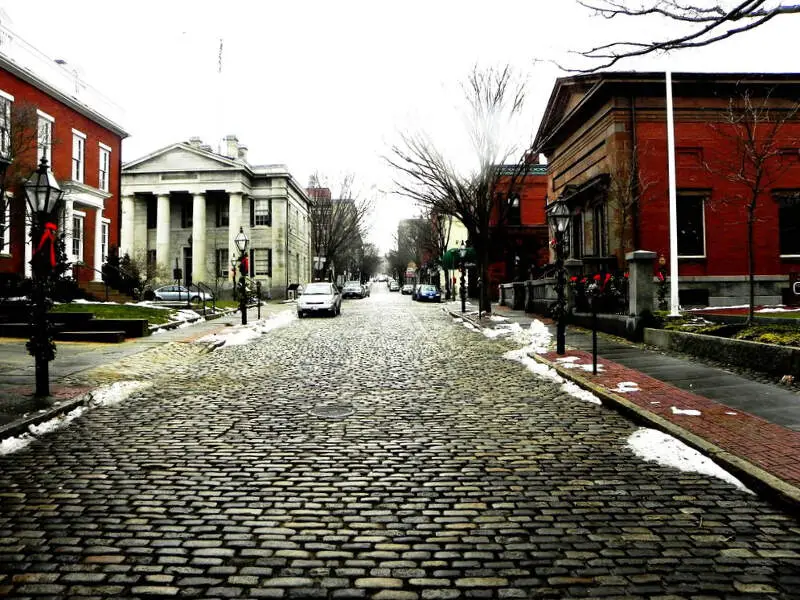
More on New Bedford: Data | Crime | Cost Of Living | Real Estate

/10
Rank Last Year: 10 (No Change)
Population: 94,082.0
Population 2010: 89,482
Growth: 5.1%
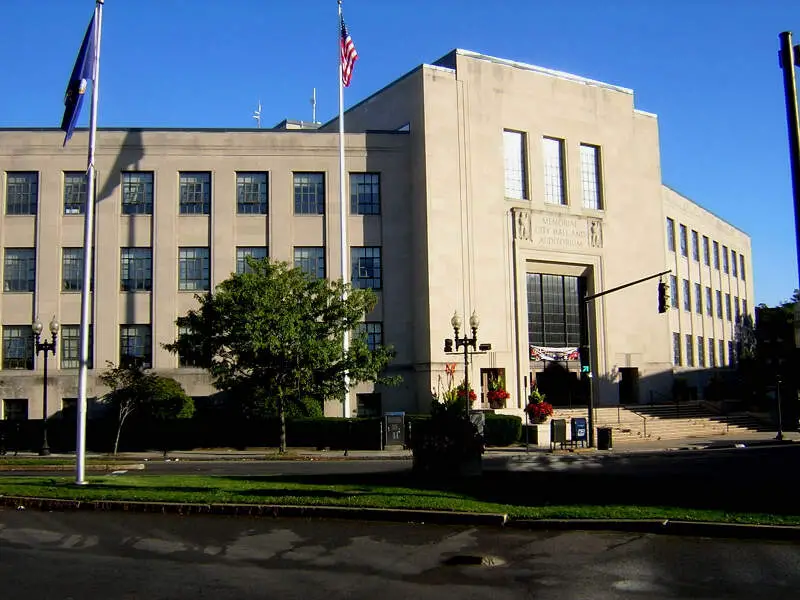
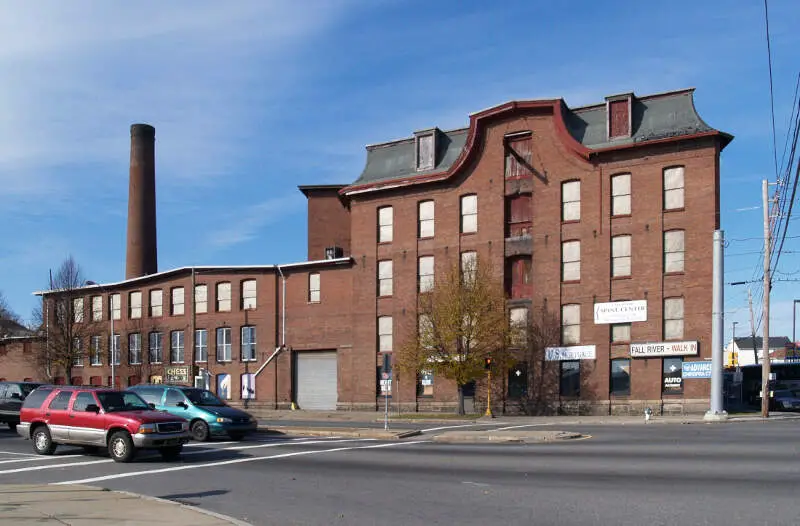
More on Fall River: Data | Crime | Cost Of Living | Real Estate
How We Determined The Largest Cities In Massachusetts
We've been ranking and dissecting cities in the Bay State for over 4 years now -- making this actually the fourth time we've run the numbers. We always use the best data, the US Census. In this case, that means we are using the American Community Survey.
It what is probably the most simple analysis we run each year, we ranked every place in Massachusetts from biggest to smallest. The biggest city this year? That would be Boston.
The smallest? Millers Falls, although there are places smaller than 1,000 people not listed here, so keep that in mind as we take a look at the top ten.
Now on to numbers 11-100 Biggest in Massachusetts
We hope that you find the big city, or really any city, that's right for you. Below is a list of the rest of the biggest cities along with every other place in Massachusetts.
Have fun snacking around in the Bay State!
For more reading on Massachusetts, check out:
- Best Places To Raise A Family In Massachusetts
- Best Places To Retire In Massachusetts
- Richest Cities In Massachusetts
- Safest Places In Massachusetts
- Worst Places To Live In Massachusetts
- Most Expensive Places To Live In Massachusetts
Detailed List Of The Biggest Cities In Massachusetts
| Rank | City | Current Population | 2010 | Growth | |||||
|---|---|---|---|---|---|---|---|---|---|
| 1 | Boston | 666,442.0 | 602,609 | 10.6% | |||||
| 2 | Worcester | 207,055.0 | 179,994 | 15.0% | |||||
| 3 | Springfield | 154,749.0 | 152,906 | 1.2% | |||||
| 4 | Cambridge | 118,796.0 | 103,506 | 14.8% | |||||
| 5 | Lowell | 118,368.0 | 105,089 | 12.6% | |||||
| 6 | Brockton | 105,386.0 | 93,869 | 12.3% | |||||
| 7 | Quincy | 102,114.0 | 90,780 | 12.5% | |||||
| 8 | Lynn | 101,709.0 | 89,625 | 13.5% | |||||
| 9 | New Bedford | 100,998.0 | 94,945 | 6.4% | |||||
| 10 | Fall River | 94,082.0 | 89,482 | 5.1% | |||||
| 11 | Newton | 89,044.0 | 83,949 | 6.1% | |||||
| 12 | Lawrence | 88,736.0 | 75,177 | 18.0% | |||||
| 13 | Somerville | 81,036.0 | 75,215 | 7.7% | |||||
| 14 | Haverhill | 67,698.0 | 60,203 | 12.4% | |||||
| 15 | Malden | 65,906.0 | 58,180 | 13.3% | |||||
| 16 | Waltham | 64,902.0 | 59,771 | 8.6% | |||||
| 17 | Brookline | 63,266.0 | 57,953 | 9.2% | |||||
| 18 | Taunton | 60,433.0 | 55,954 | 8.0% | |||||
| 19 | Revere | 60,012.0 | 50,008 | 20.0% | |||||
| 20 | Medford | 59,354.0 | 55,451 | 7.0% | |||||
| 21 | Weymouth Town | 58,505.0 | 53,342 | 9.7% | |||||
| 22 | Chicopee | 55,295.0 | 55,165 | 0.2% | |||||
| 23 | Peabody | 54,695.0 | 50,455 | 8.4% | |||||
| 24 | Everett | 50,045.0 | 40,560 | 23.4% | |||||
| 25 | Barnstable Town | 49,568.0 | 45,775 | 8.3% | |||||
| 26 | Attleboro | 46,762.0 | 43,355 | 7.9% | |||||
| 27 | Arlington | 46,350.0 | 42,240 | 9.7% | |||||
| 28 | Salem | 44,795.0 | 40,964 | 9.4% | |||||
| 29 | Leominster | 43,909.0 | 40,941 | 7.2% | |||||
| 30 | Pittsfield | 43,457.0 | 44,788 | -3.0% | |||||
| 31 | Beverly | 42,665.0 | 39,351 | 8.4% | |||||
| 32 | Woburn | 41,939.0 | 37,538 | 11.7% | |||||
| 33 | Fitchburg | 41,798.0 | 40,214 | 3.9% | |||||
| 34 | Marlborough | 41,647.0 | 37,674 | 10.5% | |||||
| 35 | Westfield | 40,378.0 | 40,974 | -1.5% | |||||
| 36 | Chelsea | 39,908.0 | 34,532 | 15.6% | |||||
| 37 | Braintree Town | 38,899.0 | 35,122 | 10.8% | |||||
| 38 | Holyoke | 37,813.0 | 39,885 | -5.2% | |||||
| 39 | Lexington | 34,295.0 | 30,862 | 11.1% | |||||
| 40 | Franklin Town | 33,154.0 | 31,023 | 6.9% | |||||
| 41 | Needham | 32,459.0 | 28,683 | 13.2% | |||||
| 42 | Norwood | 31,542.0 | 28,375 | 11.2% | |||||
| 43 | Northampton | 30,962.0 | 28,709 | 7.8% | |||||
| 44 | Wellesley | 30,347.0 | 27,623 | 9.9% | |||||
| 45 | Gloucester | 30,075.0 | 28,893 | 4.1% | |||||
| 46 | Melrose | 29,650.0 | 26,704 | 11.0% | |||||
| 47 | Saugus | 28,773.0 | 26,392 | 9.0% | |||||
| 48 | West Springfield Town | 28,772.0 | 28,287 | 1.7% | |||||
| 49 | Milton | 28,587.0 | 26,667 | 7.2% | |||||
| 50 | Agawam Town | 28,539.0 | 28,383 | 0.5% | |||||
| 51 | Danvers | 28,098.0 | 26,113 | 7.6% | |||||
| 52 | Wakefield | 27,793.0 | 24,620 | 12.9% | |||||
| 53 | Milford | 27,731.0 | 24,949 | 11.2% | |||||
| 54 | Belmont | 27,175.0 | 24,356 | 11.6% | |||||
| 55 | Burlington | 26,274.0 | 23,926 | 9.8% | |||||
| 56 | Reading | 25,612.0 | 24,261 | 5.6% | |||||
| 57 | Dedham | 25,237.0 | 24,325 | 3.7% | |||||
| 58 | Winchester | 23,406.0 | 21,016 | 11.4% | |||||
| 59 | Stoneham | 23,355.0 | 21,320 | 9.5% | |||||
| 60 | Wilmington | 23,336.0 | 21,891 | 6.6% | |||||
| 61 | Gardner | 21,148.0 | 20,386 | 3.7% | |||||
| 62 | Marblehead | 20,413.0 | 19,797 | 3.1% | |||||
| 63 | Winthrop Town | 18,759.0 | 17,311 | 8.4% | |||||
| 64 | Newburyport | 18,652.0 | 17,288 | 7.9% | |||||
| 65 | Somerset | 18,298.0 | 18,185 | 0.6% | |||||
| 66 | Southbridge Town | 17,928.0 | 16,851 | 6.4% | |||||
| 67 | Abington | 17,053.0 | 15,704 | 8.6% | |||||
| 68 | Hudson | 15,719.0 | 14,653 | 7.3% | |||||
| 69 | Longmeadow | 15,696.0 | 15,759 | -0.4% | |||||
| 70 | Swampscott | 15,277.0 | 13,819 | 10.6% | |||||
| 71 | Lynnfield | 13,064.0 | 11,487 | 13.7% | |||||
| 72 | North Adams | 12,606.0 | 13,851 | -9.0% | |||||
| 73 | Palmer Town | 12,381.0 | 12,196 | 1.5% | |||||
| 74 | Webster | 12,228.0 | 11,393 | 7.3% | |||||
| 75 | South Yarmouth | 11,552.0 | 11,468 | 0.7% | |||||
| 76 | Holbrook | 11,380.0 | 10,694 | 6.4% | |||||
| 77 | Maynard | 10,712.0 | 10,036 | 6.7% | |||||
| 78 | Hull | 10,138.0 | 10,420 | -2.7% | |||||
| 79 | Nantucket | 10,017.0 | 7,951 | 26.0% | |||||
| 80 | Andover | 9,451.0 | 8,586 | 10.1% | |||||
| 81 | Athol | 8,801.0 | 8,020 | 9.7% | |||||
| 82 | Middleborough Center | 8,155.0 | 6,673 | 22.2% | |||||
| 83 | Plymouth | 7,918.0 | 6,759 | 17.1% | |||||
| 84 | Clinton | 7,658.0 | 7,201 | 6.3% | |||||
| 85 | Mansfield Center | 7,222.0 | 7,601 | -5.0% | |||||
| 86 | Whitinsville | 7,115.0 | 7,055 | 0.9% | |||||
| 87 | Medfield | 6,849.0 | 6,564 | 4.3% | |||||
| 88 | Pinehurst | 6,845.0 | 7,190 | -4.8% | |||||
| 89 | North Scituate | 6,492.0 | 5,493 | 18.2% | |||||
| 90 | Cochituate | 6,471.0 | 6,397 | 1.2% | |||||
| 91 | Walpole | 6,461.0 | 6,438 | 0.4% | |||||
| 92 | Northborough | 6,392.0 | 6,054 | 5.6% | |||||
| 93 | Ware | 6,369.0 | 5,806 | 9.7% | |||||
| 94 | Foxborough | 6,251.0 | 5,113 | 22.3% | |||||
| 95 | East Falmouth | 6,245.0 | 5,986 | 4.3% | |||||
| 96 | Sharon | 6,232.0 | 5,198 | 19.9% | |||||
| 97 | West Yarmouth | 6,194.0 | 6,103 | 1.5% | |||||
| 98 | Yarmouth Port | 5,961.0 | 5,176 | 15.2% | |||||
| 99 | Kingston | 5,910.0 | 5,686 | 3.9% | |||||
| 100 | West Concord | 5,876.0 | 6,204 | -5.3% | |||||
| 101 | Scituate | 5,796.0 | 5,324 | 8.9% | |||||
| 102 | Oxford | 5,671.0 | 6,373 | -11.0% | |||||
| 103 | Spencer | 5,661.0 | 5,655 | 0.1% | |||||
| 104 | Salisbury | 5,656.0 | 4,891 | 15.6% | |||||
| 105 | East Harwich | 5,654.0 | 4,694 | 20.5% | |||||
| 106 | Adams | 5,427.0 | 5,260 | 3.2% | |||||
| 107 | Bliss Corner | 5,405.0 | 5,649 | -4.3% | |||||
| 108 | Bellingham | 5,325.0 | 4,574 | 16.4% | |||||
| 109 | North Westport | 5,289.0 | 4,193 | 26.1% | |||||
| 110 | The Pinehills | 5,282.0 | 910 | 480.4% | |||||
| 111 | Marshfield | 5,161.0 | 4,445 | 16.1% | |||||
| 112 | Hingham | 5,130.0 | 5,769 | -11.1% | |||||
| 113 | Williamstown | 5,070.0 | 3,845 | 31.9% | |||||
| 114 | Ipswich | 4,924.0 | 3,997 | 23.2% | |||||
| 115 | Raynham Center | 4,841.0 | 4,079 | 18.7% | |||||
| 116 | Rockport | 4,704.0 | 5,312 | -11.4% | |||||
| 117 | Westborough | 4,699.0 | 3,961 | 18.6% | |||||
| 118 | Smith Mills | 4,612.0 | 4,825 | -4.4% | |||||
| 119 | Ocean Bluff-Brant Rock | 4,540.0 | 4,886 | -7.1% | |||||
| 120 | Millis-Clicquot | 4,437.0 | 4,493 | -1.2% | |||||
| 121 | Hopedale | 4,360.0 | 4,014 | 8.6% | |||||
| 122 | North Plymouth | 4,337.0 | 3,782 | 14.7% | |||||
| 123 | Winchendon | 4,331.0 | 4,024 | 7.6% | |||||
| 124 | Turners Falls | 4,124.0 | 4,550 | -9.4% | |||||
| 125 | Sagamore | 4,072.0 | 3,652 | 11.5% | |||||
| 126 | Falmouth | 3,954.0 | 3,982 | -0.7% | |||||
| 127 | Northwest Harwich | 3,932.0 | 4,346 | -9.5% | |||||
| 128 | East Sandwich | 3,864.0 | 3,823 | 1.1% | |||||
| 129 | Forestdale | 3,801.0 | 4,237 | -10.3% | |||||
| 130 | Orange | 3,737.0 | 3,849 | -2.9% | |||||
| 131 | Dennis Port | 3,691.0 | 3,436 | 7.4% | |||||
| 132 | Wilbraham | 3,679.0 | 3,258 | 12.9% | |||||
| 133 | Wareham Center | 3,635.0 | 2,874 | 26.5% | |||||
| 134 | North Lakeville | 3,624.0 | 2,150 | 68.6% | |||||
| 135 | Ocean Grove | 3,453.0 | 3,074 | 12.3% | |||||
| 136 | Provincetown | 3,452.0 | 2,851 | 21.1% | |||||
| 137 | Hopkinton | 3,426.0 | 2,048 | 67.3% | |||||
| 138 | North Pembroke | 3,393.0 | 2,746 | 23.6% | |||||
| 139 | Nahant | 3,325.0 | 3,431 | -3.1% | |||||
| 140 | Littleton Common | 3,289.0 | 2,890 | 13.8% | |||||
| 141 | Monument Beach | 3,277.0 | 2,622 | 25.0% | |||||
| 142 | South Duxbury | 3,252.0 | 3,377 | -3.7% | |||||
| 143 | Upton | 3,234.0 | 2,814 | 14.9% | |||||
| 144 | South Dennis | 3,135.0 | 3,800 | -17.5% | |||||
| 145 | Ayer | 3,098.0 | 2,350 | 31.8% | |||||
| 146 | East Dennis | 3,062.0 | 2,939 | 4.2% | |||||
| 147 | Cordaville | 2,989.0 | 2,749 | 8.7% | |||||
| 148 | East Douglas | 2,987.0 | 2,303 | 29.7% | |||||
| 149 | North Seekonk | 2,974.0 | 2,588 | 14.9% | |||||
| 150 | Buzzards Bay | 2,909.0 | 3,723 | -21.9% | |||||
| 151 | Sandwich | 2,890.0 | 2,968 | -2.6% | |||||
| 152 | North Falmouth | 2,838.0 | 3,187 | -11.0% | |||||
| 153 | Acushnet Center | 2,810.0 | 2,611 | 7.6% | |||||
| 154 | Mattapoisett Center | 2,669.0 | 2,907 | -8.2% | |||||
| 155 | Norton Center | 2,663.0 | 2,604 | 2.3% | |||||
| 156 | North Brookfield | 2,659.0 | 2,007 | 32.5% | |||||
| 157 | Topsfield | 2,624.0 | 2,857 | -8.2% | |||||
| 158 | West Dennis | 2,556.0 | 2,022 | 26.4% | |||||
| 159 | Baldwinville | 2,528.0 | 2,002 | 26.3% | |||||
| 160 | Vineyard Haven | 2,469.0 | 2,470 | -0.0% | |||||
| 161 | Sturbridge | 2,443.0 | 2,152 | 13.5% | |||||
| 162 | Dennis | 2,424.0 | 2,360 | 2.7% | |||||
| 163 | Belchertown | 2,355.0 | 2,395 | -1.7% | |||||
| 164 | Great Barrington | 2,331.0 | 2,376 | -1.9% | |||||
| 165 | Fiskdale | 2,311.0 | 2,544 | -9.2% | |||||
| 166 | Dover | 2,308.0 | 2,390 | -3.4% | |||||
| 167 | Boxford | 2,284.0 | 2,406 | -5.1% | |||||
| 168 | West Wareham | 2,257.0 | 2,085 | 8.2% | |||||
| 169 | Pocasset | 2,247.0 | 2,691 | -16.5% | |||||
| 170 | Harwich Port | 2,238.0 | 1,478 | 51.4% | |||||
| 171 | South Lancaster | 2,177.0 | 1,749 | 24.5% | |||||
| 172 | Hanscom Afb | 2,110.0 | 0 | nan% | |||||
| 173 | North Eastham | 2,085.0 | 1,648 | 26.5% | |||||
| 174 | Lunenburg | 2,057.0 | 1,492 | 37.9% | |||||
| 175 | Rutland | 2,019.0 | 2,320 | -13.0% | |||||
| 176 | Brewster | 1,994.0 | 2,108 | -5.4% | |||||
| 177 | Duxbury | 1,994.0 | 1,672 | 19.3% | |||||
| 178 | Marshfield Hills | 1,978.0 | 2,455 | -19.4% | |||||
| 179 | Pepperell | 1,971.0 | 2,423 | -18.7% | |||||
| 180 | East Pepperell | 1,949.0 | 2,009 | -3.0% | |||||
| 181 | Hanson | 1,927.0 | 1,886 | 2.2% | |||||
| 182 | South Deerfield | 1,882.0 | 1,801 | 4.5% | |||||
| 183 | Lenox | 1,866.0 | 1,435 | 30.0% | |||||
| 184 | Shelburne Falls | 1,845.0 | 1,736 | 6.3% | |||||
| 185 | Bourne | 1,806.0 | 1,263 | 43.0% | |||||
| 186 | Harwich Center | 1,774.0 | 1,773 | 0.1% | |||||
| 187 | Teaticket | 1,759.0 | 1,701 | 3.4% | |||||
| 188 | Devens | 1,723.0 | 1,874 | -8.1% | |||||
| 189 | Rowley | 1,708.0 | 1,365 | 25.1% | |||||
| 190 | Essex | 1,688.0 | 1,538 | 9.8% | |||||
| 191 | White Island Shores | 1,620.0 | 2,342 | -30.8% | |||||
| 192 | Monson Center | 1,613.0 | 2,073 | -22.2% | |||||
| 193 | Chatham | 1,600.0 | 1,751 | -8.6% | |||||
| 194 | West Brookfield | 1,563.0 | 1,666 | -6.2% | |||||
| 195 | Lee | 1,511.0 | 2,123 | -28.8% | |||||
| 196 | South Ashburnham | 1,500.0 | 1,169 | 28.3% | |||||
| 197 | Orleans | 1,480.0 | 1,548 | -4.4% | |||||
| 198 | Weweantic | 1,452.0 | 1,971 | -26.3% | |||||
| 199 | Hatfield | 1,449.0 | 1,407 | 3.0% | |||||
| 200 | East Brookfield | 1,445.0 | 1,266 | 14.1% | |||||
| 201 | Warren | 1,426.0 | 1,189 | 19.9% | |||||
| 202 | Onset | 1,380.0 | 926 | 49.0% | |||||
| 203 | Marion Center | 1,335.0 | 1,155 | 15.6% | |||||
| 204 | West Falmouth | 1,325.0 | 1,514 | -12.5% | |||||
| 205 | Holland | 1,301.0 | 1,658 | -21.5% | |||||
| 206 | West Chatham | 1,258.0 | 1,134 | 10.9% | |||||
| 207 | Groton | 1,232.0 | 1,340 | -8.1% | |||||
| 208 | Granby | 1,152.0 | 1,227 | -6.1% | |||||
| 209 | Shirley | 1,146.0 | 1,475 | -22.3% | |||||
| 210 | Housatonic | 1,113.0 | 1,292 | -13.9% | |||||
| 211 | Northfield | 1,070.0 | 969 | 10.4% | |||||
| 212 | Millers Falls | 1,054.0 | 1,298 | -18.8% | |||||