100 Biggest Cities In Colorado For 2026
Using the latest Census data, we detail the 100 biggest cities in Colorado. You can all see a comprehensive list of all 212 cities and places in Colorado.

We all love the biggest cities that the Centennial State has to offer. You know the places like Denver and Colorado Springs which make all the headlines.
But there are a bunch of other great large cities in Colorado that don't get as much love.
We're going to change that right now.
Using the most recent Census data, we can tell you about all the places in Colorado with a focus on the biggest. We update the data each year and this is our fourth time doing this.
Table Of Contents: Top Ten | Methodology | Table
The Largest Cities In Colorado For 2026:
You can click here to see a full table of the full of the 100 biggest cities in Colorado, along with every other place over 1,000 people big. It is sortable by clicking on the headers.
Read on below to see more on the biggest cities. Or for more reading on places to live in Colorado, check out:
The 10 Biggest Cities In Colorado

/10
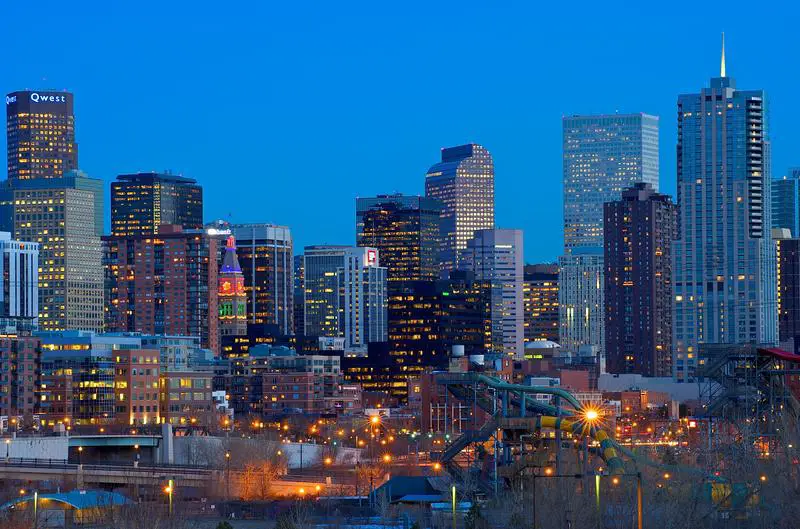
Rank Last Year: 1 (No Change)
Population: 718,877.0
Population 2010: 578,087
Growth: 24.4%
More on Denver: Data | Crime | Cost Of Living | Real Estate

/10
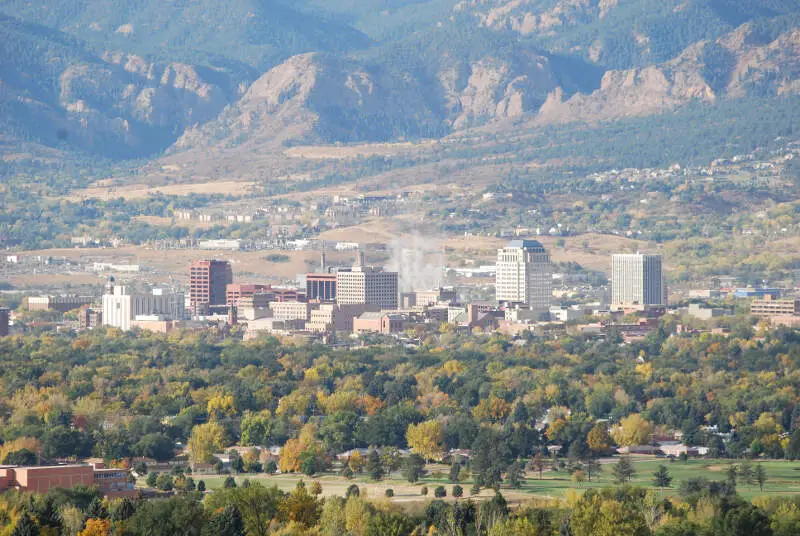
Rank Last Year: 2 (No Change)
Population: 487,887.0
Population 2010: 403,983
Growth: 20.8%
More on Colorado Springs: Data | Crime | Cost Of Living | Real Estate

/10
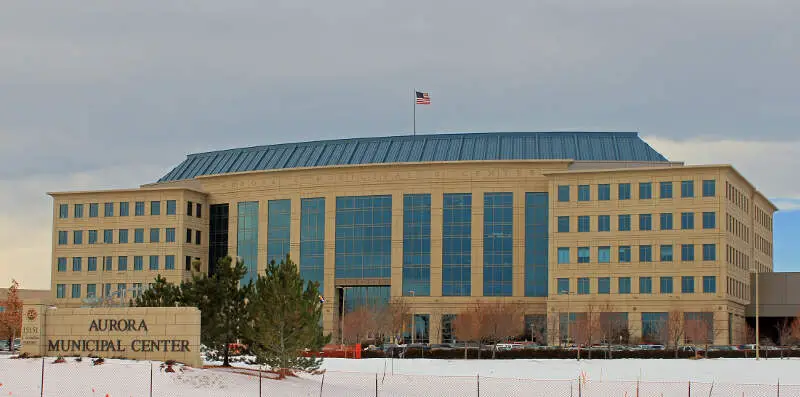
Rank Last Year: 3 (No Change)
Population: 394,432.0
Population 2010: 314,092
Growth: 25.6%
More on Aurora: Data | Crime | Cost Of Living | Real Estate

/10
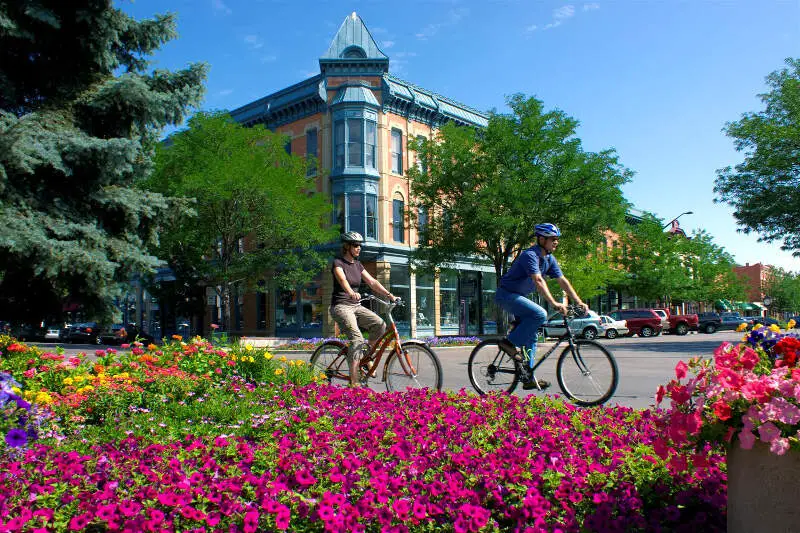
Rank Last Year: 4 (No Change)
Population: 170,229.0
Population 2010: 140,082
Growth: 21.5%
More on Fort Collins: Data | Crime | Cost Of Living | Real Estate

/10
Rank Last Year: 5 (No Change)
Population: 156,583.0
Population 2010: 142,020
Growth: 10.3%
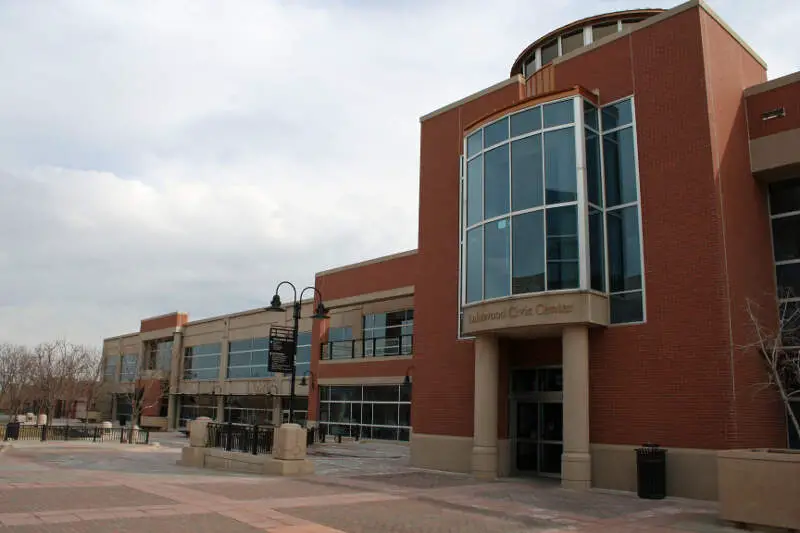
More on Lakewood: Data | Crime | Cost Of Living | Real Estate

/10
Rank Last Year: 6 (No Change)
Population: 144,187.0
Population 2010: 112,374
Growth: 28.3%
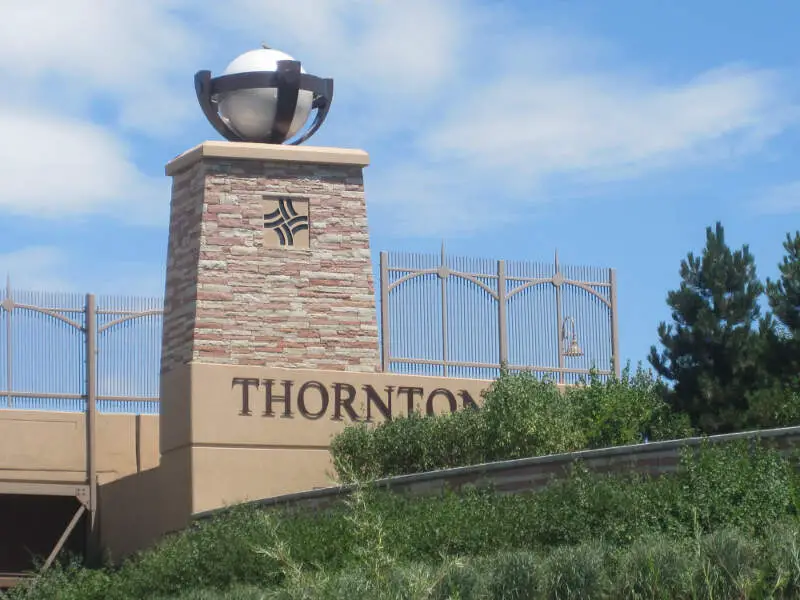
More on Thornton: Data | Crime | Cost Of Living | Real Estate

/10
Rank Last Year: 7 (No Change)
Population: 122,634.0
Population 2010: 104,885
Growth: 16.9%
More on Arvada: Data | Crime | Cost Of Living | Real Estate

/10
Rank Last Year: 8 (No Change)
Population: 115,484.0
Population 2010: 104,869
Growth: 10.1%
More on Westminster: Data | Crime | Cost Of Living | Real Estate

/10
Rank Last Year: 9 (No Change)
Population: 111,561.0
Population 2010: 105,957
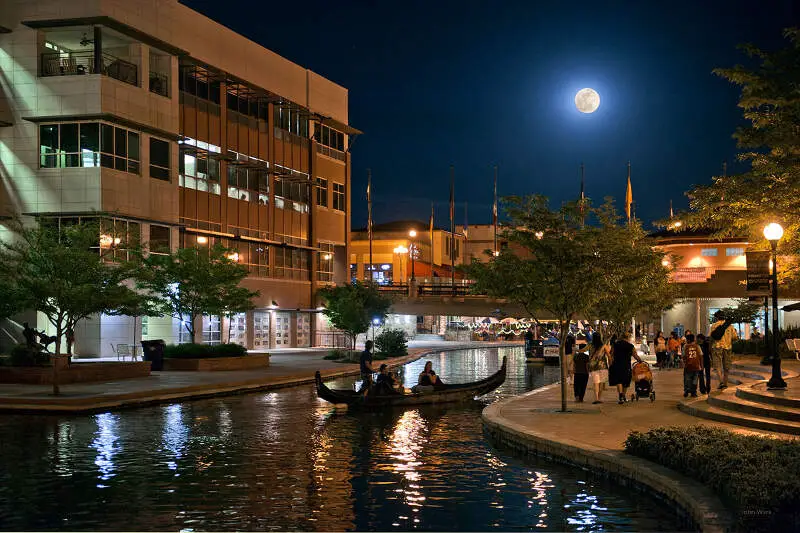
Growth: 5.3%
More on Pueblo: Data | Crime | Cost Of Living | Real Estate

/10
Rank Last Year: 10 (No Change)
Population: 110,806.0
Population 2010: 91,115
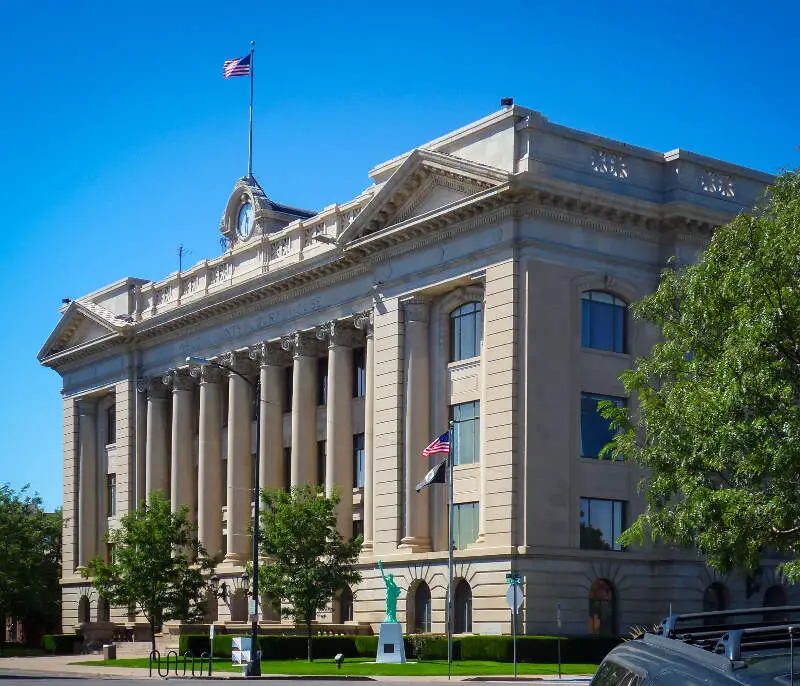
Growth: 21.6%
More on Greeley: Data | Crime | Cost Of Living | Real Estate
How We Determined The Largest Cities In Colorado
We've been ranking and dissecting cities in the Centennial State for over 4 years now -- making this actually the fourth time we've run the numbers. We always use the best data, the US Census. In this case, that means we are using the American Community Survey.
It what is probably the most simple analysis we run each year, we ranked every place in Colorado from biggest to smallest. The biggest city this year? That would be Denver.
The smallest? Aetna Estates, although there are places smaller than 1,000 people not listed here, so keep that in mind as we take a look at the top ten.
Now on to numbers 11-100 Biggest in Colorado
We hope that you find the big city, or really any city, that's right for you. Below is a list of the rest of the biggest cities along with every other place in Colorado.
Have fun snacking around in the Centennial State!
For more reading on Colorado, check out:
- Best Places To Raise A Family In Colorado
- Best Places To Retire In Colorado
- Richest Cities In Colorado
- Safest Places In Colorado
- Worst Places To Live In Colorado
- Most Expensive Places To Live In Colorado
Detailed List Of The Biggest Cities In Colorado
| Rank | City | Current Population | 2010 | Growth | |||||
|---|---|---|---|---|---|---|---|---|---|
| 1 | Denver | 718,877.0 | 578,087 | 24.4% | |||||
| 2 | Colorado Springs | 487,887.0 | 403,983 | 20.8% | |||||
| 3 | Aurora | 394,432.0 | 314,092 | 25.6% | |||||
| 4 | Fort Collins | 170,229.0 | 140,082 | 21.5% | |||||
| 5 | Lakewood | 156,583.0 | 142,020 | 10.3% | |||||
| 6 | Thornton | 144,187.0 | 112,374 | 28.3% | |||||
| 7 | Arvada | 122,634.0 | 104,885 | 16.9% | |||||
| 8 | Westminster | 115,484.0 | 104,869 | 10.1% | |||||
| 9 | Pueblo | 111,561.0 | 105,957 | 5.3% | |||||
| 10 | Greeley | 110,806.0 | 91,115 | 21.6% | |||||
| 11 | Centennial | 108,201.0 | 99,999 | 8.2% | |||||
| 12 | Boulder | 106,433.0 | 97,050 | 9.7% | |||||
| 13 | Highlands Ranch | 102,257.0 | 95,100 | 7.5% | |||||
| 14 | Longmont | 99,406.0 | 83,604 | 18.9% | |||||
| 15 | Castle Rock | 79,123.0 | 44,402 | 78.2% | |||||
| 16 | Loveland | 78,410.0 | 64,105 | 22.3% | |||||
| 17 | Broomfield | 76,304.0 | 52,872 | 44.3% | |||||
| 18 | Grand Junction | 68,142.0 | 56,295 | 21.0% | |||||
| 19 | Commerce City | 66,445.0 | 41,495 | 60.1% | |||||
| 20 | Parker | 61,783.0 | 42,548 | 45.2% | |||||
| 21 | Littleton | 44,710.0 | 41,352 | 8.1% | |||||
| 22 | Brighton | 42,059.0 | 31,181 | 34.9% | |||||
| 23 | Northglenn | 38,014.0 | 35,127 | 8.2% | |||||
| 24 | Windsor | 37,914.0 | 17,306 | 119.1% | |||||
| 25 | Security-Widefield | 37,345.0 | 31,887 | 17.1% | |||||
| 26 | Pueblo West | 35,681.0 | 27,854 | 28.1% | |||||
| 27 | Englewood | 34,129.0 | 30,342 | 12.5% | |||||
| 28 | Erie | 33,808.0 | 16,134 | 109.5% | |||||
| 29 | Dakota Ridge | 33,753.0 | 30,776 | 9.7% | |||||
| 30 | Ken Caryl | 33,233.0 | 33,657 | -1.3% | |||||
| 31 | Wheat Ridge | 32,070.0 | 30,379 | 5.6% | |||||
| 32 | Lafayette | 30,602.0 | 24,187 | 26.5% | |||||
| 33 | Fountain | 29,300.0 | 23,781 | 23.2% | |||||
| 34 | Columbine | 25,478.0 | 23,972 | 6.3% | |||||
| 35 | Evans | 22,396.0 | 17,223 | 30.0% | |||||
| 36 | Montrose | 21,044.0 | 18,237 | 15.4% | |||||
| 37 | Louisville | 20,786.0 | 18,470 | 12.5% | |||||
| 38 | Golden | 20,417.0 | 18,414 | 10.9% | |||||
| 39 | Cimarron Hills | 19,817.0 | 15,600 | 27.0% | |||||
| 40 | Clifton | 19,518.0 | 19,985 | -2.3% | |||||
| 41 | Durango | 19,411.0 | 16,501 | 17.6% | |||||
| 42 | John | 18,883.0 | 8,656 | 118.1% | |||||
| 43 | Sherrelwood | 18,692.0 | 17,641 | 6.0% | |||||
| 44 | Firestone | 18,049.0 | 8,866 | 103.6% | |||||
| 45 | Fort Carson | 18,019.0 | 11,243 | 60.3% | |||||
| 46 | Frederick | 16,651.0 | 7,710 | 116.0% | |||||
| 47 | Welby | 16,197.0 | 13,964 | 16.0% | |||||
| 48 | Black Forest | 15,738.0 | 13,454 | 17.0% | |||||
| 49 | Greenwood Village | 15,420.0 | 13,367 | 15.4% | |||||
| 50 | Lone Tree | 14,147.0 | 9,890 | 43.0% | |||||
| 51 | Federal Heights | 14,125.0 | 11,586 | 21.9% | |||||
| 52 | Fruita | 13,691.0 | 11,676 | 17.3% | |||||
| 53 | Steamboat Springs | 13,433.0 | 11,796 | 13.9% | |||||
| 54 | Castle Pines | 13,388.0 | 0 | nan% | |||||
| 55 | Superior | 13,305.0 | 11,852 | 12.3% | |||||
| 56 | Sterling | 13,172.0 | 14,393 | -8.5% | |||||
| 57 | Berthoud | 12,411.0 | 5,143 | 141.3% | |||||
| 58 | The Pinery | 11,871.0 | 10,182 | 16.6% | |||||
| 59 | Wellington | 11,798.0 | 5,648 | 108.9% | |||||
| 60 | Monument | 11,735.0 | 4,869 | 141.0% | |||||
| 61 | Fort Morgan | 11,605.0 | 11,229 | 3.3% | |||||
| 62 | Berkley | 10,789.0 | 12,113 | -10.9% | |||||
| 63 | Edwards | 10,785.0 | 8,982 | 20.1% | |||||
| 64 | Cherry Creek | 10,721.0 | 10,691 | 0.3% | |||||
| 65 | Rifle | 10,570.0 | 8,880 | 19.0% | |||||
| 66 | Glenwood Springs | 10,241.0 | 9,427 | 8.6% | |||||
| 67 | Severance | 10,130.0 | 2,789 | 263.2% | |||||
| 68 | Gunbarrel | 10,051.0 | 9,473 | 6.1% | |||||
| 69 | Fairmount | 9,902.0 | 7,498 | 32.1% | |||||
| 70 | Alamosa | 9,879.0 | 8,693 | 13.6% | |||||
| 71 | Delta | 9,421.0 | 8,779 | 7.3% | |||||
| 72 | Roxborough Park | 9,085.0 | 9,134 | -0.5% | |||||
| 73 | Craig | 8,991.0 | 9,308 | -3.4% | |||||
| 74 | Cortez | 8,976.0 | 8,412 | 6.7% | |||||
| 75 | Gypsum | 8,941.0 | 6,054 | 47.7% | |||||
| 76 | Timnath | 8,941.0 | 447 | 1900.2% | |||||
| 77 | Woodmoor | 8,934.0 | 8,918 | 0.2% | |||||
| 78 | Stonegate | 8,906.0 | 8,754 | 1.7% | |||||
| 79 | Fort Lupton | 8,897.0 | 7,422 | 19.9% | |||||
| 80 | Milliken | 8,871.0 | 5,225 | 69.8% | |||||
| 81 | Redlands | 8,868.0 | 7,806 | 13.6% | |||||
| 82 | Lochbuie | 8,609.0 | 4,306 | 99.9% | |||||
| 83 | Evergreen | 8,602.0 | 9,140 | -5.9% | |||||
| 84 | Derby | 8,453.0 | 7,846 | 7.7% | |||||
| 85 | Applewood | 8,350.0 | 6,689 | 24.8% | |||||
| 86 | Trinidad | 8,286.0 | 9,236 | -10.3% | |||||
| 87 | Fruitvale | 8,019.0 | 7,694 | 4.2% | |||||
| 88 | Woodland Park | 7,949.0 | 7,117 | 11.7% | |||||
| 89 | Lamar | 7,611.0 | 7,901 | -3.7% | |||||
| 90 | Eagle | 7,442.0 | 5,958 | 24.9% | |||||
| 91 | La Junta | 7,140.0 | 7,063 | 1.1% | |||||
| 92 | Orchard Mesa | 6,945.0 | 7,230 | -3.9% | |||||
| 93 | Gunnison | 6,766.0 | 5,783 | 17.0% | |||||
| 94 | Aspen | 6,756.0 | 6,403 | 5.5% | |||||
| 95 | Air Force Academy | 6,727.0 | 8,257 | -18.5% | |||||
| 96 | Carbondale | 6,637.0 | 6,284 | 5.6% | |||||
| 97 | Dacono | 6,530.0 | 4,031 | 62.0% | |||||
| 98 | Gleneagle | 6,440.0 | 6,649 | -3.1% | |||||
| 99 | Cherry Hills Village | 6,354.0 | 5,936 | 7.0% | |||||
| 100 | Sheridan | 6,005.0 | 5,621 | 6.8% | |||||
| 101 | Avon | 5,972.0 | 6,345 | -5.9% | |||||
| 102 | Mead | 5,919.0 | 3,241 | 82.6% | |||||
| 103 | Eaton | 5,867.0 | 4,135 | 41.9% | |||||
| 104 | Salida | 5,861.0 | 5,287 | 10.9% | |||||
| 105 | Estes Park | 5,844.0 | 5,820 | 0.4% | |||||
| 106 | Battlement Mesa | 5,755.0 | 4,967 | 15.9% | |||||
| 107 | Meridian | 5,634.0 | 2,237 | 151.9% | |||||
| 108 | Shaw Heights | 5,565.0 | 4,634 | 20.1% | |||||
| 109 | Stratmoor | 5,412.0 | 7,164 | -24.5% | |||||
| 110 | Todd Creek | 5,379.0 | 3,757 | 43.2% | |||||
| 111 | Brush | 5,306.0 | 5,428 | -2.2% | |||||
| 112 | West Pleasant View | 5,051.0 | 3,631 | 39.1% | |||||
| 113 | Breckenridge | 4,959.0 | 4,224 | 17.4% | |||||
| 114 | Edgewater | 4,932.0 | 5,170 | -4.6% | |||||
| 115 | New Castle | 4,880.0 | 4,124 | 18.3% | |||||
| 116 | Silverthorne | 4,815.0 | 3,750 | 28.4% | |||||
| 117 | Dove Valley | 4,806.0 | 6,008 | -20.0% | |||||
| 118 | Manitou Springs | 4,735.0 | 4,961 | -4.6% | |||||
| 119 | Vail | 4,613.0 | 5,241 | -12.0% | |||||
| 120 | Glendale | 4,531.0 | 4,165 | 8.8% | |||||
| 121 | Castle Pines Village | 4,436.0 | 0 | nan% | |||||
| 122 | Basalt | 4,335.0 | 3,674 | 18.0% | |||||
| 123 | Monte Vista | 4,141.0 | 4,440 | -6.7% | |||||
| 124 | Penrose | 4,087.0 | 3,597 | 13.6% | |||||
| 125 | Lincoln Park | 3,986.0 | 4,204 | -5.2% | |||||
| 126 | Florence | 3,885.0 | 3,878 | 0.2% | |||||
| 127 | Rocky Ford | 3,815.0 | 3,960 | -3.7% | |||||
| 128 | Genesee | 3,778.0 | 3,624 | 4.2% | |||||
| 129 | Bennett | 3,663.0 | 2,186 | 67.6% | |||||
| 130 | Silt | 3,642.0 | 2,737 | 33.1% | |||||
| 131 | Yuma | 3,459.0 | 3,442 | 0.5% | |||||
| 132 | Strasburg | 3,455.0 | 2,089 | 65.4% | |||||
| 133 | Ponderosa Park | 3,453.0 | 3,028 | 14.0% | |||||
| 134 | Niwot | 3,447.0 | 3,897 | -11.5% | |||||
| 135 | Orchard City | 3,221.0 | 3,093 | 4.1% | |||||
| 136 | Burlington | 3,152.0 | 4,155 | -24.1% | |||||
| 137 | Walsenburg | 3,072.0 | 3,283 | -6.4% | |||||
| 138 | La Salle | 3,061.0 | 2,289 | 33.7% | |||||
| 139 | Buena Vista | 3,010.0 | 2,545 | 18.3% | |||||
| 140 | Snowmass Village | 2,972.0 | 2,590 | 14.7% | |||||
| 141 | El Jebel | 2,941.0 | 4,758 | -38.2% | |||||
| 142 | Inverness | 2,934.0 | 453 | 547.7% | |||||
| 143 | Platteville | 2,928.0 | 2,526 | 15.9% | |||||
| 144 | Bayfield | 2,901.0 | 2,090 | 38.8% | |||||
| 145 | Frisco | 2,825.0 | 2,658 | 6.3% | |||||
| 146 | Acres Green | 2,639.0 | 3,117 | -15.3% | |||||
| 147 | Palmer Lake | 2,623.0 | 1,895 | 38.4% | |||||
| 148 | Leadville | 2,620.0 | 2,633 | -0.5% | |||||
| 149 | Palisade | 2,584.0 | 2,681 | -3.6% | |||||
| 150 | Meeker | 2,580.0 | 2,385 | 8.2% | |||||
| 151 | Holly Hills | 2,572.0 | 2,439 | 5.5% | |||||
| 152 | Las Animas | 2,540.0 | 3,171 | -19.9% | |||||
| 153 | Rangely | 2,466.0 | 2,182 | 13.0% | |||||
| 154 | Ault | 2,425.0 | 1,432 | 69.3% | |||||
| 155 | Cedaredge | 2,398.0 | 2,454 | -2.3% | |||||
| 156 | Holyoke | 2,382.0 | 2,317 | 2.8% | |||||
| 157 | Keenesburg | 2,347.0 | 1,142 | 105.5% | |||||
| 158 | Coal Creek | 2,346.0 | 2,420 | -3.1% | |||||
| 159 | Granby | 2,270.0 | 2,063 | 10.0% | |||||
| 160 | Elizabeth | 2,244.0 | 1,421 | 57.9% | |||||
| 161 | Mountain Village | 2,185.0 | 1,101 | 98.5% | |||||
| 162 | Telluride | 2,160.0 | 2,589 | -16.6% | |||||
| 163 | Center | 2,120.0 | 2,167 | -2.2% | |||||
| 164 | Wray | 2,114.0 | 1,975 | 7.0% | |||||
| 165 | Pagosa Springs | 2,090.0 | 1,774 | 17.8% | |||||
| 166 | Hayden | 2,057.0 | 2,009 | 2.4% | |||||
| 167 | Columbine Valley | 2,047.0 | 1,275 | 60.5% | |||||
| 168 | Hudson | 2,006.0 | 1,594 | 25.8% | |||||
| 169 | Idaho Springs | 1,986.0 | 2,018 | -1.6% | |||||
| 170 | Lyons | 1,838.0 | 1,565 | 17.4% | |||||
| 171 | Kremmling | 1,807.0 | 1,787 | 1.1% | |||||
| 172 | Olathe | 1,793.0 | 1,488 | 20.5% | |||||
| 173 | Laporte | 1,771.0 | 2,426 | -27.0% | |||||
| 174 | Aristocrat Ranchettes | 1,747.0 | 1,622 | 7.7% | |||||
| 175 | Byers | 1,726.0 | 1,318 | 31.0% | |||||
| 176 | Akron | 1,722.0 | 1,691 | 1.8% | |||||
| 177 | Limon | 1,678.0 | 1,761 | -4.7% | |||||
| 178 | Paonia | 1,661.0 | 1,458 | 13.9% | |||||
| 179 | Nederland | 1,655.0 | 1,334 | 24.1% | |||||
| 180 | Del Norte | 1,653.0 | 1,663 | -0.6% | |||||
| 181 | Colorado City | 1,615.0 | 1,384 | 16.7% | |||||
| 182 | Perry Park | 1,570.0 | 1,581 | -0.7% | |||||
| 183 | Wiggins | 1,564.0 | 954 | 63.9% | |||||
| 184 | Ordway | 1,528.0 | 1,145 | 33.4% | |||||
| 185 | Parachute | 1,422.0 | 1,019 | 39.5% | |||||
| 186 | Leadville North | 1,417.0 | 1,732 | -18.2% | |||||
| 187 | Cascade-Chipita Park | 1,412.0 | 1,524 | -7.3% | |||||
| 188 | Blue River | 1,410.0 | 643 | 119.3% | |||||
| 189 | Fraser | 1,405.0 | 1,384 | 1.5% | |||||
| 190 | Ellicott | 1,404.0 | 918 | 52.9% | |||||
| 191 | Springfield | 1,384.0 | 1,389 | -0.4% | |||||
| 192 | Loma | 1,350.0 | 1,255 | 7.6% | |||||
| 193 | Dotsero | 1,306.0 | 507 | 157.6% | |||||
| 194 | Alamosa East | 1,298.0 | 2,031 | -36.1% | |||||
| 195 | Deer Trail | 1,275.0 | 365 | 249.3% | |||||
| 196 | Ignacio | 1,250.0 | 873 | 43.2% | |||||
| 197 | Ridgway | 1,237.0 | 929 | 33.2% | |||||
| 198 | Crested Butte | 1,229.0 | 1,432 | -14.2% | |||||
| 199 | Hotchkiss | 1,224.0 | 808 | 51.5% | |||||
| 200 | Keystone | 1,216.0 | 765 | 59.0% | |||||
| 201 | Pierce | 1,201.0 | 709 | 69.4% | |||||
| 202 | Julesburg | 1,181.0 | 1,382 | -14.5% | |||||
| 203 | Mancos | 1,174.0 | 1,056 | 11.2% | |||||
| 204 | Sanford | 1,142.0 | 880 | 29.8% | |||||
| 205 | Hot Sulphur Springs | 1,108.0 | 942 | 17.6% | |||||
| 206 | Towaoc | 1,078.0 | 932 | 15.7% | |||||
| 207 | Fairplay | 1,067.0 | 634 | 68.3% | |||||
| 208 | Kersey | 1,064.0 | 1,454 | -26.8% | |||||
| 209 | Georg | 1,053.0 | 1,294 | -18.6% | |||||
| 210 | Bow Mar | 1,047.0 | 962 | 8.8% | |||||
| 211 | Gilcrest | 1,026.0 | 1,078 | -4.8% | |||||
| 212 | Aetna Estates | 1,010.0 | 564 | 79.1% | |||||