100 Biggest Cities In Tennessee For 2026
Using the latest Census data, we detail the 100 biggest cities in Tennessee. You can all see a comprehensive list of all 286 cities and places in Tennessee.

We all love the biggest cities that the Volunteer State has to offer. You know the places like Memphis and Knoxville which make all the headlines.
But there are a bunch of other great large cities in Tennessee that don't get as much love.
We're going to change that right now.
Using the most recent Census data, we can tell you about all the places in Tennessee with a focus on the biggest. We update the data each year and this is our fourth time doing this.
Table Of Contents: Top Ten | Methodology | Table
The Largest Cities In Tennessee For 2026:
You can click here to see a full table of the full of the 100 biggest cities in Tennessee, along with every other place over 1,000 people big. It is sortable by clicking on the headers.
Read on below to see more on the biggest cities. Or for more reading on places to live in Tennessee, check out:
- Best Places To Live In Tennessee
- Cheapest Places To Live In Tennessee
- Most Dangerous Cities In Tennessee
The 10 Biggest Cities In Tennessee


/10
Rank Last Year: 1 (No Change)
Population: 618,980.0
Population 2010: 654,876
Growth: -5.5%
More on Memphis: Data | Crime | Cost Of Living | Real Estate

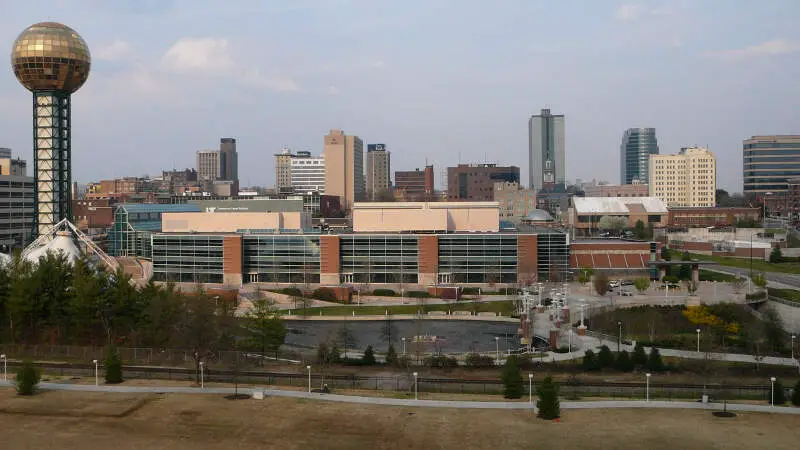
/10
Rank Last Year: 2 (No Change)
Population: 195,185.0
Population 2010: 178,202
Growth: 9.5%
More on Knoxville: Data | Crime | Cost Of Living | Real Estate

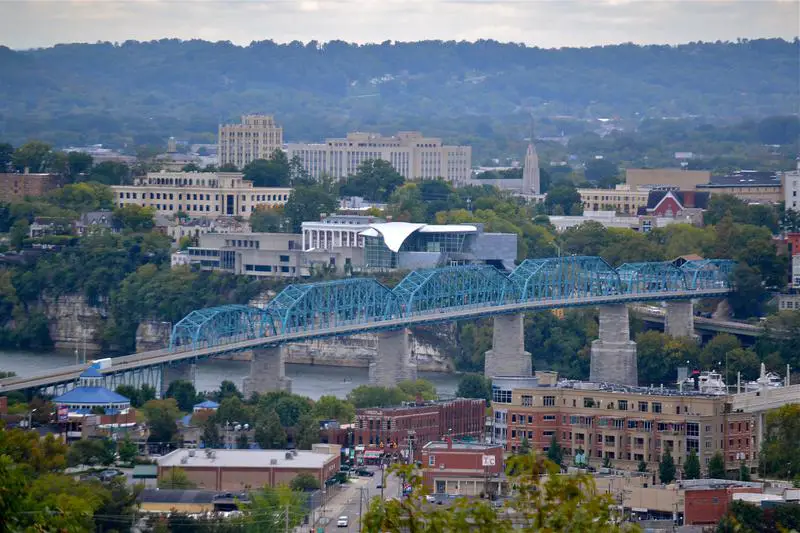
/10
Rank Last Year: 3 (No Change)
Population: 185,783.0
Population 2010: 164,481
Growth: 13.0%
More on Chattanooga: Data | Crime | Cost Of Living | Real Estate

/10
Rank Last Year: 4 (No Change)
Population: 176,456.0
Population 2010: 126,148
Growth: 39.9%
More on Clarksville: Data | Crime | Cost Of Living | Real Estate


/10
Rank Last Year: 5 (No Change)
Population: 161,445.0
Population 2010: 102,602
Growth: 57.4%
More on Murfreesboro: Data | Crime | Cost Of Living | Real Estate

/10
Rank Last Year: 6 (No Change)
Population: 87,133.0
Population 2010: 59,905
Growth: 45.5%
More on Franklin: Data | Crime | Cost Of Living | Real Estate
/10
Rank Last Year: 7 (No Change)
Population: 72,222.0
Population 2010: 61,758
Growth: 16.9%
More on Johnson City: Data | Crime | Cost Of Living | Real Estate

/10
Rank Last Year: 8 (No Change)
Population: 68,435.0
Population 2010: 64,418
Growth: 6.2%
More on Jackson: Data | Crime | Cost Of Living | Real Estate


/10
Rank Last Year: 9 (No Change)
Population: 63,091.0
Population 2010: 49,725
Growth: 26.9%
More on Hendersonville: Data | Crime | Cost Of Living | Real Estate

/10
Rank Last Year: 10 (No Change)
Population: 56,876.0
Population 2010: 52,754
Growth: 7.8%
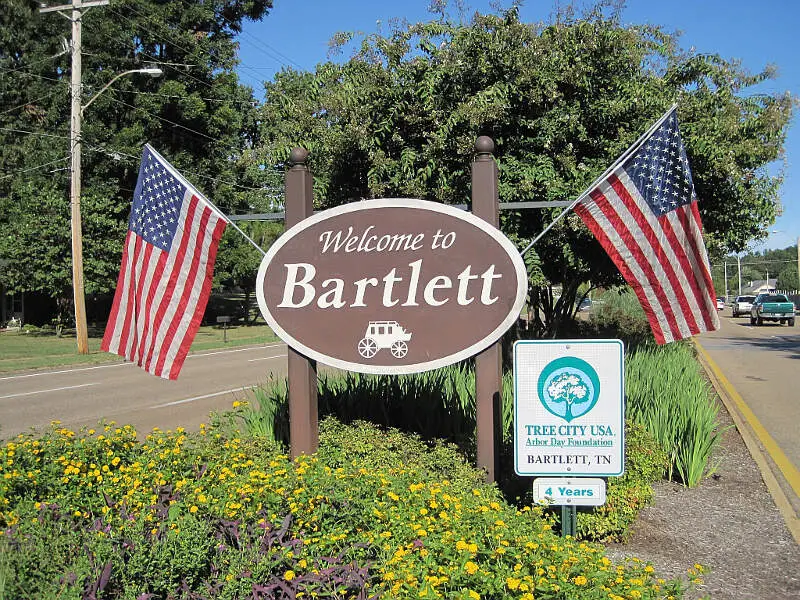
More on Bartlett: Data | Crime | Cost Of Living | Real Estate
How We Determined The Largest Cities In Tennessee
We've been ranking and dissecting cities in the Volunteer State for over 4 years now -- making this actually the fourth time we've run the numbers. We always use the best data, the US Census. In this case, that means we are using the American Community Survey.
It what is probably the most simple analysis we run each year, we ranked every place in Tennessee from biggest to smallest. The biggest city this year? That would be Memphis.
The smallest? Flat Top Mountain, although there are places smaller than 1,000 people not listed here, so keep that in mind as we take a look at the top ten.
Now on to numbers 11-100 Biggest in Tennessee
We hope that you find the big city, or really any city, that's right for you. Below is a list of the rest of the biggest cities along with every other place in Tennessee.
Have fun snacking around in the Volunteer State!
For more reading on Tennessee, check out:
- Best Places To Raise A Family In Tennessee
- Best Places To Retire In Tennessee
- Richest Cities In Tennessee
- Safest Places In Tennessee
- Worst Places To Live In Tennessee
- Most Expensive Places To Live In Tennessee
Detailed List Of The Biggest Cities In Tennessee
| Rank | City | Current Population | 2010 | Growth | |||||
|---|---|---|---|---|---|---|---|---|---|
| 1 | Memphis | 618,980.0 | 654,876 | -5.5% | |||||
| 2 | Knoxville | 195,185.0 | 178,202 | 9.5% | |||||
| 3 | Chattanooga | 185,783.0 | 164,481 | 13.0% | |||||
| 4 | Clarksville | 176,456.0 | 126,148 | 39.9% | |||||
| 5 | Murfreesboro | 161,445.0 | 102,602 | 57.4% | |||||
| 6 | Franklin | 87,133.0 | 59,905 | 45.5% | |||||
| 7 | Johnson City | 72,222.0 | 61,758 | 16.9% | |||||
| 8 | Jackson | 68,435.0 | 64,418 | 6.2% | |||||
| 9 | Hendersonville | 63,091.0 | 49,725 | 26.9% | |||||
| 10 | Bartlett | 56,876.0 | 52,754 | 7.8% | |||||
| 11 | Smyrna | 56,692.0 | 38,102 | 48.8% | |||||
| 12 | Kingsport | 56,262.0 | 47,852 | 17.6% | |||||
| 13 | Spring Hill | 55,765.0 | 25,415 | 119.4% | |||||
| 14 | Collierville | 51,515.0 | 41,983 | 22.7% | |||||
| 15 | Cleveland | 48,829.0 | 40,507 | 20.5% | |||||
| 16 | Gallatin | 48,532.0 | 29,084 | 66.9% | |||||
| 17 | Brentwood | 45,556.0 | 35,331 | 28.9% | |||||
| 18 | Columbia | 45,441.0 | 34,482 | 31.8% | |||||
| 19 | Lebanon | 44,788.0 | 25,188 | 77.8% | |||||
| 20 | Mount Juliet | 42,073.0 | 21,922 | 91.9% | |||||
| 21 | Germantown | 40,673.0 | 38,655 | 5.2% | |||||
| 22 | La Vergne | 40,243.0 | 30,367 | 32.5% | |||||
| 23 | Cookeville | 36,088.0 | 29,722 | 21.4% | |||||
| 24 | Oak Ridge | 32,693.0 | 28,925 | 13.0% | |||||
| 25 | Maryville | 32,392.0 | 26,925 | 20.3% | |||||
| 26 | Morristown | 31,527.0 | 28,749 | 9.7% | |||||
| 27 | Bristol | 27,636.0 | 26,427 | 4.6% | |||||
| 28 | Shelbyville | 24,661.0 | 19,769 | 24.7% | |||||
| 29 | Farragut | 24,634.0 | 20,154 | 22.2% | |||||
| 30 | East Ridge | 22,070.0 | 20,778 | 6.2% | |||||
| 31 | Tullahoma | 21,103.0 | 18,561 | 13.7% | |||||
| 32 | Springfield | 19,255.0 | 16,097 | 19.6% | |||||
| 33 | Sevierville | 18,397.0 | 14,477 | 27.1% | |||||
| 34 | Goodlettsville | 17,597.0 | 15,448 | 13.9% | |||||
| 35 | Dickson | 16,424.0 | 14,299 | 14.9% | |||||
| 36 | Seymour | 16,216.0 | 10,378 | 56.3% | |||||
| 37 | Dyersburg | 15,979.0 | 17,213 | -7.2% | |||||
| 38 | Greeneville | 15,646.0 | 15,189 | 3.0% | |||||
| 39 | Arlington | 15,205.0 | 9,925 | 53.2% | |||||
| 40 | Nolensville | 15,074.0 | 5,351 | 181.7% | |||||
| 41 | White House | 14,631.0 | 9,764 | 49.8% | |||||
| 42 | Athens | 14,471.0 | 13,491 | 7.3% | |||||
| 43 | Elizabethton | 14,374.0 | 14,306 | 0.5% | |||||
| 44 | Lakeland | 14,192.0 | 11,503 | 23.4% | |||||
| 45 | Mcminnville | 13,844.0 | 13,473 | 2.8% | |||||
| 46 | Portland | 13,449.0 | 10,973 | 22.6% | |||||
| 47 | Soddy-Daisy | 13,231.0 | 12,393 | 6.8% | |||||
| 48 | Manchester | 12,944.0 | 9,899 | 30.8% | |||||
| 49 | Lewisburg | 12,861.0 | 10,953 | 17.4% | |||||
| 50 | Crossville | 12,428.0 | 10,625 | 17.0% | |||||
| 51 | Alcoa | 12,222.0 | 8,473 | 44.2% | |||||
| 52 | Middle Valley | 12,187.0 | 12,853 | -5.2% | |||||
| 53 | Red Bank | 12,010.0 | 11,661 | 3.0% | |||||
| 54 | Hartsville/trousdale County | 11,957.0 | 7,751 | 54.3% | |||||
| 55 | Lawrenceburg | 11,844.0 | 10,423 | 13.6% | |||||
| 56 | Collegedale | 11,330.0 | 7,937 | 42.7% | |||||
| 57 | Millington | 11,289.0 | 10,351 | 9.1% | |||||
| 58 | Lenoir City | 11,110.0 | 8,360 | 32.9% | |||||
| 59 | Union City | 10,982.0 | 10,896 | 0.8% | |||||
| 60 | Martin | 10,915.0 | 11,083 | -1.5% | |||||
| 61 | Atoka | 10,385.0 | 7,629 | 36.1% | |||||
| 62 | Paris | 10,338.0 | 10,083 | 2.5% | |||||
| 63 | Clinton | 10,239.0 | 9,744 | 5.1% | |||||
| 64 | Fairview | 10,009.0 | 7,500 | 33.5% | |||||
| 65 | Oakland | 9,979.0 | 5,815 | 71.6% | |||||
| 66 | Winchester | 9,799.0 | 8,430 | 16.2% | |||||
| 67 | Brownsville | 9,622.0 | 10,392 | -7.4% | |||||
| 68 | Fairfield Glade | 9,487.0 | 6,261 | 51.5% | |||||
| 69 | Bloomingdale | 9,292.0 | 9,742 | -4.6% | |||||
| 70 | Signal Mountain | 8,860.0 | 7,481 | 18.4% | |||||
| 71 | Covington | 8,587.0 | 9,016 | -4.8% | |||||
| 72 | Jefferson City | 8,579.0 | 8,096 | 6.0% | |||||
| 73 | Thompson's Station | 8,294.0 | 1,946 | 326.2% | |||||
| 74 | Pulaski | 8,285.0 | 7,895 | 4.9% | |||||
| 75 | Milan | 8,244.0 | 7,796 | 5.7% | |||||
| 76 | Harrison | 8,011.0 | 7,917 | 1.2% | |||||
| 77 | Lexington | 7,962.0 | 7,641 | 4.2% | |||||
| 78 | Humboldt | 7,787.0 | 8,582 | -9.3% | |||||
| 79 | Ripley | 7,658.0 | 8,372 | -8.5% | |||||
| 80 | Dayton | 7,625.0 | 7,118 | 7.1% | |||||
| 81 | South Cleveland | 7,452.0 | 6,329 | 17.7% | |||||
| 82 | Tellico Village | 7,414.0 | 5,431 | 36.5% | |||||
| 83 | Savannah | 7,412.0 | 7,011 | 5.7% | |||||
| 84 | La Follette | 7,273.0 | 7,585 | -4.1% | |||||
| 85 | Church Hill | 7,139.0 | 6,630 | 7.7% | |||||
| 86 | Fayetteville | 7,057.0 | 6,842 | 3.1% | |||||
| 87 | Greenbrier | 6,971.0 | 6,195 | 12.5% | |||||
| 88 | Newport | 6,881.0 | 7,023 | -2.0% | |||||
| 89 | Green Hill | 6,866.0 | 6,836 | 0.4% | |||||
| 90 | Munford | 6,588.0 | 5,779 | 14.0% | |||||
| 91 | Sweetwater | 6,532.0 | 5,807 | 12.5% | |||||
| 92 | Henderson | 6,411.0 | 6,141 | 4.4% | |||||
| 93 | Pigeon Forge | 6,375.0 | 5,831 | 9.3% | |||||
| 94 | Jonesborough | 6,232.0 | 4,875 | 27.8% | |||||
| 95 | Kingston | 6,224.0 | 5,864 | 6.1% | |||||
| 96 | Harriman | 6,090.0 | 6,503 | -6.4% | |||||
| 97 | Erwin | 5,988.0 | 6,090 | -1.7% | |||||
| 98 | Millersville | 5,836.0 | 6,111 | -4.5% | |||||
| 99 | Lafayette | 5,727.0 | 4,383 | 30.7% | |||||
| 100 | Dunlap | 5,678.0 | 4,843 | 17.2% | |||||
| 101 | Mckenzie | 5,631.0 | 5,254 | 7.2% | |||||
| 102 | Eagleton Village | 5,598.0 | 4,593 | 21.9% | |||||
| 103 | Rockwood | 5,566.0 | 5,592 | -0.5% | |||||
| 104 | Mount Carmel | 5,472.0 | 5,349 | 2.3% | |||||
| 105 | Ashland City | 5,424.0 | 4,405 | 23.1% | |||||
| 106 | Medina | 5,407.0 | 3,010 | 79.6% | |||||
| 107 | Smithville | 5,288.0 | 4,466 | 18.4% | |||||
| 108 | Pleasant View | 5,276.0 | 3,962 | 33.2% | |||||
| 109 | Madisonville | 5,241.0 | 4,503 | 16.4% | |||||
| 110 | Bolivar | 5,144.0 | 5,551 | -7.3% | |||||
| 111 | Sparta | 4,939.0 | 4,891 | 1.0% | |||||
| 112 | Mount Pleasant | 4,837.0 | 4,555 | 6.2% | |||||
| 113 | Forest Hills | 4,683.0 | 4,769 | -1.8% | |||||
| 114 | Rogersville | 4,647.0 | 4,419 | 5.2% | |||||
| 115 | Coope | 4,640.0 | 4,060 | 14.3% | |||||
| 116 | Oak Hill | 4,617.0 | 4,498 | 2.6% | |||||
| 117 | Whiteville | 4,530.0 | 4,704 | -3.7% | |||||
| 118 | Selmer | 4,488.0 | 4,402 | 2.0% | |||||
| 119 | Huntingdon | 4,441.0 | 4,046 | 9.8% | |||||
| 120 | Lake Tansi | 4,437.0 | 3,435 | 29.2% | |||||
| 121 | Shackle Island | 4,404.0 | 2,736 | 61.0% | |||||
| 122 | Louisville | 4,383.0 | 2,537 | 72.8% | |||||
| 123 | Harrogate | 4,368.0 | 4,333 | 0.8% | |||||
| 124 | Waverly | 4,302.0 | 4,080 | 5.4% | |||||
| 125 | Apison | 4,271.0 | 2,598 | 64.4% | |||||
| 126 | Trenton | 4,151.0 | 4,319 | -3.9% | |||||
| 127 | White Bluff | 4,080.0 | 3,077 | 32.6% | |||||
| 128 | Spurgeon | 4,071.0 | 3,383 | 20.3% | |||||
| 129 | Algood | 4,036.0 | 3,391 | 19.0% | |||||
| 130 | Livingston | 3,999.0 | 4,066 | -1.6% | |||||
| 131 | Hohenwald | 3,884.0 | 3,734 | 4.0% | |||||
| 132 | Oneida | 3,819.0 | 3,815 | 0.1% | |||||
| 133 | Unicoi | 3,806.0 | 3,638 | 4.6% | |||||
| 134 | Camden | 3,678.0 | 3,608 | 1.9% | |||||
| 135 | Gatlinburg | 3,663.0 | 3,885 | -5.7% | |||||
| 136 | Etowah | 3,658.0 | 3,540 | 3.3% | |||||
| 137 | Jasper | 3,612.0 | 3,268 | 10.5% | |||||
| 138 | Tiptonville | 3,572.0 | 4,451 | -19.7% | |||||
| 139 | Dandridge | 3,538.0 | 2,693 | 31.4% | |||||
| 140 | Centerville | 3,535.0 | 3,711 | -4.7% | |||||
| 141 | Wildwood Lake | 3,495.0 | 3,360 | 4.0% | |||||
| 142 | Somerville | 3,466.0 | 3,075 | 12.7% | |||||
| 143 | Tusculum | 3,337.0 | 2,587 | 29.0% | |||||
| 144 | Blountville | 3,309.0 | 3,342 | -1.0% | |||||
| 145 | Newbern | 3,289.0 | 3,257 | 1.0% | |||||
| 146 | Oliver Springs | 3,281.0 | 2,831 | 15.9% | |||||
| 147 | Mascot | 3,277.0 | 2,145 | 52.8% | |||||
| 148 | Colonial Heights | 3,258.0 | 7,274 | -55.2% | |||||
| 149 | Blaine | 3,213.0 | 2,199 | 46.1% | |||||
| 150 | Bean Station | 3,016.0 | 2,949 | 2.3% | |||||
| 151 | South Pittsburg | 3,013.0 | 3,047 | -1.1% | |||||
| 152 | Decherd | 2,976.0 | 2,300 | 29.4% | |||||
| 153 | Sale Creek | 2,955.0 | 2,530 | 16.8% | |||||
| 154 | Dresden | 2,943.0 | 2,984 | -1.4% | |||||
| 155 | Sewanee | 2,936.0 | 2,242 | 31.0% | |||||
| 156 | Tazewell | 2,902.0 | 2,310 | 25.6% | |||||
| 157 | Brighton | 2,889.0 | 2,579 | 12.0% | |||||
| 158 | Westmoreland | 2,845.0 | 2,555 | 11.4% | |||||
| 159 | Park City | 2,813.0 | 2,292 | 22.7% | |||||
| 160 | New Tazewell | 2,799.0 | 3,006 | -6.9% | |||||
| 161 | Kingston Springs | 2,791.0 | 2,787 | 0.1% | |||||
| 162 | Woodbury | 2,774.0 | 2,647 | 4.8% | |||||
| 163 | Monterey | 2,768.0 | 2,854 | -3.0% | |||||
| 164 | Coalfield | 2,754.0 | 1,919 | 43.5% | |||||
| 165 | Belle Meade | 2,708.0 | 2,891 | -6.3% | |||||
| 166 | Estill Springs | 2,695.0 | 1,991 | 35.4% | |||||
| 167 | Parsons | 2,686.0 | 2,739 | -1.9% | |||||
| 168 | Clifton | 2,660.0 | 2,730 | -2.6% | |||||
| 169 | Jacksboro | 2,650.0 | 1,838 | 44.2% | |||||
| 170 | Hopewell | 2,634.0 | 1,932 | 36.3% | |||||
| 171 | Piperton | 2,569.0 | 1,449 | 77.3% | |||||
| 172 | White Pine | 2,565.0 | 2,122 | 20.9% | |||||
| 173 | Mountain City | 2,542.0 | 2,536 | 0.2% | |||||
| 174 | Maynardville | 2,528.0 | 2,250 | 12.4% | |||||
| 175 | Mosheim | 2,511.0 | 3,049 | -17.6% | |||||
| 176 | Plainview | 2,458.0 | 2,275 | 8.0% | |||||
| 177 | Walnut Hill | 2,415.0 | 2,836 | -14.8% | |||||
| 178 | South Fulton | 2,379.0 | 1,893 | 25.7% | |||||
| 179 | Bells | 2,373.0 | 2,253 | 5.3% | |||||
| 180 | South Carthage | 2,364.0 | 1,546 | 52.9% | |||||
| 181 | Spring City | 2,358.0 | 1,868 | 26.2% | |||||
| 182 | Carthage | 2,327.0 | 2,238 | 4.0% | |||||
| 183 | Pikeville | 2,319.0 | 1,335 | 73.7% | |||||
| 184 | Falling Water | 2,315.0 | 1,106 | 109.3% | |||||
| 185 | Alamo | 2,311.0 | 2,391 | -3.3% | |||||
| 186 | Waynesboro | 2,296.0 | 2,542 | -9.7% | |||||
| 187 | Adamsville | 2,278.0 | 2,036 | 11.9% | |||||
| 188 | Greenfield | 2,264.0 | 2,407 | -5.9% | |||||
| 189 | Gray | 2,237.0 | 1,279 | 74.9% | |||||
| 190 | Jamestown | 2,230.0 | 1,764 | 26.4% | |||||
| 191 | Bluff City | 2,225.0 | 1,453 | 53.1% | |||||
| 192 | Dyer | 2,217.0 | 2,570 | -13.7% | |||||
| 193 | Vonore | 2,191.0 | 1,421 | 54.2% | |||||
| 194 | Lakesite | 2,168.0 | 1,869 | 16.0% | |||||
| 195 | Charlotte | 2,164.0 | 1,104 | 96.0% | |||||
| 196 | New Union | 2,160.0 | 1,268 | 70.3% | |||||
| 197 | Lookout Mountain | 2,111.0 | 1,894 | 11.5% | |||||
| 198 | Fairmount | 2,110.0 | 2,604 | -19.0% | |||||
| 199 | Pegram | 2,089.0 | 2,300 | -9.2% | |||||
| 200 | Rural Hill | 2,075.0 | 2,065 | 0.5% | |||||
| 201 | Caryville | 2,073.0 | 2,255 | -8.1% | |||||
| 202 | New Johnsonville | 2,060.0 | 1,793 | 14.9% | |||||
| 203 | Whitwell | 2,052.0 | 1,561 | 31.5% | |||||
| 204 | Halls | 2,034.0 | 2,326 | -12.6% | |||||
| 205 | Pine Crest | 2,029.0 | 2,360 | -14.0% | |||||
| 206 | Three Way | 2,008.0 | 1,723 | 16.5% | |||||
| 207 | Ridgetop | 1,995.0 | 1,855 | 7.5% | |||||
| 208 | Berry Hill | 1,980.0 | 467 | 324.0% | |||||
| 209 | Dover | 1,956.0 | 1,659 | 17.9% | |||||
| 210 | Celina | 1,941.0 | 1,647 | 17.9% | |||||
| 211 | Central | 1,938.0 | 1,978 | -2.0% | |||||
| 212 | Cowan | 1,934.0 | 1,449 | 33.5% | |||||
| 213 | East Cleveland | 1,934.0 | 1,970 | -1.8% | |||||
| 214 | Monteagle | 1,926.0 | 1,614 | 19.3% | |||||
| 215 | Cross Plains | 1,922.0 | 1,639 | 17.3% | |||||
| 216 | Hunter | 1,918.0 | 1,475 | 30.0% | |||||
| 217 | Surgoinsville | 1,911.0 | 2,144 | -10.9% | |||||
| 218 | Decatur | 1,898.0 | 1,369 | 38.6% | |||||
| 219 | Burns | 1,884.0 | 1,634 | 15.3% | |||||
| 220 | Jellico | 1,855.0 | 2,545 | -27.1% | |||||
| 221 | Cornersville | 1,847.0 | 964 | 91.6% | |||||
| 222 | Walden | 1,845.0 | 2,028 | -9.0% | |||||
| 223 | Troy | 1,827.0 | 1,634 | 11.8% | |||||
| 224 | Englewood | 1,818.0 | 1,791 | 1.5% | |||||
| 225 | Huntsville | 1,814.0 | 1,109 | 63.6% | |||||
| 226 | Mcewen | 1,806.0 | 1,649 | 9.5% | |||||
| 227 | Ridgely | 1,796.0 | 1,972 | -8.9% | |||||
| 228 | Loretto | 1,731.0 | 1,932 | -10.4% | |||||
| 229 | Tennessee Ridge | 1,726.0 | 1,389 | 24.3% | |||||
| 230 | Mowbray Mountain | 1,721.0 | 1,440 | 19.5% | |||||
| 231 | Chapel Hill | 1,712.0 | 1,248 | 37.2% | |||||
| 232 | Tracy City | 1,682.0 | 1,581 | 6.4% | |||||
| 233 | Rutledge | 1,676.0 | 1,541 | 8.8% | |||||
| 234 | Kimball | 1,639.0 | 1,363 | 20.2% | |||||
| 235 | New Market | 1,619.0 | 1,206 | 34.2% | |||||
| 236 | Bon Aqua Junction | 1,586.0 | 943 | 68.2% | |||||
| 237 | Benton | 1,560.0 | 1,723 | -9.5% | |||||
| 238 | Huntland | 1,532.0 | 890 | 72.1% | |||||
| 239 | Kenton | 1,513.0 | 1,253 | 20.8% | |||||
| 240 | Powells Crossroads | 1,498.0 | 1,204 | 24.4% | |||||
| 241 | Norris | 1,485.0 | 1,419 | 4.7% | |||||
| 242 | Gruetli-Laager | 1,480.0 | 1,827 | -19.0% | |||||
| 243 | Watertown | 1,463.0 | 1,616 | -9.5% | |||||
| 244 | Bruceton | 1,431.0 | 1,675 | -14.6% | |||||
| 245 | Dodson Branch | 1,425.0 | 904 | 57.6% | |||||
| 246 | Lone Oak | 1,422.0 | 1,618 | -12.1% | |||||
| 247 | Bradford | 1,385.0 | 1,040 | 33.2% | |||||
| 248 | Lyles | 1,385.0 | 870 | 59.2% | |||||
| 249 | Greenback | 1,378.0 | 986 | 39.8% | |||||
| 250 | Olivet | 1,377.0 | 1,210 | 13.8% | |||||
| 251 | Fincastle | 1,374.0 | 1,521 | -9.7% | |||||
| 252 | Midtown | 1,369.0 | 1,614 | -15.2% | |||||
| 253 | Sneedville | 1,364.0 | 1,739 | -21.6% | |||||
| 254 | Baxter | 1,361.0 | 1,455 | -6.5% | |||||
| 255 | Altamont | 1,322.0 | 1,160 | 14.0% | |||||
| 256 | Graysville | 1,304.0 | 1,099 | 18.7% | |||||
| 257 | Gordonsville | 1,299.0 | 1,332 | -2.5% | |||||
| 258 | Unionville | 1,275.0 | 1,016 | 25.5% | |||||
| 259 | Red Boiling Springs | 1,262.0 | 1,185 | 6.5% | |||||
| 260 | Crump | 1,231.0 | 1,696 | -27.4% | |||||
| 261 | Orlinda | 1,214.0 | 789 | 53.9% | |||||
| 262 | Banner Hill | 1,211.0 | 1,774 | -31.7% | |||||
| 263 | Wartburg | 1,191.0 | 891 | 33.7% | |||||
| 264 | Grimsley | 1,171.0 | 1,076 | 8.8% | |||||
| 265 | Fall Branch | 1,160.0 | 1,368 | -15.2% | |||||
| 266 | Gleason | 1,159.0 | 1,634 | -29.1% | |||||
| 267 | Luttrell | 1,158.0 | 1,022 | 13.3% | |||||
| 268 | Winfield | 1,153.0 | 1,059 | 8.9% | |||||
| 269 | Tellico Plains | 1,146.0 | 865 | 32.5% | |||||
| 270 | Rossville | 1,142.0 | 661 | 72.8% | |||||
| 271 | Byrd | 1,141.0 | 1,017 | 12.2% | |||||
| 272 | Lakewood Park | 1,140.0 | 655 | 74.0% | |||||
| 273 | Alexandria | 1,136.0 | 961 | 18.2% | |||||
| 274 | Linden | 1,122.0 | 1,011 | 11.0% | |||||
| 275 | Rutherford | 1,119.0 | 1,159 | -3.5% | |||||
| 276 | Atwood | 1,108.0 | 886 | 25.1% | |||||
| 277 | Obion | 1,087.0 | 1,464 | -25.8% | |||||
| 278 | Scotts Hill | 1,083.0 | 969 | 11.8% | |||||
| 279 | Allardt | 1,076.0 | 606 | 77.6% | |||||
| 280 | Ardmore | 1,073.0 | 1,243 | -13.7% | |||||
| 281 | Gainesboro | 1,064.0 | 973 | 9.4% | |||||
| 282 | Erin | 1,058.0 | 1,538 | -31.2% | |||||
| 283 | Mason | 1,039.0 | 1,581 | -34.3% | |||||
| 284 | Sharon | 1,036.0 | 1,039 | -0.3% | |||||
| 285 | Lobelville | 1,007.0 | 1,038 | -3.0% | |||||
| 286 | Flat Top Mountain | 1,004.0 | 367 | 173.6% | |||||