Carmel SnackAbility
Overall SnackAbility
Crime in Carmel summary. We use data from the FBI to determine the crime rates in Carmel. Key points include:
There were 906 total crimes in Carmel in the last reporting year.
The overall crime rate per 100,000 people in Carmel is 878.7 / 100k people.
The violent crime rate per 100,000 people in Carmel is 66.0 / 100k people.
The property crime rate per 100,000 people in Carmel is 812.7 / 100k people.
Overall, crime in Carmel is -58.54% below the national average.
Total Crimes
Below National Average
Crime In Carmel Comparison Table
| Statistic | Count Raw | Carmel / 100k People | Indiana / 100k People | National / 100k People |
|---|---|---|---|---|
| Total Crimes Per 100K | 906 | 878.7 | 1,691.5 | 2,119.2 |
| Violent Crime | 68 | 66.0 | 312.9 | 359.0 |
| Murder | 0 | 0.0 | 5.5 | 5.0 |
| Robbery | 6 | 5.8 | 34.5 | 61.0 |
| Aggravated Assault | 49 | 47.5 | 239.4 | 256.0 |
| Property Crime | 838 | 812.7 | 1,378.6 | 1,760.0 |
| Burglary | 47 | 45.6 | 176.8 | 229.0 |
| Larceny | 702 | 680.8 | 988.8 | 1,272.0 |
| Car Theft | 89 | 86.3 | 213.0 | 259.0 |
Source: FBI Uniform Crime Reporting (2024)
Cost of living in Carmel summary. We use data on the cost of living to determine how expensive it is to live in Carmel. Real estate prices drive most of the variance in cost of living around Indiana. Key points include:
The cost of living in Carmel is 117 with 100 being average.
The cost of living in Carmel is 1.2x higher than the national average.
The median home value in Carmel is $563,457.
The median income in Carmel is $141,505.
Carmel's Overall Cost Of Living
Higher Than The National Average
Cost Of Living In Carmel Comparison Table
| Living Expense | Carmel | Indiana | National Average |
|---|---|---|---|
| Overall | 117 | 90 | 100 |
| Services | 94 | 97 | 100 |
| Groceries | 100 | 95 | 100 |
| Health | 175 | 72 | 100 |
| Housing | 93 | 98 | 100 |
| Transportation | 93 | 94 | 100 |
| Utilities | 91 | 96 | 100 |
Source: Cost of living index, normalized to US average = 100
Carmel, IN Weather
The average high in Carmel is 61.7° and the average low is 42.5°.
There are 77.9 days of precipitation each year.
Expect an average of 41.9 inches of precipitation each year with 22.7 inches of snow.
| Stat | Carmel |
|---|---|
| Average Annual High | 61.7 |
| Average Annual Low | 42.5 |
| Annual Precipitation Days | 77.9 |
| Average Annual Precipitation | 41.9 |
| Average Annual Snowfall | 22.7 |
Average High
Days of Rain
Source: NOAA climate normals (30-year)
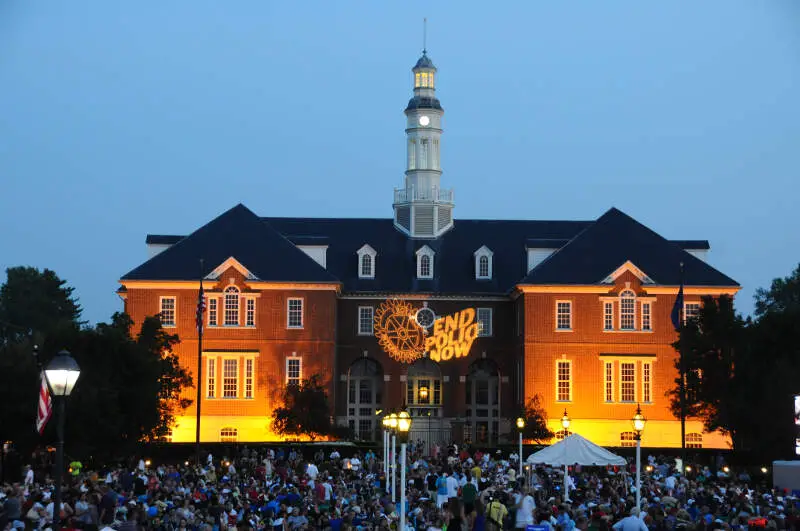
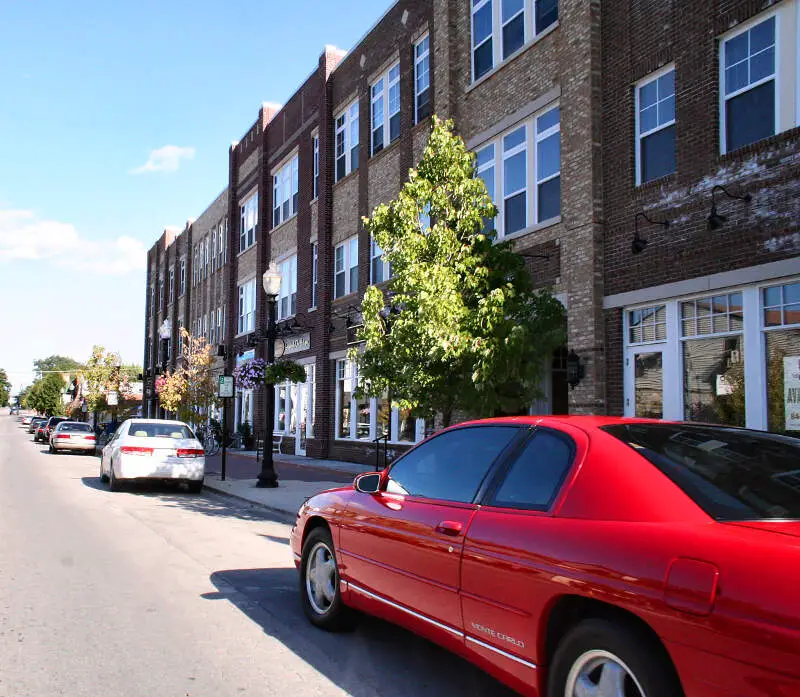
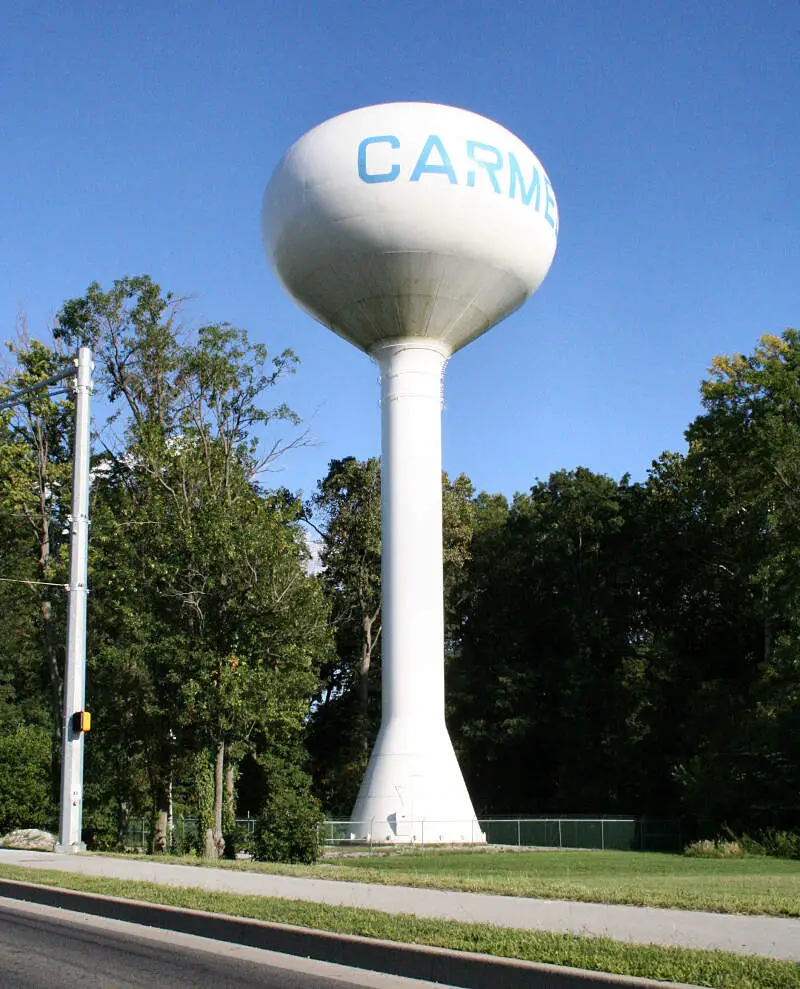
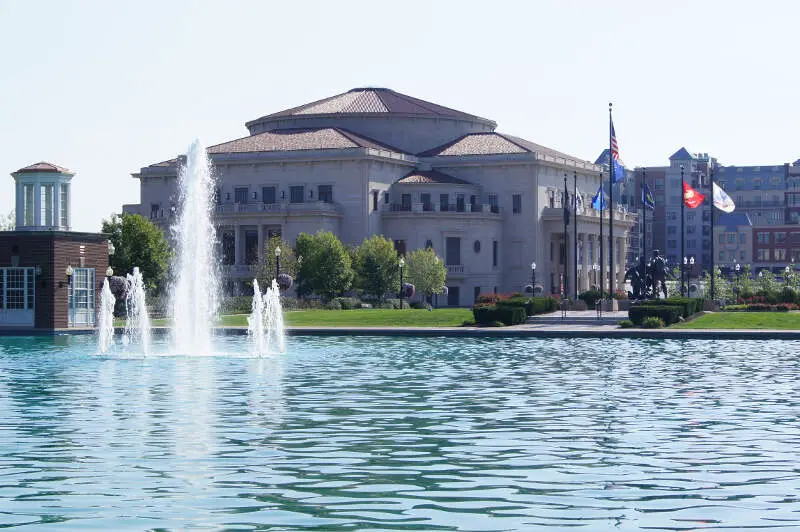
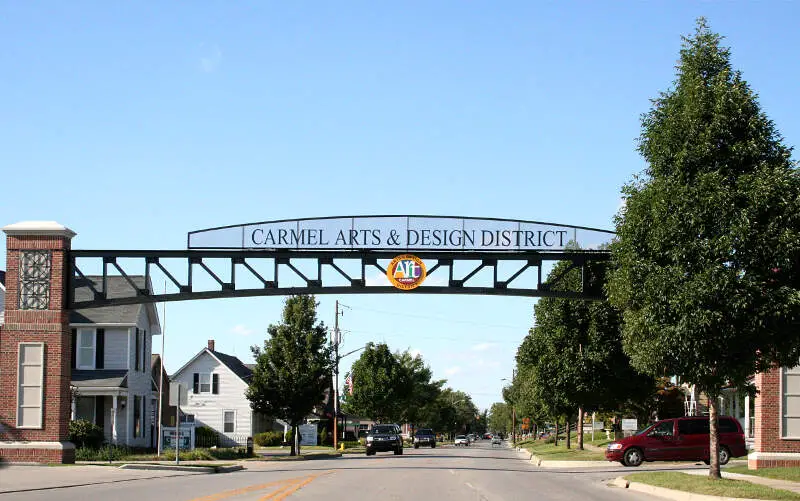
Carmel, IN Photos
1 Reviews & Comments About Carmel

I know someone who moved to Carmel and she thinks she's above everybody else. The only reason she lives there is she rents. She married a much older guy who she thinks has lots of money. When that well runs dry, she'll be off to find number 6.
Rankings & Articles For Carmel


Locations Around Carmel
Map Of Carmel, IN
Best Places Around Carmel
Zionsville, IN
Population 32,095
Brownsburg, IN
Population 31,215
Noblesville, IN
Population 73,362
Westfield, IN
Population 54,677
Lawrence, IN
Population 49,517
Cumberland, IN
Population 6,267
Indianapolis, IN
Population 885,860
Beech Grove, IN
Population 14,913
Avon, IN
Population 23,437
Carmel Demographics And Statistics
Population over time in Carmel
The current population in Carmel is 101,651. The population has increased 32.4% from 2010.
| Year | Population | % Change |
|---|---|---|
| 2024 | 101,651 | 1.1% |
| 2023 | 100,501 | 1.1% |
| 2022 | 99,453 | 1.3% |
| 2021 | 98,137 | -1.0% |
| 2020 | 99,130 | 1.7% |
| 2019 | 97,464 | 8.1% |
| 2018 | 90,163 | 1.8% |
| 2017 | 88,595 | 1.9% |
| 2016 | 86,940 | 1.8% |
| 2015 | 85,367 | 2.3% |
| 2014 | 83,474 | 2.1% |
| 2013 | 81,756 | 2.1% |
| 2012 | 80,060 | 2.2% |
| 2011 | 78,354 | 2.1% |
| 2010 | 76,771 | - |
Race / Ethnicity in Carmel
See the full breakdown
Carmel is:
75.4% White with 76,606 White residents.
3.0% African American with 3,087 African American residents.
0.0% American Indian with 21 American Indian residents.
11.6% Asian with 11,807 Asian residents.
0.0% Hawaiian with 10 Hawaiian residents.
0.7% Other with 691 Other residents.
3.8% Two Or More with 3,857 Two Or More residents.
5.5% Hispanic with 5,572 Hispanic residents.
| Race | Carmel | IN | USA |
|---|---|---|---|
| White | 75.4% | 75.4% | 57.4% |
| African American | 3.0% | 9.1% | 11.9% |
| American Indian | 0.0% | 0.1% | 0.5% |
| Asian | 11.6% | 2.6% | 5.9% |
| Hawaiian | 0.0% | 0.0% | 0.2% |
| Other | 0.7% | 0.4% | 0.6% |
| Two Or More | 3.8% | 3.8% | 4.3% |
| Hispanic | 5.5% | 8.6% | 19.3% |
Gender in Carmel
See the full breakdown
Carmel is 51.1% female with 51,894 female residents.
Carmel is 48.9% male with 49,756 male residents.
| Gender | Carmel | IN | USA |
|---|---|---|---|
| Female | 51.1% | 50.4% | 50.5% |
| Male | 48.9% | 49.6% | 49.5% |
Highest level of educational attainment in Carmel for adults over 25
See the full breakdown
1.0% of adults in Carmel completed < 9th grade.
1.0% of adults in Carmel completed 9-12th grade.
8.0% of adults in Carmel completed high school / ged.
11.0% of adults in Carmel completed some college.
5.0% of adults in Carmel completed associate's degree.
43.0% of adults in Carmel completed bachelor's degree.
20.0% of adults in Carmel completed master's degree.
7.0% of adults in Carmel completed professional degree.
4.0% of adults in Carmel completed doctorate degree.
| Education | Carmel | IN | USA |
|---|---|---|---|
| < 9th Grade | 1.0% | 3.0% | 4.0% |
| 9-12th Grade | 1.0% | 6.0% | 6.0% |
| High School / GED | 8.0% | 33.0% | 26.0% |
| Some College | 11.0% | 19.0% | 19.0% |
| Associate's Degree | 5.0% | 9.0% | 9.0% |
| Bachelor's Degree | 43.0% | 19.0% | 22.0% |
| Master's Degree | 20.0% | 8.0% | 10.0% |
| Professional Degree | 7.0% | 2.0% | 2.0% |
| Doctorate Degree | 4.0% | 1.0% | 2.0% |
Household Income For Carmel, Indiana
See the full breakdown
2.2% of households in Carmel earn Less than $10,000.
0.7% of households in Carmel earn $10,000 to $14,999.
2.0% of households in Carmel earn $15,000 to $24,999.
2.3% of households in Carmel earn $25,000 to $34,999.
6.4% of households in Carmel earn $35,000 to $49,999.
11.4% of households in Carmel earn $50,000 to $74,999.
10.4% of households in Carmel earn $75,000 to $99,999.
17.1% of households in Carmel earn $100,000 to $149,999.
13.1% of households in Carmel earn $150,000 to $199,999.
34.4% of households in Carmel earn $200,000 or more.
| Income | Carmel | IN | USA |
|---|---|---|---|
| Less than $10,000 | 2.2% | 4.9% | 5.0% |
| $10,000 to $14,999 | 0.7% | 3.4% | 3.4% |
| $15,000 to $24,999 | 2.0% | 6.8% | 6.3% |
| $25,000 to $34,999 | 2.3% | 7.5% | 6.6% |
| $35,000 to $49,999 | 6.4% | 11.8% | 10.1% |
| $50,000 to $74,999 | 11.4% | 17.7% | 15.5% |
| $75,000 to $99,999 | 10.4% | 13.9% | 12.6% |
| $100,000 to $149,999 | 17.1% | 17.5% | 17.5% |
| $150,000 to $199,999 | 13.1% | 8.3% | 9.6% |
| $200,000 or more | 34.4% | 8.2% | 13.4% |
Source: U.S. Census ACS 5-year estimates (2024)


