Frederick SnackAbility
Overall SnackAbility
Crime in Frederick summary. We use data from the FBI to determine the crime rates in Frederick. Key points include:
There were 1,839 total crimes in Frederick in the last reporting year.
The overall crime rate per 100,000 people in Frederick is 2,079.7 / 100k people.
The violent crime rate per 100,000 people in Frederick is 406.0 / 100k people.
The property crime rate per 100,000 people in Frederick is 1,673.7 / 100k people.
Overall, crime in Frederick is -1.87% below the national average.
Total Crimes
Below National Average
Crime In Frederick Comparison Table
| Statistic | Count Raw | Frederick / 100k People | Maryland / 100k People | National / 100k People |
|---|---|---|---|---|
| Total Crimes Per 100K | 1,839 | 2,079.7 | 2,470.0 | 2,119.2 |
| Violent Crime | 359 | 406.0 | 420.4 | 359.0 |
| Murder | 2 | 2.3 | 7.2 | 5.0 |
| Robbery | 46 | 52.0 | 123.2 | 61.0 |
| Aggravated Assault | 262 | 296.3 | 257.0 | 256.0 |
| Property Crime | 1,480 | 1,673.7 | 2,049.6 | 1,760.0 |
| Burglary | 216 | 244.3 | 190.0 | 229.0 |
| Larceny | 1,165 | 1,317.5 | 1,446.8 | 1,272.0 |
| Car Theft | 99 | 112.0 | 412.8 | 259.0 |
Source: FBI Uniform Crime Reporting (2024)
Cost of living in Frederick summary. We use data on the cost of living to determine how expensive it is to live in Frederick. Real estate prices drive most of the variance in cost of living around Maryland. Key points include:
The cost of living in Frederick is 118 with 100 being average.
The cost of living in Frederick is 1.2x higher than the national average.
The median home value in Frederick is $466,011.
The median income in Frederick is $97,069.
Frederick's Overall Cost Of Living
Higher Than The National Average
Cost Of Living In Frederick Comparison Table
| Living Expense | Frederick | Maryland | National Average |
|---|---|---|---|
| Overall | 118 | 121 | 100 |
| Services | 103 | 104 | 100 |
| Groceries | 109 | 107 | 100 |
| Health | 148 | 152 | 100 |
| Housing | 106 | 109 | 100 |
| Transportation | 110 | 108 | 100 |
| Utilities | 111 | 109 | 100 |
Source: Cost of living index, normalized to US average = 100
Frederick, MD Weather
The average high in Frederick is 65.5° and the average low is 43.5°.
There are 76.2 days of precipitation each year.
Expect an average of 40.1 inches of precipitation each year with 19.6 inches of snow.
| Stat | Frederick |
|---|---|
| Average Annual High | 65.5 |
| Average Annual Low | 43.5 |
| Annual Precipitation Days | 76.2 |
| Average Annual Precipitation | 40.1 |
| Average Annual Snowfall | 19.6 |
Average High
Days of Rain
Source: NOAA climate normals (30-year)
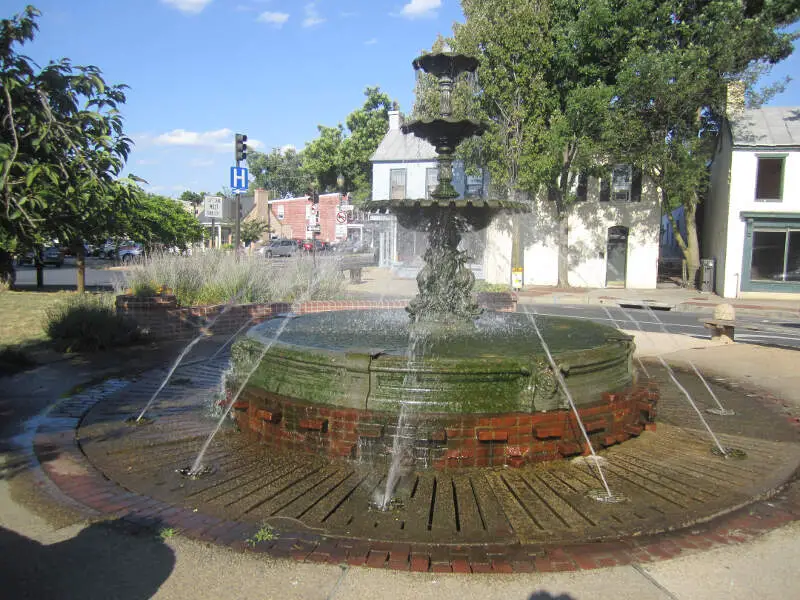
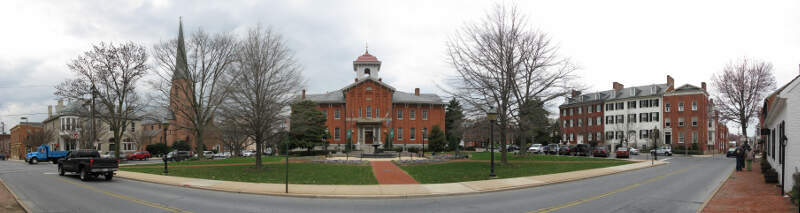
Frederick, MD Photos


1 Reviews & Comments About Frederick

Frederick, Maryland is an absolutely great town. It is geographically located so you can be in the mountains in about 20 minutes, the big cities of DC or Baltimore in 45 minutes, and even the beach in less than two hours. It is located in the mid atlantic so you get to experience all four seasons. The downtown area is fabulous, schools are good, and there are plenty of job opportunities. Frederick is a great place to raise a family!
Downtown Frederick is the crown jewel of this small city. It is a fantastic historic district that is beautiful and safe. There is great night life, a couple of small museums, and a ton of cool shops. Absolutely worth a visit.
Rankings & Articles For Frederick


Locations Around Frederick
Map Of Frederick, MD
Best Places Around Frederick
Lyons, KS
Population 3,553
Ellsworth, KS
Population 3,108
McPherson, KS
Population 13,995
Russell, KS
Population 4,217
Salina, KS
Population 46,307
Great Bend, KS
Population 14,479
Hutchinson, KS
Population 39,709
Lindsborg, KS
Population 3,792
Frederick Demographics And Statistics
Population over time in Frederick
The current population in Frederick is 83,395. The population has increased 30.9% from 2010.
| Year | Population | % Change |
|---|---|---|
| 2024 | 83,395 | 3.4% |
| 2023 | 80,617 | 2.8% |
| 2022 | 78,390 | 2.6% |
| 2021 | 76,376 | 6.3% |
| 2020 | 71,843 | 1.3% |
| 2019 | 70,887 | 1.0% |
| 2018 | 70,166 | 1.2% |
| 2017 | 69,330 | 1.6% |
| 2016 | 68,229 | 1.2% |
| 2015 | 67,421 | 1.2% |
| 2014 | 66,646 | 1.2% |
| 2013 | 65,840 | 1.0% |
| 2012 | 65,171 | 0.9% |
| 2011 | 64,593 | 1.4% |
| 2010 | 63,731 | - |
Race / Ethnicity in Frederick
See the full breakdown
Frederick is:
50.1% White with 41,773 White residents.
17.0% African American with 14,204 African American residents.
0.2% American Indian with 149 American Indian residents.
5.8% Asian with 4,831 Asian residents.
0.0% Hawaiian with 19 Hawaiian residents.
0.4% Other with 322 Other residents.
6.0% Two Or More with 4,988 Two Or More residents.
20.5% Hispanic with 17,109 Hispanic residents.
| Race | Frederick | MD | USA |
|---|---|---|---|
| White | 50.1% | 46.6% | 57.4% |
| African American | 17.0% | 28.9% | 11.9% |
| American Indian | 0.2% | 0.1% | 0.5% |
| Asian | 5.8% | 6.5% | 5.9% |
| Hawaiian | 0.0% | 0.0% | 0.2% |
| Other | 0.4% | 0.7% | 0.6% |
| Two Or More | 6.0% | 4.6% | 4.3% |
| Hispanic | 20.5% | 12.5% | 19.3% |
Gender in Frederick
See the full breakdown
Frederick is 51.6% female with 42,999 female residents.
Frederick is 48.4% male with 40,396 male residents.
| Gender | Frederick | MD | USA |
|---|---|---|---|
| Female | 51.6% | 51.3% | 50.5% |
| Male | 48.4% | 48.7% | 49.5% |
Highest level of educational attainment in Frederick for adults over 25
See the full breakdown
6.0% of adults in Frederick completed < 9th grade.
5.0% of adults in Frederick completed 9-12th grade.
21.0% of adults in Frederick completed high school / ged.
17.0% of adults in Frederick completed some college.
8.0% of adults in Frederick completed associate's degree.
24.0% of adults in Frederick completed bachelor's degree.
14.0% of adults in Frederick completed master's degree.
2.0% of adults in Frederick completed professional degree.
3.0% of adults in Frederick completed doctorate degree.
| Education | Frederick | MD | USA |
|---|---|---|---|
| < 9th Grade | 6.0% | 4.0% | 4.0% |
| 9-12th Grade | 5.0% | 5.0% | 6.0% |
| High School / GED | 21.0% | 23.0% | 26.0% |
| Some College | 17.0% | 17.0% | 19.0% |
| Associate's Degree | 8.0% | 7.0% | 9.0% |
| Bachelor's Degree | 24.0% | 23.0% | 22.0% |
| Master's Degree | 14.0% | 15.0% | 10.0% |
| Professional Degree | 2.0% | 3.0% | 2.0% |
| Doctorate Degree | 3.0% | 3.0% | 2.0% |
Household Income For Frederick, Maryland
See the full breakdown
3.6% of households in Frederick earn Less than $10,000.
2.4% of households in Frederick earn $10,000 to $14,999.
4.2% of households in Frederick earn $15,000 to $24,999.
4.8% of households in Frederick earn $25,000 to $34,999.
7.7% of households in Frederick earn $35,000 to $49,999.
13.8% of households in Frederick earn $50,000 to $74,999.
15.4% of households in Frederick earn $75,000 to $99,999.
19.1% of households in Frederick earn $100,000 to $149,999.
12.1% of households in Frederick earn $150,000 to $199,999.
16.9% of households in Frederick earn $200,000 or more.
| Income | Frederick | MD | USA |
|---|---|---|---|
| Less than $10,000 | 3.6% | 4.4% | 5.0% |
| $10,000 to $14,999 | 2.4% | 2.4% | 3.4% |
| $15,000 to $24,999 | 4.2% | 4.3% | 6.3% |
| $25,000 to $34,999 | 4.8% | 4.9% | 6.6% |
| $35,000 to $49,999 | 7.7% | 7.5% | 10.1% |
| $50,000 to $74,999 | 13.8% | 12.8% | 15.5% |
| $75,000 to $99,999 | 15.4% | 11.9% | 12.6% |
| $100,000 to $149,999 | 19.1% | 18.9% | 17.5% |
| $150,000 to $199,999 | 12.1% | 12.5% | 9.6% |
| $200,000 or more | 16.9% | 20.3% | 13.4% |
Source: U.S. Census ACS 5-year estimates (2024)


