Portland SnackAbility
Overall SnackAbility
Crime in Portland summary. We use data from the FBI to determine the crime rates in Portland. Key points include:
There were 1,903 total crimes in Portland in the last reporting year.
The overall crime rate per 100,000 people in Portland is 2,745.6 / 100k people.
The violent crime rate per 100,000 people in Portland is 266.9 / 100k people.
The property crime rate per 100,000 people in Portland is 2,478.7 / 100k people.
Overall, crime in Portland is 29.56% above the national average.
Total Crimes
Above National Average
Crime In Portland Comparison Table
| Statistic | Count Raw |
Portland / 100k People |
Maine / 100k People |
National / 100k People |
|---|---|---|---|---|
| Total Crimes Per 100K | 1,903 | 2,745.6 | 1,242.2 | 2,119.2 |
| Violent Crime | 185 | 266.9 | 100.1 | 359.0 |
| Murder | 5 | 7.2 | 2.3 | 5.0 |
| Robbery | 35 | 50.5 | 11.0 | 61.0 |
| Aggravated Assault | 116 | 167.4 | 55.0 | 256.0 |
| Property Crime | 1,718 | 2,478.7 | 1,142.1 | 1,760.0 |
| Burglary | 101 | 145.7 | 100.1 | 229.0 |
| Larceny | 1,509 | 2,177.2 | 961.0 | 1,272.0 |
| Car Theft | 108 | 155.8 | 81.1 | 259.0 |
Source: FBI Uniform Crime Reporting (2024)
Cost of living in Portland summary. We use data on the cost of living to determine how expensive it is to live in Portland. Real estate prices drive most of the variance in cost of living around Maine. Key points include:
The cost of living in Portland is 120 with 100 being average.
The cost of living in Portland is 1.2x higher than the national average.
The median home value in Portland is $557,760.
The median income in Portland is $79,540.
Portland's Overall Cost Of Living
Higher Than The National Average
Cost Of Living In Portland Comparison Table
| Living Expense | Portland | Maine | National Average |
|---|---|---|---|
| Overall | 120 | 99 | 100 |
| Services | 105 | 101 | 100 |
| Groceries | 103 | 100 | 100 |
| Health | 156 | 92 | 100 |
| Housing | 103 | 103 | 100 |
| Transportation | 109 | 109 | 100 |
| Utilities | 106 | 105 | 100 |
Source: Cost of living index, normalized to US average = 100
Portland, ME Weather
The average high in Portland is 55.0° and the average low is 38.1°.
There are 79.5 days of precipitation each year.
Expect an average of 47.3 inches of precipitation each year with 66.6 inches of snow.
| Stat | Portland |
|---|---|
| Average Annual High | 55.0 |
| Average Annual Low | 38.1 |
| Annual Precipitation Days | 79.5 |
| Average Annual Precipitation | 47.3 |
| Average Annual Snowfall | 66.6 |
Average High
Days of Rain
Source: NOAA climate normals (30-year)
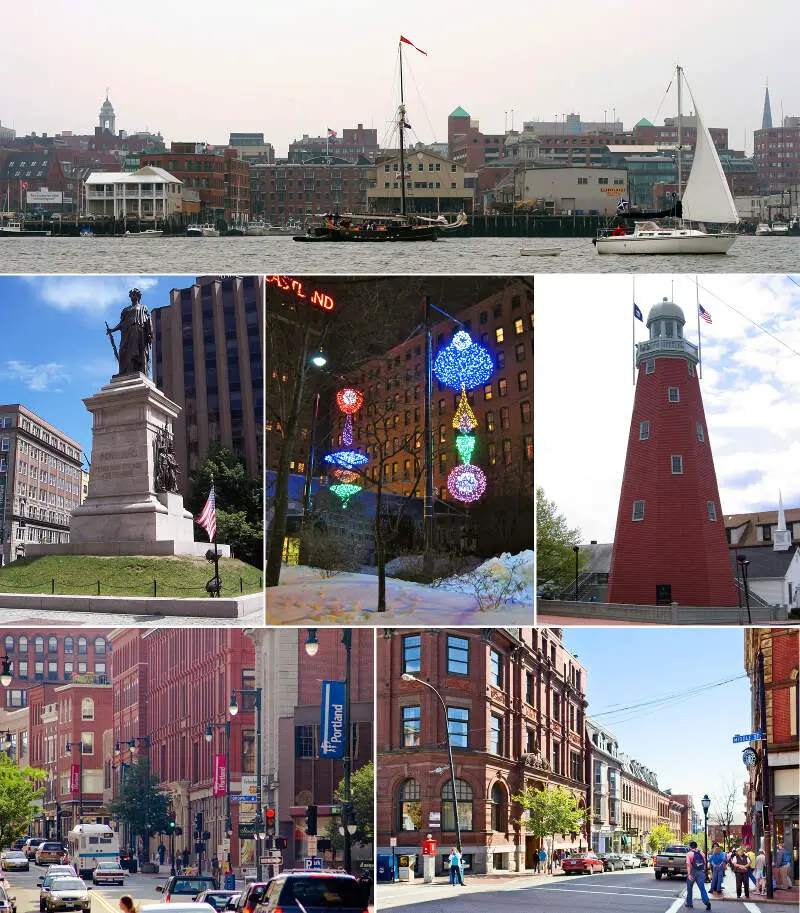
Portland, ME Photos


2 Reviews & Comments About Portland

i live in maine and augusta is not at all the worst. the worst would be south portland or portland
I feel very safe in the town. It has a very small town feel to it. It has excellent restaurants and some of the best Lobster Rolls anywhere in the country. I love the cobblestone streets and the old town look.
The downtown is full of bars and restaurants. Fresh seafood all around the city.
Rankings & Articles For Portland


Locations Around Portland
Map Of Portland, ME
Best Places Around Portland
Yarmouth, ME
Population 6,289
Gorham, ME
Population 7,593
South Portland, ME
Population 26,930
Saco, ME
Population 20,819
Westbrook, ME
Population 20,775
Old Orchard Beach, ME
Population 9,244
Portland Demographics And Statistics
Population over time in Portland
The current population in Portland is 68,854. The population has increased 4.1% from 2010.
| Year | Population | % Change |
|---|---|---|
| 2024 | 68,854 | 0.5% |
| 2023 | 68,505 | 0.3% |
| 2022 | 68,280 | 0.3% |
| 2021 | 68,063 | 2.0% |
| 2020 | 66,706 | 0.2% |
| 2019 | 66,595 | -0.2% |
| 2018 | 66,735 | 0.0% |
| 2017 | 66,715 | 0.1% |
| 2016 | 66,649 | 0.2% |
| 2015 | 66,490 | 0.3% |
| 2014 | 66,317 | 0.1% |
| 2013 | 66,227 | -0.0% |
| 2012 | 66,235 | -0.0% |
| 2011 | 66,240 | 0.2% |
| 2010 | 66,138 | - |
Race / Ethnicity in Portland
See the full breakdown
Portland is:
77.5% White with 53,375 White residents.
9.1% African American with 6,244 African American residents.
0.1% American Indian with 42 American Indian residents.
3.9% Asian with 2,689 Asian residents.
0.0% Hawaiian with 12 Hawaiian residents.
0.4% Other with 278 Other residents.
5.9% Two Or More with 4,062 Two Or More residents.
3.1% Hispanic with 2,152 Hispanic residents.
| Race | Portland | ME | USA |
|---|---|---|---|
| White | 77.5% | 89.9% | 57.4% |
| African American | 9.1% | 1.8% | 11.9% |
| American Indian | 0.1% | 0.3% | 0.5% |
| Asian | 3.9% | 1.1% | 5.9% |
| Hawaiian | 0.0% | 0.0% | 0.2% |
| Other | 0.4% | 0.4% | 0.6% |
| Two Or More | 5.9% | 4.2% | 4.3% |
| Hispanic | 3.1% | 2.2% | 19.3% |
Gender in Portland
See the full breakdown
Portland is 51.6% female with 35,524 female residents.
Portland is 48.4% male with 33,330 male residents.
| Gender | Portland | ME | USA |
|---|---|---|---|
| Female | 51.6% | 50.7% | 50.5% |
| Male | 48.4% | 49.3% | 49.5% |
Highest level of educational attainment in Portland for adults over 25
See the full breakdown
1.0% of adults in Portland completed < 9th grade.
2.0% of adults in Portland completed 9-12th grade.
15.0% of adults in Portland completed high school / ged.
14.0% of adults in Portland completed some college.
8.0% of adults in Portland completed associate's degree.
36.0% of adults in Portland completed bachelor's degree.
17.0% of adults in Portland completed master's degree.
5.0% of adults in Portland completed professional degree.
2.0% of adults in Portland completed doctorate degree.
| Education | Portland | ME | USA |
|---|---|---|---|
| < 9th Grade | 1.0% | 2.0% | 4.0% |
| 9-12th Grade | 2.0% | 4.0% | 6.0% |
| High School / GED | 15.0% | 30.0% | 26.0% |
| Some College | 14.0% | 18.0% | 19.0% |
| Associate's Degree | 8.0% | 10.0% | 9.0% |
| Bachelor's Degree | 36.0% | 22.0% | 22.0% |
| Master's Degree | 17.0% | 10.0% | 10.0% |
| Professional Degree | 5.0% | 2.0% | 2.0% |
| Doctorate Degree | 2.0% | 2.0% | 2.0% |
Household Income For Portland, Maine
See the full breakdown
4.4% of households in Portland earn Less than $10,000.
3.8% of households in Portland earn $10,000 to $14,999.
5.8% of households in Portland earn $15,000 to $24,999.
6.8% of households in Portland earn $25,000 to $34,999.
10.5% of households in Portland earn $35,000 to $49,999.
16.7% of households in Portland earn $50,000 to $74,999.
11.5% of households in Portland earn $75,000 to $99,999.
18.8% of households in Portland earn $100,000 to $149,999.
10.0% of households in Portland earn $150,000 to $199,999.
11.8% of households in Portland earn $200,000 or more.
| Income | Portland | ME | USA |
|---|---|---|---|
| Less than $10,000 | 4.4% | 4.1% | 5.0% |
| $10,000 to $14,999 | 3.8% | 3.8% | 3.4% |
| $15,000 to $24,999 | 5.8% | 7.2% | 6.3% |
| $25,000 to $34,999 | 6.8% | 7.2% | 6.6% |
| $35,000 to $49,999 | 10.5% | 11.2% | 10.1% |
| $50,000 to $74,999 | 16.7% | 16.8% | 15.5% |
| $75,000 to $99,999 | 11.5% | 13.0% | 12.6% |
| $100,000 to $149,999 | 18.8% | 18.4% | 17.5% |
| $150,000 to $199,999 | 10.0% | 9.1% | 9.6% |
| $200,000 or more | 11.8% | 9.4% | 13.4% |
Source: U.S. Census ACS 5-year estimates (2024)


