Most African American cities in Ohio research summary. We used Saturday Night Science to analyze Ohio’s most recent Census data to determine the cities with the largest Black population, based on the percentage of Black residents.
The city with the largest African American population in Ohio is Warrensville Heights (92.0% Black); the least is Northwood (0.0%). Statewide, Ohio is 12.0% Black — the 17th blackest state in the country.
Roughly 42 million people identifying as Black or African American live in the United States, about 12% of the total population. In Ohio, the Black population is 1,420,878, at 12.0% of the state total.
We broke down the most recent Census data to determine the cities in Ohio with the largest African American population in 2026.
#1 most African American in Ohio
Data | Crime | Cost of living | Movers
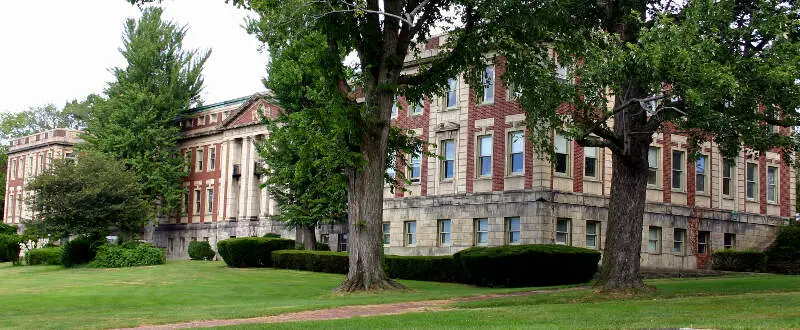
#2 most African American in Ohio
East Cleveland is a city in Cuyahoga County, Ohio, United States, and is the first suburb of Cleveland. The population was 17,843 at the 2010 census. East Cleveland is bounded by the city of Cleveland to its north, west, and a small section of its southwestern edge, and by Cleveland Heights to the east and the majority of its southern limits.
Data | Crime | Cost of living | Movers
#3 most African American in Ohio
Bedford Heights is a city in Cuyahoga County, Ohio, United States. The population was 10,751 at the 2010 census.
Data | Crime | Cost of living | Movers
#4 most African American in Ohio
Maple Heights is a city in Cuyahoga County, Ohio, United States, outside Cleveland. The population was 23,138 at the 2010 census.
Data | Crime | Cost of living | Movers
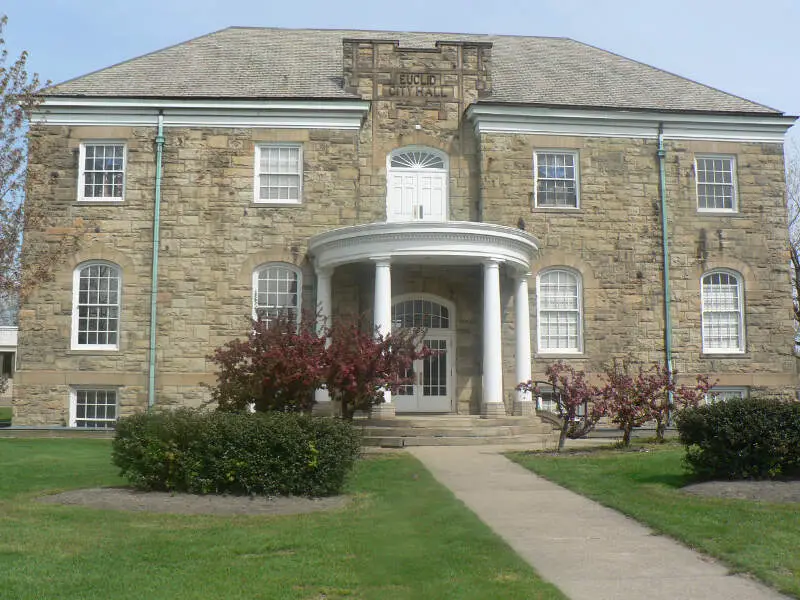
#5 most African American in Ohio
Euclid is a city in Cuyahoga County, Ohio, United States. It is an inner ring suburb of Cleveland. As of the 2010 census, the city had a total population of 48,920. In 2009, Euclid celebrated its bicentennial.
Data | Crime | Cost of living | Movers
#6 most African American in Ohio
Trotwood is a city in Montgomery County, Ohio, United States. The population was 24,431 at the 2010 census. It is part of the Dayton Metropolitan Statistical Area. The city is served by the Trotwood-Madison City School District.
Data | Crime | Cost of living | Movers
#7 most African American in Ohio
Richmond Heights is a city in Cuyahoga County, Ohio, United States. The population was 10,546 at the 2010 census.
Data | Crime | Cost of living | Movers
#8 most African American in Ohio
Forest Park is a city in Hamilton County, Ohio, United States. The population was 18,720 at the 2010 census.
Data | Crime | Cost of living | Movers
#9 most African American in Ohio
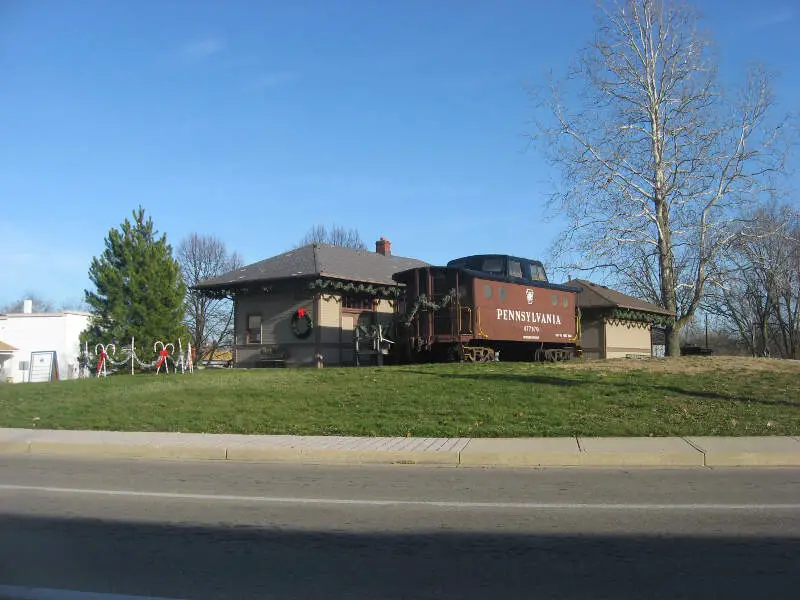
Bedford is a city in Cuyahoga County, Ohio, United States. The population was 13,074 at the 2010 census. It is an eastern suburb of Cleveland.
Data | Crime | Cost of living | Movers
#10 most African American in Ohio
Data | Crime | Cost of living | Movers
The receipts
Compare the top ten
Pick a metric. The bars rescale. The red line is Ohio’s statewide median.
On the map
Where Ohio’s Black communities live
Saturday Night Science
Methodology: How We Determined The Cities In Ohio With The Largest Black Population For 2026
We still believe in the accuracy of data — especially from the Census. So that’s where we went to get the race breakdown across Ohio.
That leads us to the Census’s most recently available data, the 2020-2024 American Community Survey data from the US Census.
Specifically, we looked at table B03002: Hispanic OR LATINO ORIGIN BY RACE. Here are the category names as defined by the Census:
- Hispanic or Latino
- White alone*
- Black or African American alone*
- American Indian and Alaska Native alone*
- Asian alone*
- Native Hawaiian and Other Pacific Islander alone*
- Some other race alone*
- Two or more races*
Our particular column of interest was the number of people who identified as Black or African American.
We limited our analysis to non-CDPs with a population greater than 5,000 people in Ohio. That left us with 243 cities.
We then calculated the percentage of residents that are Black or African American. The percentages ranked from 92.0% to 0.0%.
Finally, we ranked each city based on the percentage of the Black population, with a higher score being more Black than a lower score. Warrensville Heights took the distinction of being the most Black, while Northwood was the least African American city.
We updated this article for 2026. This is our eleventh time ranking the cities in Ohio with the largest African American population.
The full plate
African American Population By City In Ohio
Click any column to sort. Search by city name.
| Rank | City | Population | African American Population | % African American |
|---|---|---|---|---|
| 1 | Warrensville Heights | 13,545 | 12,458 | 92.0% |
| 2 | East Cleveland | 13,534 | 11,809 | 87.3% |
| 3 | Bedford Heights | 10,847 | 8,056 | 74.3% |
| 4 | Maple Heights | 23,258 | 17,140 | 73.7% |
| 5 | Euclid | 48,823 | 32,573 | 66.7% |
| 6 | Trotwood | 23,041 | 15,060 | 65.4% |
| 7 | Richmond Heights | 10,626 | 6,803 | 64.0% |
| 8 | Forest Park | 20,025 | 11,996 | 59.9% |
| 9 | Bedford | 12,931 | 7,461 | 57.7% |
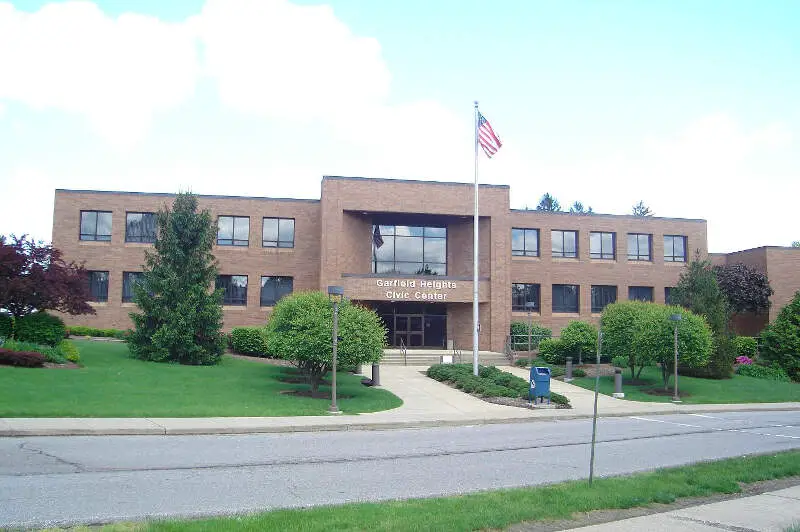
| 10 | Garfield Heights | 29,269 | 16,741 | 57.2% |
| 11 | Mount Healthy | 6,919 | 3,625 | 52.4% |
| 12 | South Euclid | 21,534 | 11,107 | 51.6% |
| 13 | North College Hill | 9,555 | 4,720 | 49.4% |
| 14 | Cleveland | 366,097 | 165,163 | 45.1% |
| 15 | Whitehall | 20,019 | 7,967 | 39.8% |
| 16 | Cleveland Heights | 44,497 | 17,651 | 39.7% |
| 17 | Youngstown | 59,331 | 23,337 | 39.3% |
| 18 | Dayton | 136,579 | 51,305 | 37.6% |
| 19 | Springdale | 11,033 | 4,084 | 37.0% |
| 20 | Cincinnati | 311,224 | 112,931 | 36.3% |
| 21 | Shaker Heights | 28,922 | 9,529 | 32.9% |
| 22 | Reynoldsburg | 41,224 | 12,526 | 30.4% |
| 23 | Columbus | 914,802 | 266,171 | 29.1% |
| 24 | Akron | 189,247 | 54,836 | 29.0% |
| 25 | Clayton | 13,277 | 3,682 | 27.7% |
| 26 | Toledo | 267,463 | 73,960 | 27.7% |
| 27 | Warren | 38,912 | 10,505 | 27.0% |
| 28 | Cheviot | 8,660 | 2,311 | 26.7% |
| 29 | Pickerington | 24,477 | 6,378 | 26.1% |
| 30 | Canton | 69,755 | 16,320 | 23.4% |
| 31 | Willoughby Hills | 9,975 | 2,236 | 22.4% |
| 32 | Sandusky | 24,606 | 5,351 | 21.7% |
| 33 | Grafton | 5,657 | 1,226 | 21.7% |
| 34 | Campbell | 7,784 | 1,646 | 21.1% |
| 35 | University Heights | 13,394 | 2,755 | 20.6% |
| 36 | Lima | 35,010 | 7,158 | 20.4% |
| 37 | Mayfield Heights | 20,022 | 4,049 | 20.2% |
| 38 | Springfield | 58,190 | 10,047 | 17.3% |
| 39 | Twinsburg | 19,410 | 3,349 | 17.3% |
| 40 | Lorain | 65,395 | 10,799 | 16.5% |
| 41 | Gahanna | 35,486 | 5,742 | 16.2% |
| 42 | Parma Heights | 20,581 | 3,319 | 16.1% |
| 43 | Mansfield | 47,663 | 7,536 | 15.8% |
| 44 | Moraine | 6,536 | 1,016 | 15.5% |
| 45 | Fairfield | 44,828 | 6,671 | 14.9% |
| 46 | Huber Heights | 43,455 | 6,168 | 14.2% |
| 47 | Englewood | 13,356 | 1,874 | 14.0% |
| 48 | West Carrollton | 12,976 | 1,793 | 13.8% |
| 49 | Steubenville | 18,124 | 2,449 | 13.5% |
| 50 | Middletown | 51,617 | 6,790 | 13.2% |
| 51 | Streetsboro | 17,661 | 2,295 | 13.0% |
| 52 | Lyndhurst | 13,801 | 1,705 | 12.4% |
| 53 | Wyoming | 8,723 | 1,069 | 12.3% |
| 54 | Elyria | 53,035 | 6,451 | 12.2% |
| 55 | Macedonia | 12,152 | 1,470 | 12.1% |
| 56 | Brooklyn | 11,158 | 1,302 | 11.7% |
| 57 | Oberlin | 8,329 | 966 | 11.6% |
| 58 | Norwood | 19,114 | 2,160 | 11.3% |
| 59 | Ravenna | 11,274 | 1,158 | 10.3% |
| 60 | Beachwood | 13,865 | 1,402 | 10.1% |
| 61 | Willowick | 14,162 | 1,404 | 9.9% |
| 62 | Pataskala | 18,223 | 1,753 | 9.6% |
| 63 | Wickliffe | 12,659 | 1,194 | 9.4% |
| 64 | Barberton | 24,844 | 2,342 | 9.4% |
| 65 | Solon | 23,943 | 2,255 | 9.4% |
| 66 | Reading | 10,502 | 978 | 9.3% |
| 67 | Fairborn | 34,534 | 3,105 | 9.0% |
| 68 | Conneaut | 12,357 | 1,105 | 8.9% |
| 69 | Westerville | 38,645 | 3,301 | 8.5% |
| 70 | Ashtabula | 17,856 | 1,525 | 8.5% |
| 71 | Zanesville | 24,740 | 2,112 | 8.5% |
| 72 | Kent | 27,116 | 2,302 | 8.5% |
| 73 | Marion | 35,669 | 3,015 | 8.5% |
| 74 | Fairlawn | 7,711 | 648 | 8.4% |
| 75 | Blue Ash | 13,455 | 1,124 | 8.4% |
| 76 | Fremont | 15,835 | 1,320 | 8.3% |
| 77 | Chillicothe | 21,902 | 1,754 | 8.0% |
| 78 | Alliance | 21,478 | 1,717 | 8.0% |
| 79 | Berea | 18,218 | 1,453 | 8.0% |
| 80 | Xenia | 25,689 | 1,968 | 7.7% |
| 81 | Orrville | 8,343 | 637 | 7.6% |
| 82 | Painesville | 20,548 | 1,556 | 7.6% |
| 83 | Hamilton | 63,468 | 4,754 | 7.5% |
| 84 | Willoughby | 24,046 | 1,769 | 7.4% |
| 85 | Riverside | 24,435 | 1,760 | 7.2% |
| 86 | Massillon | 32,338 | 2,041 | 6.3% |
| 87 | Centerville | 25,205 | 1,566 | 6.2% |
| 88 | Cambridge | 10,060 | 613 | 6.1% |
| 89 | Martins Ferry | 6,140 | 371 | 6.0% |
| 90 | Kettering | 57,206 | 3,418 | 6.0% |
| 91 | Sharonville | 14,030 | 832 | 5.9% |
| 92 | Brook Park | 18,284 | 1,063 | 5.8% |
| 93 | Oxford | 21,753 | 1,243 | 5.7% |
| 94 | Ontario | 6,667 | 376 | 5.6% |
| 95 | Lakewood | 50,007 | 2,731 | 5.5% |
| 96 | Fostoria | 12,344 | 669 | 5.4% |
| 97 | Parma | 79,870 | 4,328 | 5.4% |
| 98 | Union | 7,037 | 374 | 5.3% |
| 99 | Mason | 35,509 | 1,786 | 5.0% |
| 100 | Sidney | 20,501 | 1,006 | 4.9% |
Source: U.S. Census ACS 2020-2024. 243 cities with more than 5,000 residents.
Summary
Summary: Black Populations Across Ohio
If you’re looking for a breakdown of African American populations across Ohio according to the most recent data, this is an accurate list.
The blackest cities in Ohio are Warrensville Heights, East Cleveland, Bedford Heights, Maple Heights, Euclid, Trotwood, Richmond Heights, Forest Park, Bedford, and Garfield Heights. Not sold on Ohio? Take the two-minute Find Your Place quiz and see which state actually fits you.


