Most Asian cities in Montana research summary. We analyzed Montana’s most recent Census data to determine the most Asian cities in Montana based on the percentage of Asian residents.
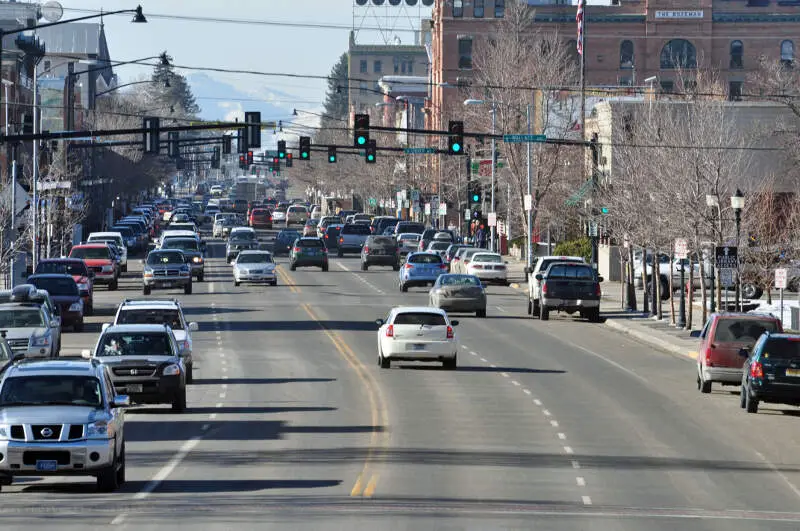
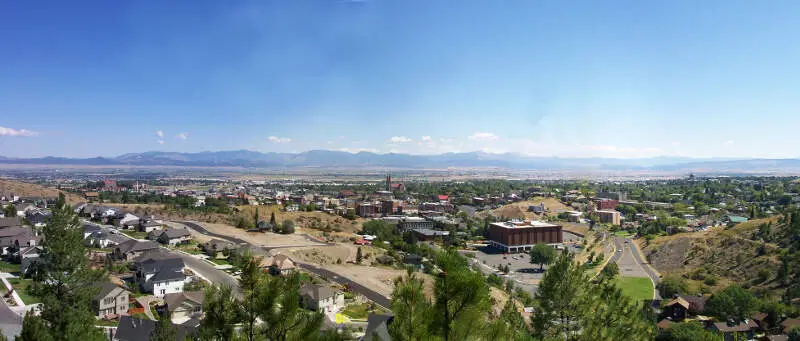
2.1% Asian · #1 most Asian in Montana
Bozeman is a city in and the seat of Gallatin County, Montana, United States. Located in southwest Montana, the 2010 census put Bozeman’s population at 37,280 and by 2016 the population rose to 45,250, making it the fourth largest city in Montana. It is the principal city of the Bozeman, MT Micropolitan Statistical Area, consisting of all of Gallatin County with a population of 97,304. It is the largest Micropolitan Statistical Area in Montana and is the third largest of all of Montana-s statistical areas.
Data | Crime | Cost of living | Movers
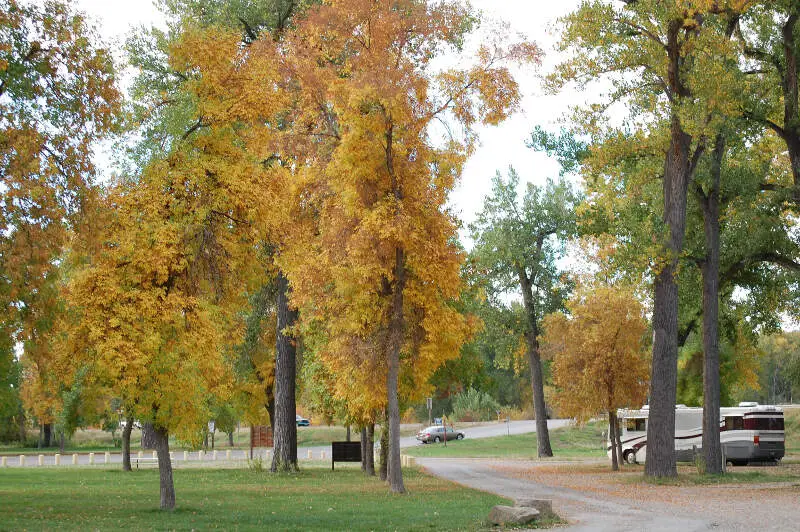
2.1% Asian · #2 most Asian in Montana
Laurel is a city in Yellowstone County, Montana, United States. It is the third largest community in the Billings Metropolitan Statistical Area, and is located in the Yellowstone Valley, as an east-west terminal division point of the Burlington-Northern Railroad. The population was 6,781 at the 2010 census.
Data | Crime | Cost of living | Movers
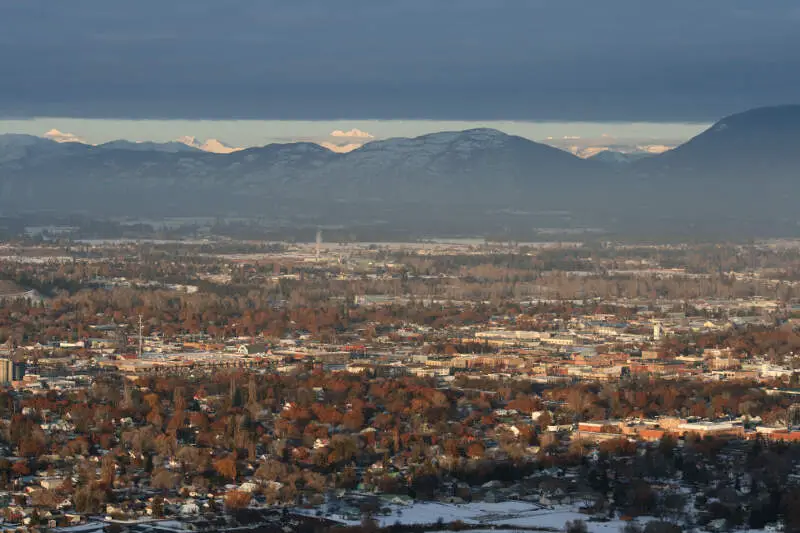
1.4% Asian · #3 most Asian in Montana
Kalispell is a city in, and the county seat of Flathead County, Montana, United States. The 2015 Census estimates put Kalispell’s population at 22,052. The Kalispell Micropolitan Statistical Area has a population of 93,068 and it is the largest city and commercial center of northwest Montana. The name Kalispell is a Salish word meaning “flat land above the lake”. Kalispell is also the gateway to Glacier National Park.
Data | Crime | Cost of living | Movers
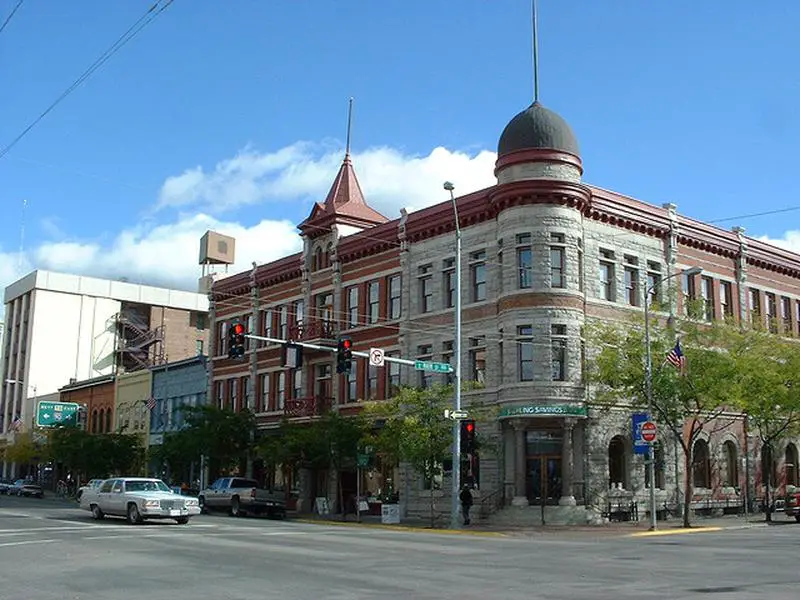
1.1% Asian · #4 most Asian in Montana
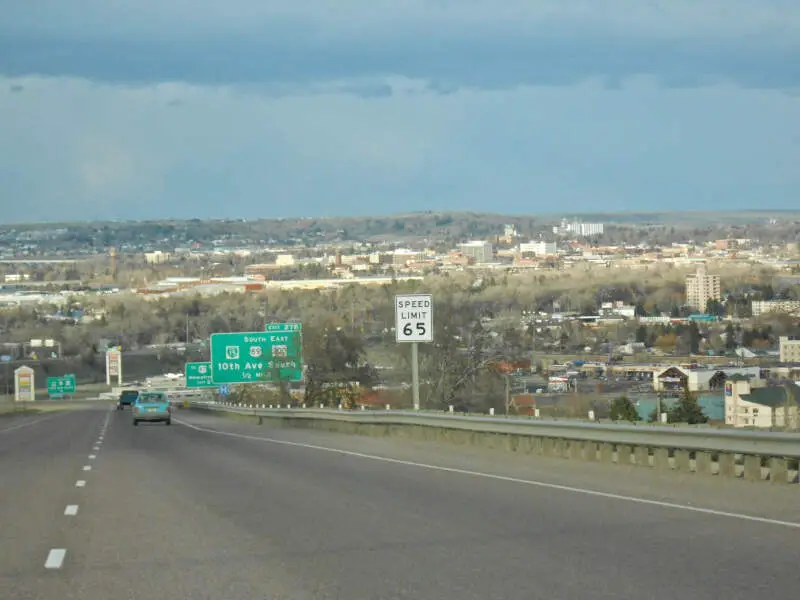
Missoula is a city in the U.S. state of Montana and is the county seat of Missoula County. It is located along the Clark Fork River near its confluences with the Bitterroot and Blackfoot Rivers in western Montana and at the convergence of five mountain ranges, thus is often described as the “hub of five valleys”. In 2016, the United States Census Bureau estimated the city’s population at 72,364 and the population of the Missoula Metropolitan Area at 116,130. In the 1990s, Missoula overtook GreatFalls as Montana-s secondlargest city, behind Billings. Missoula is home to the University of Montana, a public research university.
Data | Crime | Cost of living | Movers
1.0% Asian · #5 most Asian in Montana
Great Falls is a city in and the county seat of Cascade County, Montana, United States. The 2015 census estimate put the population at 59,638. The population was 58,505 at the 2010 census. It is the principal city of the Great Falls, Montana Metropolitan Statistical Area, which encompasses all of Cascade County and has a population of 82,278. Great Falls was the largest city in Montana from 1950 to 1970, when Billings surpassed it. Great Falls remained the second largest city in Montana until 2000, when it was passed by Missoula. Since then Great Falls has been the third largest city in the state.
Data | Crime | Cost of living | Movers
0.8% Asian · #6 most Asian in Montana
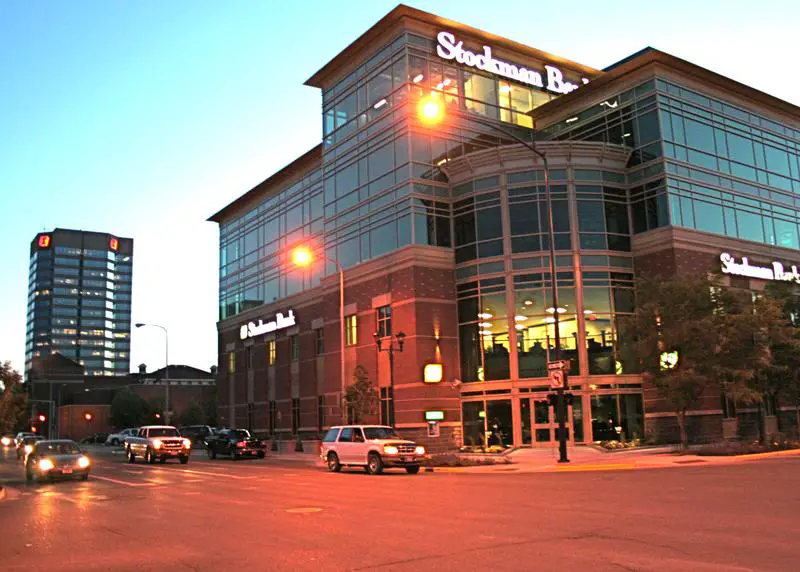
Billings is the largest city in the state of Montana, and the principal city of the Billings Metropolitan Area with a population of 166,855. It has a trade area of over half a million people.
Data | Crime | Cost of living | Movers
0.7% Asian · #7 most Asian in Montana
Lewistown is a city in and the county seat of Fergus County, Montana, United States. The population was 5,901 at the 2010 census. Lewistown is located in central Montana, the geographic center of the state, southeast of Great Falls. First planned in 1882, it was the site of an 1880s gold rush.
Data | Crime | Cost of living | Movers
0.6% Asian · #8 most Asian in Montana
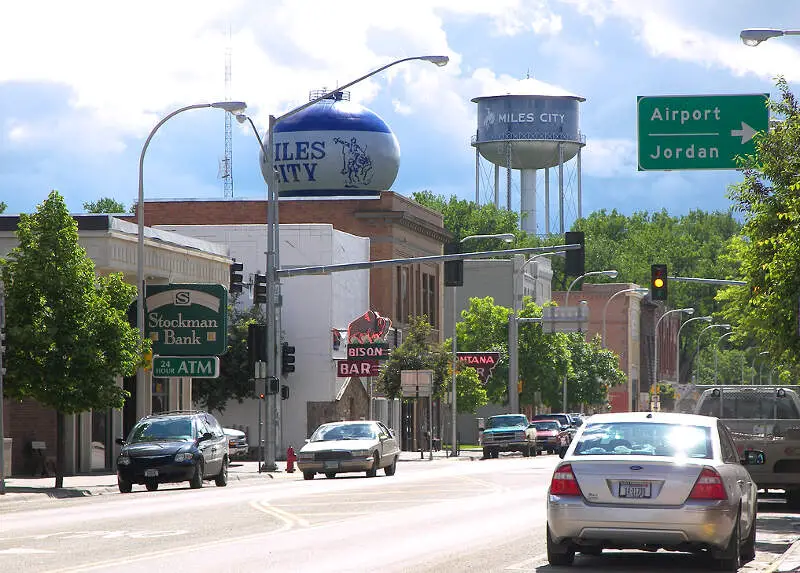
Miles City is a city in and the county seat of Custer County, Montana, United States. The population was 8,410 at the 2010 census.
Data | Crime | Cost of living | Movers
0.5% Asian · #9 most Asian in Montana
Helena is the state capital of the U.S. state of Montana and the county seat of Lewis and Clark County.
Data | Crime | Cost of living | Movers
0.5% Asian · #10 most Asian in Montana
Data | Crime | Cost of living | Movers
The receipts
Compare the top ten
Pick a metric. The bars rescale. The red line is Montana’s statewide median.
On the map
Where Montana’s Asian communities live
Saturday Night Science
Methodology: How We Determined The Cities In Montana With The Largest Asian Population For 2026
We used Saturday Night Science to compare Census data on race across every place in Montana.
The Census’s most recently available data comes from the 2020-2024 American Community Survey.
Specifically, we looked at table B03002: Hispanic OR LATINO ORIGIN BY RACE. Here are the category names as defined by the Census:
- Hispanic or Latino
- White alone*
- Black or African American alone*
- American Indian and Alaska Native alone*
- Asian alone*
- Native Hawaiian and Other Pacific Islander alone*
- Some other race alone*
- Two or more races*
Our particular column of interest here was the number of people who identified as Asian alone.
We limited our analysis to cities with a population greater than 6,000 people. That left us with 15 cities.
We then calculated the percentage of residents that are Asian. The percentages ranked from 2.1% to 0.0%.
Finally, we ranked each city based on the percentage of Asian population, with a higher percentage being more Asian. Bozeman took the distinction of being the most Asian, while Whitefish was the least Asian city.
We updated this article for 2026. This report reflects our eleventh time ranking the cities in Montana with the largest Asian population.
The full plate
Cities In Montana By Asian Population
Click any column to sort. Search by city name.
| Rank | City | Population | Asian Population | % Asian |
|---|---|---|---|---|
| 1 | Bozeman | 56,114 | 1,170 | 2.1% |
| 2 | Laurel | 7,215 | 148 | 2.1% |
| 3 | Kalispell | 28,504 | 408 | 1.4% |
| 4 | Missoula | 76,514 | 864 | 1.1% |
| 5 | Great Falls | 60,329 | 607 | 1.0% |
| 6 | Billings | 119,434 | 967 | 0.8% |
| 7 | Lewistown | 6,087 | 43 | 0.7% |
| 8 | Miles City | 8,407 | 50 | 0.6% |
| 9 | Helena | 33,639 | 183 | 0.5% |
| 10 | Belgrade | 11,872 | 58 | 0.5% |
| 11 | Livingston | 8,780 | 28 | 0.3% |
| 12 | Anaconda-Deer Lodge County | 9,597 | 23 | 0.2% |
| 13 | Sidney | 6,171 | 14 | 0.2% |
| 14 | Havre | 9,258 | 0 | 0.0% |
| 14 | Whitefish | 8,749 | 0 | 0.0% |
Source: U.S. Census ACS 2020-2024. 15 cities with more than 6,000 residents.
Summary
Summary: Asian Populations Across Montana
If you’re looking for a breakdown of Asian populations across Montana according to the most recent data, this is an accurate list.
The most Asian cities in Montana are Bozeman, Laurel, Kalispell, Missoula, Great Falls, Billings, Lewistown, Miles City, Helena, and Belgrade.


