Most Asian cities in New Mexico research summary. We analyzed New Mexico’s most recent Census data to determine the most Asian cities in New Mexico based on the percentage of Asian residents.
3.4% Asian · #1 most Asian in New Mexico
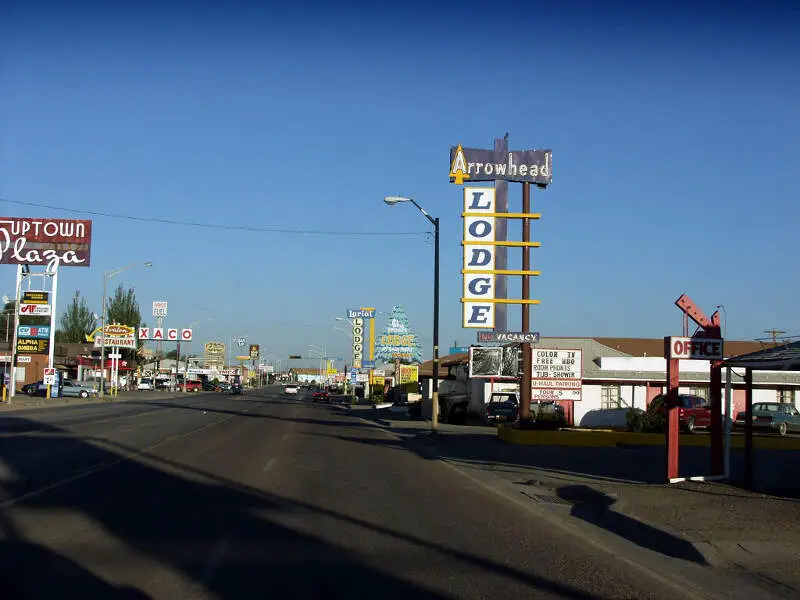
Gallup is a city in McKinley County, New Mexico, United States, with a population of 21,678 as of the 2010 census. A substantial percentage of its population is Native American, with residents from the Navajo, Hopi, and Zuni tribes. Gallup is the county seat of McKinley County and the most populous city between Flagstaff and Albuquerque, along the historic U.S. Route 66.
Data | Crime | Cost of living | Movers
3.2% Asian · #2 most Asian in New Mexico
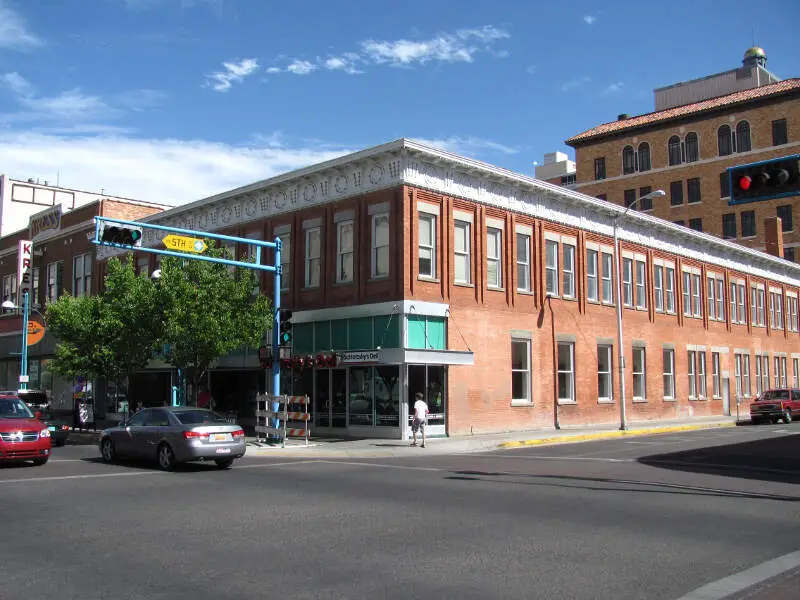
Albuquerque AL-b-kur-kee; Navajo: Beeeldl Dahsinil ) is the most populous city in the U.S. state of New Mexico. The high-elevation city serves as the county seat of Bernalillo County, and it is situated in the north central part of the state, straddling the Rio Grande. The city population is 559,277 as of the July 1, 2016 population estimate from the United States Census Bureau, and ranks as the 32nd-largest city in the U.S. The Albuquerque metropolitan statistical area has a population of 909,906 according to the United States Census Bureau’s most recently available estimate for 2016. Albuquerque is the 60th-largest United States metropolitan area. The Albuquerque MSA population includes the city of Rio Rancho, Bernalillo, Placitas, Corrales, Los Lunas, Belen, Bosque Farms, and forms part of the larger Albuquerque-Santa Fe-Las Vegas combined statistical area, with a total population of 1,171,991 as of the July 1, 2016, Census Bureau estimates.
Data | Crime | Cost of living | Movers
3.2% Asian · #3 most Asian in New Mexico
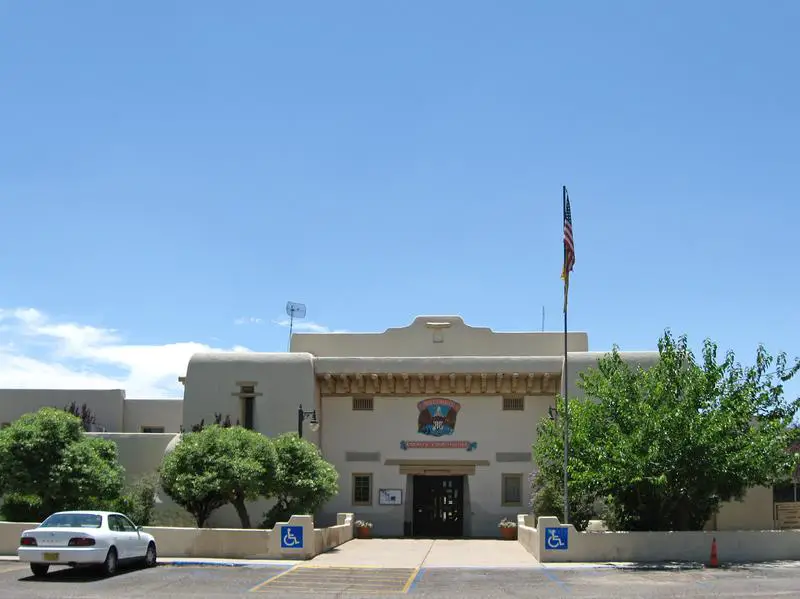
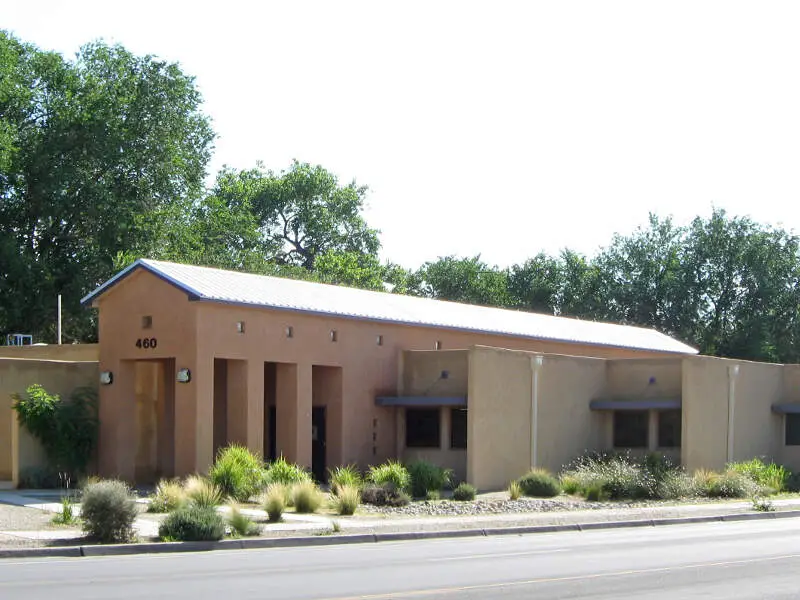
Socorro is a city in Socorro County in the U.S. state of New Mexico. It is in the Rio Grande Valley at an elevation of 4,579 feet. In 2012 the population was 8,906. It is the county seat of Socorro County. Socorro is located 74 miles south of Albuquerque and 146 miles north of Las Cruces.
Data | Crime | Cost of living | Movers
2.4% Asian · #4 most Asian in New Mexico
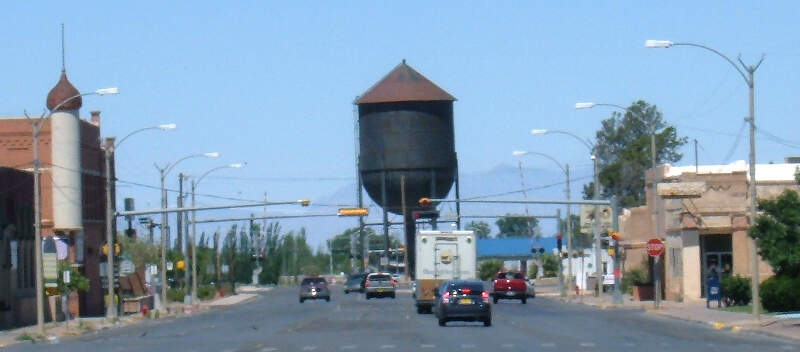
Alamogordo is the seat of Otero County, New Mexico, United States. A city in the Tularosa Basin of the Chihuahuan Desert, it is bordered on the east by the Sacramento Mountains and to the west by White Sands National Monument. It is the city nearest to Holloman Air Force Base. The population was 30,403 as of the 2010 census. Alamogordo is known for its connection with the Trinity test, the first explosion of an atomic bomb, and also for the Atari video game burial of 1983.
Data | Crime | Cost of living | Movers
2.2% Asian · #5 most Asian in New Mexico
Los Lunas is a village in Valencia County, New Mexico, in the United States. As of the 2010 census, the village population is 14,835 inside the village limits due to the new housing developments at El Cerro de Los Lunas. It is the county seat of Valencia County.
Data | Crime | Cost of living | Movers
2.1% Asian · #6 most Asian in New Mexico
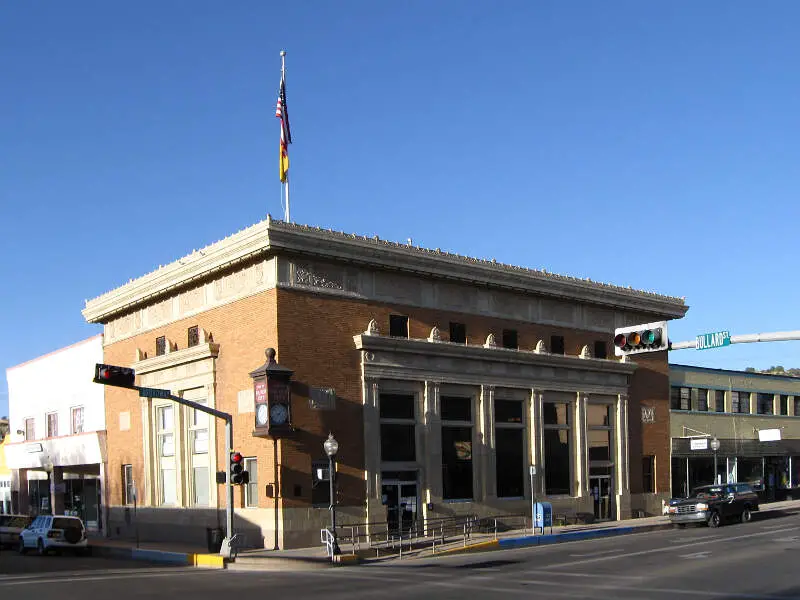
Silver City is a town in Grant County, New Mexico, United States. It is the county seat and the home of Western New Mexico University. As of the 2010 census the population was 10,315. In 2015 the population was estimated to be 10,004.
Data | Crime | Cost of living | Movers
1.9% Asian · #7 most Asian in New Mexico
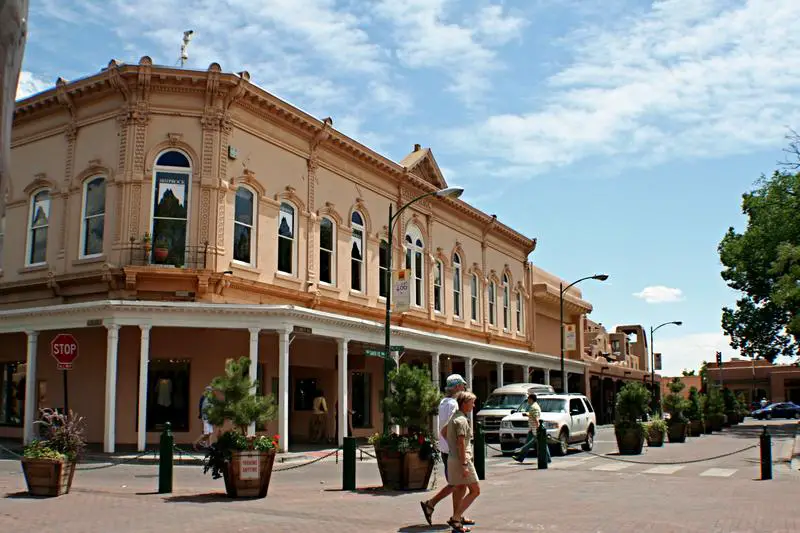
Santa Fe is the capital of the state of New Mexico. It is the fourth-largest city in the state and the seat of Santa Fe County.
Data | Crime | Cost of living | Movers
1.9% Asian · #8 most Asian in New Mexico
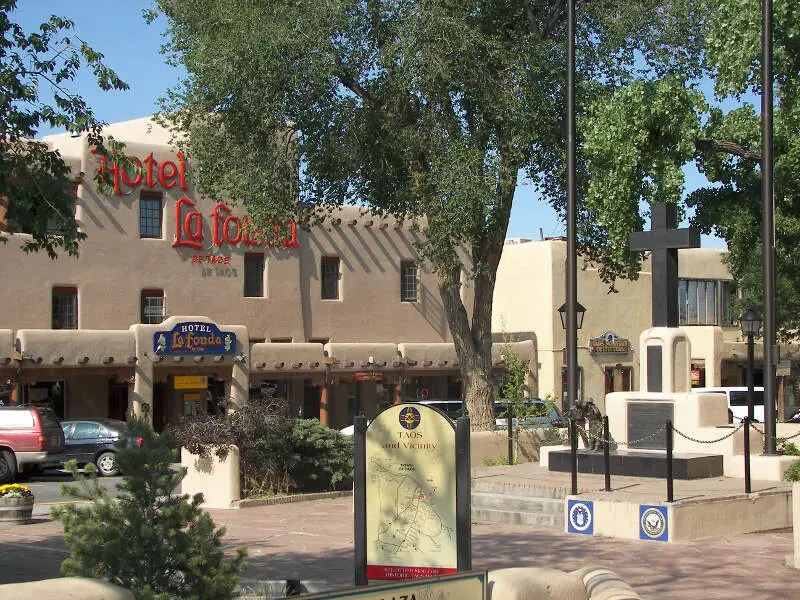
Taos is a town in Taos County in the north-central region of New Mexico in the Sangre de Cristo Mountains, incorporated in 1934. As of the 2010 census, its population was 5,716. Other nearby communities include Ranchos de Taos, Caon, Taos Canyon, Ranchitos, El Prado, and Arroyo Seco. The town is close to Taos Pueblo, the Native American village and tribe from which it takes its name.
Data | Crime | Cost of living | Movers

1.7% Asian · #9 most Asian in New Mexico
Deming is a city in Luna County, New Mexico, United States, located 60 miles west of Las Cruces and thirty-three miles north of the Mexican border. The population was 14,855 according to the 2010 census. Deming is the county seat and principal community of Luna County.
Data | Crime | Cost of living | Movers
1.7% Asian · #10 most Asian in New Mexico
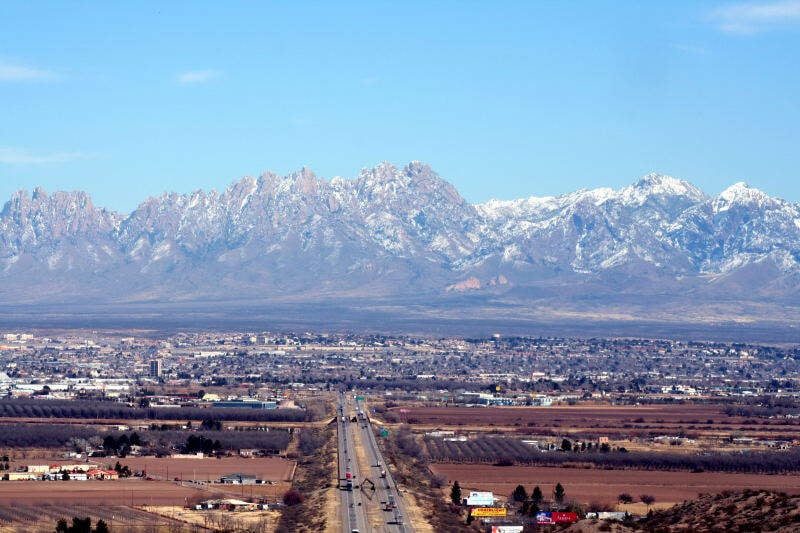
Las Cruces, also known as “The City of the Crosses”, is the seat of Doa Ana County, New Mexico, United States. As of the 2010 census the population was 97,618, and in 2015 the estimated population was 101,643, making it the second largest city in the state, after Albuquerque. Las Cruces is the largest city in both Doa Ana County and southern New Mexico. The Las Cruces metropolitan area had an estimated population of 213,676 in 2014. It is the principal city of a metropolitan statistical area which encompasses all of Doa Ana County and is part of the larger El Paso-Las Cruces combined statistical area.
Data | Crime | Cost of living | Movers
The receipts
Compare the top ten
Pick a metric. The bars rescale. The red line is New Mexico’s statewide median.
On the map
Where New Mexico’s Asian communities live
Saturday Night Science
Methodology: How We Determined The Cities In New Mexico With The Largest Asian Population For 2026
We used Saturday Night Science to compare Census data on race across every place in New Mexico.
The Census’s most recently available data comes from the 2020-2024 American Community Survey.
Specifically, we looked at table B03002: Hispanic OR LATINO ORIGIN BY RACE. Here are the category names as defined by the Census:
- Hispanic or Latino
- White alone*
- Black or African American alone*
- American Indian and Alaska Native alone*
- Asian alone*
- Native Hawaiian and Other Pacific Islander alone*
- Some other race alone*
- Two or more races*
Our particular column of interest here was the number of people who identified as Asian alone.
We limited our analysis to cities with a population greater than 5,000 people. That left us with 32 cities.
We then calculated the percentage of residents that are Asian. The percentages ranked from 3.4% to 0.0%.
Finally, we ranked each city based on the percentage of Asian population, with a higher percentage being more Asian. Gallup took the distinction of being the most Asian, while Tucumcari was the least Asian city.
We updated this article for 2026. This report reflects our eleventh time ranking the cities in New Mexico with the largest Asian population.
The full plate
Cities In New Mexico By Asian Population
Click any column to sort. Search by city name.
| Rank | City | Population | Asian Population | % Asian |
|---|---|---|---|---|
| 1 | Gallup | 21,023 | 714 | 3.4% |
| 2 | Albuquerque | 562,218 | 17,979 | 3.2% |
| 3 | Socorro | 8,481 | 269 | 3.2% |
| 4 | Alamogordo | 31,307 | 753 | 2.4% |
| 5 | Los Lunas | 18,618 | 407 | 2.2% |
| 6 | Silver City | 9,536 | 202 | 2.1% |
| 7 | Santa Fe | 89,019 | 1,680 | 1.9% |
| 8 | Taos | 6,458 | 121 | 1.9% |
| 9 | Deming | 15,221 | 262 | 1.7% |
| 10 | Las Cruces | 114,197 | 1,958 | 1.7% |
| 11 | Rio Rancho | 108,515 | 1,617 | 1.5% |
| 12 | Roswell | 47,638 | 671 | 1.4% |
| 13 | Clovis | 37,942 | 455 | 1.2% |
| 14 | Hobbs | 40,252 | 392 | 1.0% |
| 15 | Farmington | 46,314 | 433 | 0.9% |
| 16 | Lovington | 11,498 | 99 | 0.9% |
| 17 | Carlsbad | 31,746 | 265 | 0.8% |
| 18 | Corrales | 8,555 | 70 | 0.8% |
| 19 | Bloomfield | 7,395 | 58 | 0.8% |
| 20 | Artesia | 12,576 | 94 | 0.7% |
| 21 | Portales | 11,968 | 80 | 0.7% |
| 22 | Ruidoso | 7,699 | 46 | 0.6% |
| 23 | Los Ranchos de Albuquerque | 5,857 | 26 | 0.4% |
| 24 | Raton | 6,026 | 26 | 0.4% |
| 25 | Aztec | 6,150 | 25 | 0.4% |
| 26 | Truth or Consequences | 6,019 | 18 | 0.3% |
| 27 | Belen | 7,450 | 18 | 0.2% |
| 28 | Bernalillo | 9,086 | 16 | 0.2% |
| 29 | Las Vegas | 13,000 | 19 | 0.1% |
| 31 | Sunland Park | 17,463 | 0 | 0.0% |
| 31 | Grants | 8,951 | 0 | 0.0% |
| 31 | Tucumcari | 5,160 | 0 | 0.0% |
Source: U.S. Census ACS 2020-2024. 32 cities with more than 5,000 residents.
Summary
Summary: Asian Populations Across New Mexico
If you’re looking for a breakdown of Asian populations across New Mexico according to the most recent data, this is an accurate list.
The most Asian cities in New Mexico are Gallup, Albuquerque, Socorro, Alamogordo, Los Lunas, Silver City, Santa Fe, Taos, Deming, and Las Cruces.


