Racial diversity in Tennessee is a mixed bag.
There are parts of Tennessee where there’s a high level of diversity. But where will you find the most diverse places in Tennessee?
To answer that question, we went to the US Census data. Using Saturday Night Science, we measured the Gini coefficient for all 101 cities in Tennessee to rank them from most to least diverse.
#1 most diverse in Tennessee
Data | Crime | Cost of living | Movers
#2 most diverse in Tennessee
Data | Crime | Cost of living | Movers
#3 most diverse in Tennessee
Smyrna is a town in Rutherford County, Tennessee. Smyrna’s population was 39,974 at the 2010 census and 43,063 in 2013. In 2007, U.S. News & World Report listed Smyrna as one of the best places in the United States to retire.
Data | Crime | Cost of living | Movers
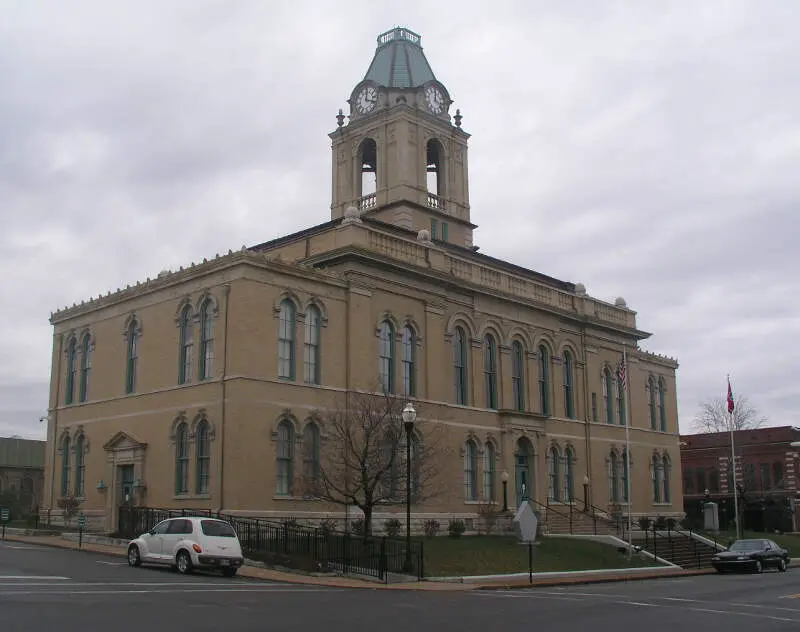
#4 most diverse in Tennessee
The city of Clarksville is the county seat of Montgomery County, Tennessee, United States. It is the fifth-largest city in the state behind Nashville, Memphis, Knoxville, and Chattanooga. The city had a population of 132,929 at the 2010 census, and an estimated population of 150,287 in 2016.
Data | Crime | Cost of living | Movers
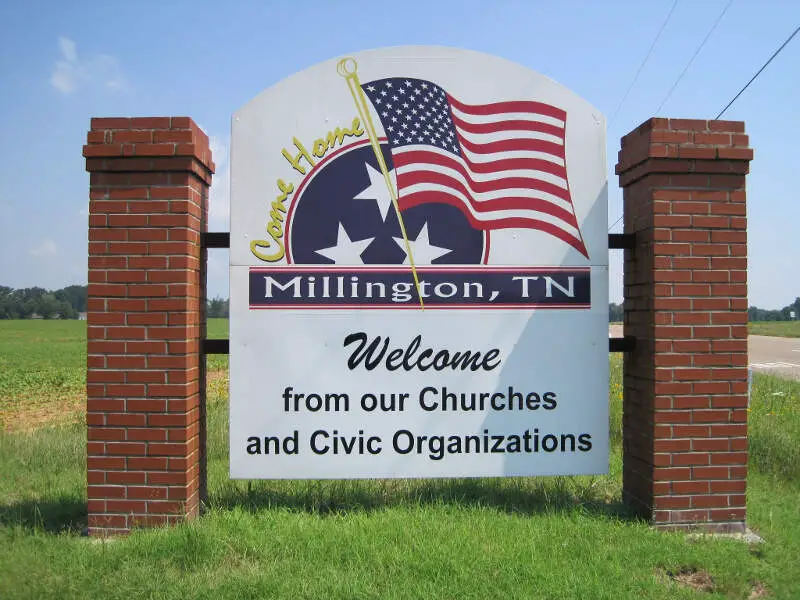
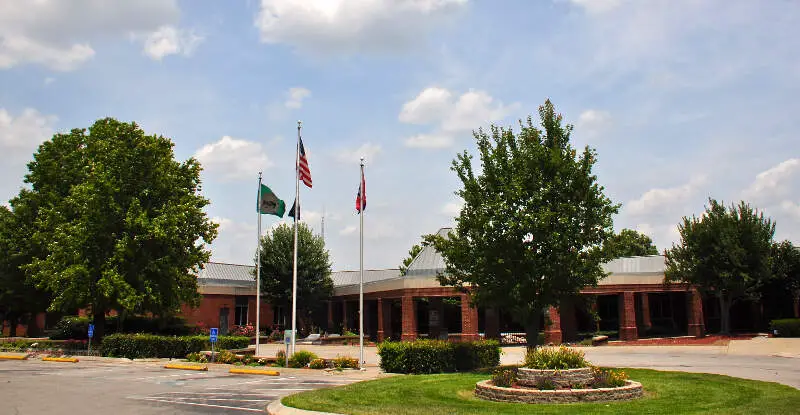
#5 most diverse in Tennessee
Millington is a city in Shelby County, Tennessee, United States. As of the 2010 census, it had a population of 10,176. Millington is the home of the Memphis International Raceway. It was granted the title “Flag City Tennessee” by the Tennessee State Legislature. The Naval Support Activity Mid-South is located at the former Memphis Naval Air Station, which was changed functions from a training base to an administrative one in 1993. There is also a general aviation airport that features the third longest runway in Tennessee.
Data | Crime | Cost of living | Movers
#6 most diverse in Tennessee
Humboldt is a city in Gibson and Madison counties, Tennessee. The population was 8,452 at the 2010 census, a decline of 1,015 from 2000. It is the principal city of and is included in the Humboldt, Tennessee Micropolitan Statistical Area, which is included in the Jackson, Tennessee-Humboldt, Tennessee Combined Statistical Area. It is Gibson County’s largest city and Madison County’s second largest city after Jackson.
Data | Crime | Cost of living | Movers
#7 most diverse in Tennessee
Goodlettsville is a city in Davidson and Sumner counties, Tennessee. Goodlettsville was incorporated as a city in 1958 with a population of just over 3,000 residents; at the 2010 census, the city had a total population of 15,921 and in 2015 the population was 16,994. Goodlettsville chose to remain autonomous in 1963 when the city of Nashville merged with the government of Davidson County.
Data | Crime | Cost of living | Movers
#8 most diverse in Tennessee
Data | Crime | Cost of living | Movers
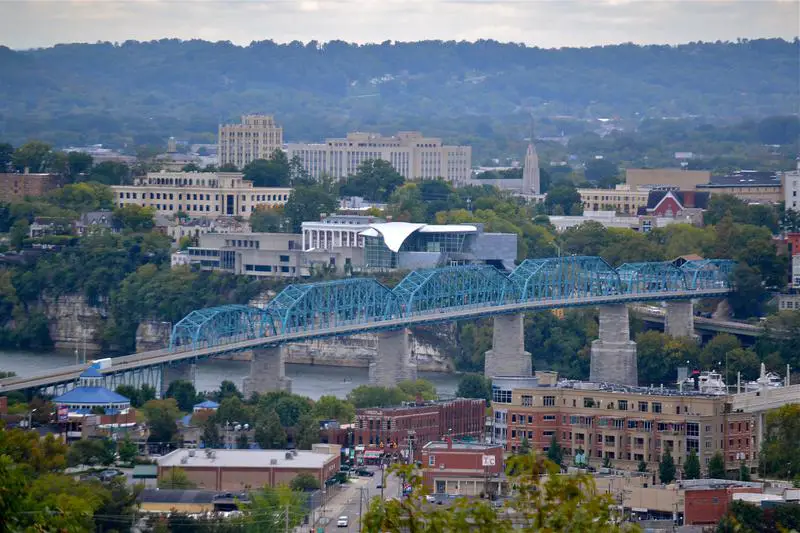
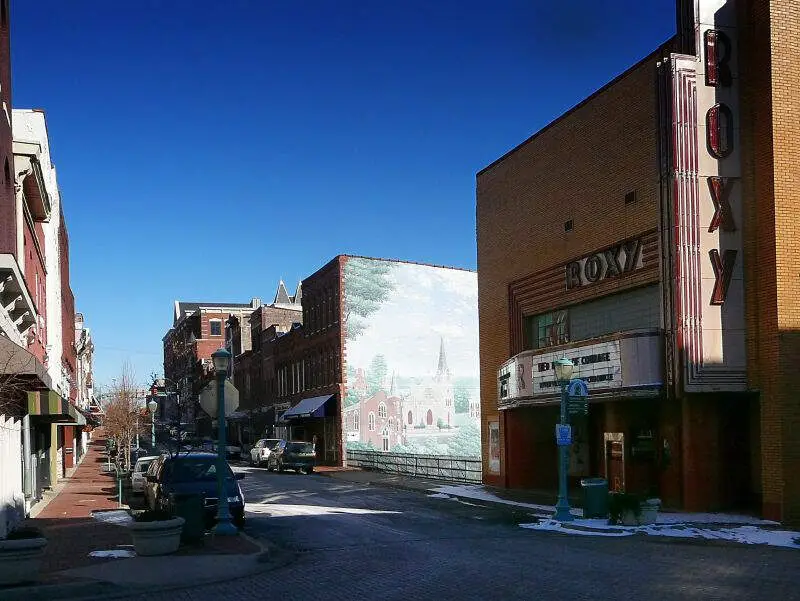
#9 most diverse in Tennessee
Chattanooga is a city in the U.S. state of Tennessee, with a population of 176,588 in 2015. The fourth-largest Tennessee city, it is the seat of Hamilton County. Located in southeastern Tennessee in East Tennessee, on the Tennessee River, served by multiple railroads and Interstate highways, Chattanooga is a transit hub. Chattanooga lies 120 miles northwest of Atlanta, Georgia, 120 miles southwest of Knoxville, Tennessee, 135 miles southeast of Nashville, Tennessee, 120 miles northeast of Huntsville, Alabama, and 148 miles northeast of Birmingham, Alabama.
Data | Crime | Cost of living | Movers
#10 most diverse in Tennessee
Jackson is the county seat of Madison County, Tennessee. Located 70 miles east of Memphis, it is a regional center of trade for West Tennessee. Its total population was 65,211 at the 2010 census and 67,265 in the 2012 Census estimate.
Data | Crime | Cost of living | Movers
The receipts
Compare the top ten
Pick a metric. The bars rescale. The red line is Tennessee’s statewide median.
On the map
Where diversity lives in Tennessee
Saturday Night Science
Methodology: How we determined the most diverse cities in Tennessee for 2026
We still believe in the accuracy of data — especially from the Census — and Saturday Night Science. So that’s where we went to get the race breakdown across Tennessee.
That leads us to the Census’s most recently available data, the 2020-2024 American Community Survey data from the US Census.
Specifically, we looked at table B03002: HISPANIC OR LATINO ORIGIN BY RACE. Here are the category names as defined by the Census:
- White alone*
- Black or African American alone*
- American Indian and Alaska Native alone*
- Asian alone*
- Native Hawaiian and Other Pacific Islander alone*
- Some other race alone*
- Two or more races*
- Hispanic or Latino
We limited our analysis to non-CDPs with a population greater than 5,000 people. That left us with 101 cities.
We then calculated the HHI for each city by finding the racial breakdown of a city in percent terms, squaring them, and then adding the squares together. This left us with scores ranging from 3,105 (La Vergne) to 9,391 (Mount Carmel).
Finally, we ranked each city based on the HHI, with a lower score being more diverse than a high score. La Vergne took the distinction of being the most diverse, while Mount Carmel was the least diverse city.
We updated this article for 2026. This report is our eleventh time ranking the most diverse places in Tennessee.
The full plate
Race By City In Tennessee For 2026
Click any column to sort. Search by city name.
| Rank | City | Population | HHI | % White | % Black | % Hispanic | % Asian |
|---|---|---|---|---|---|---|---|
| 1 | La Vergne | 40,243 | 3,105 | 43.1% | 24.1% | 25.2% | 4.1% |
| 2 | Springfield | 19,255 | 3,343 | 46.5% | 21.0% | 26.9% | 0.8% |
| 3 | Smyrna | 56,692 | 3,549 | 53.2% | 18.9% | 17.7% | 5.1% |
| 4 | Clarksville | 176,456 | 3,681 | 54.6% | 21.8% | 12.9% | 2.5% |
| 5 | Millington | 11,289 | 3,780 | 50.5% | 33.4% | 9.8% | 3.2% |
| 6 | Humboldt | 7,787 | 3,810 | 44.2% | 42.3% | 6.0% | 0.0% |
| 7 | Goodlettsville | 17,597 | 3,903 | 55.8% | 25.5% | 9.0% | 1.4% |
| 8 | Shelbyville | 24,661 | 3,929 | 54.2% | 9.6% | 29.5% | 0.6% |
| 9 | Chattanooga | 185,783 | 3,962 | 55.5% | 27.6% | 10.0% | 2.3% |
| 10 | Jackson | 68,435 | 4,058 | 45.7% | 44.0% | 5.1% | 1.3% |
| 11 | Ripley | 7,658 | 4,162 | 39.1% | 50.8% | 3.8% | 0.1% |
| 12 | Murfreesboro | 161,445 | 4,374 | 62.9% | 16.2% | 9.7% | 3.7% |
| 13 | Memphis | 618,980 | 4,547 | 22.4% | 62.7% | 10.4% | 1.7% |
| 14 | Pigeon Forge | 6,375 | 4,551 | 56.9% | 1.3% | 35.8% | 1.4% |
| 15 | Union City | 10,982 | 4,601 | 63.6% | 20.5% | 11.0% | 0.2% |
| 16 | Collierville | 51,515 | 4,737 | 66.3% | 10.7% | 5.0% | 13.8% |
| 17 | East Ridge | 22,070 | 4,763 | 66.0% | 11.1% | 16.5% | 1.4% |
| 18 | Gallatin | 48,532 | 4,797 | 66.6% | 14.5% | 11.2% | 2.0% |
| 19 | Covington | 8,587 | 4,844 | 42.4% | 55.2% | 1.4% | 0.0% |
| 20 | Morristown | 31,527 | 4,863 | 65.2% | 4.7% | 24.0% | 0.7% |
| 21 | Pulaski | 8,285 | 4,880 | 65.7% | 21.6% | 3.3% | 0.2% |
| 22 | Columbia | 45,441 | 4,917 | 67.1% | 16.5% | 11.1% | 1.1% |
| 23 | Fayetteville | 7,057 | 4,942 | 67.0% | 18.4% | 5.3% | 0.0% |
| 24 | Bolivar | 5,144 | 4,951 | 29.7% | 63.6% | 3.9% | 0.0% |
| 25 | Dyersburg | 15,979 | 5,046 | 65.2% | 27.8% | 3.1% | 0.6% |
| 26 | Brownsville | 9,622 | 5,101 | 24.0% | 67.0% | 4.7% | 0.0% |
| 27 | Lakeland | 14,192 | 5,104 | 69.5% | 12.7% | 8.6% | 6.0% |
| 28 | Sevierville | 18,397 | 5,121 | 67.9% | 2.1% | 22.0% | 4.2% |
| 29 | Lebanon | 44,788 | 5,138 | 69.7% | 12.0% | 10.7% | 2.0% |
| 30 | Milan | 8,244 | 5,149 | 67.8% | 22.1% | 1.9% | 0.5% |
| 31 | Bartlett | 56,876 | 5,165 | 68.8% | 19.7% | 4.4% | 3.9% |
| 32 | Collegedale | 11,330 | 5,176 | 70.0% | 9.2% | 12.7% | 5.2% |
| 33 | Alcoa | 12,222 | 5,193 | 70.1% | 11.9% | 10.6% | 1.3% |
| 34 | Knoxville | 195,185 | 5,297 | 70.5% | 15.6% | 7.7% | 1.6% |
| 35 | Oakland | 9,979 | 5,303 | 67.9% | 26.0% | 2.1% | 0.2% |
| 36 | Martin | 10,915 | 5,421 | 71.1% | 18.2% | 4.2% | 3.1% |
| 37 | Cleveland | 48,829 | 5,606 | 73.5% | 7.0% | 11.4% | 2.3% |
| 38 | Franklin | 87,133 | 5,701 | 74.4% | 5.3% | 8.1% | 8.2% |
| 39 | Mount Juliet | 42,073 | 5,811 | 75.3% | 7.3% | 7.4% | 4.9% |
| 40 | Henderson | 6,411 | 5,864 | 74.3% | 18.0% | 3.9% | 0.5% |
| 40 | Jonesborough | 6,232 | 5,865 | 75.5% | 4.3% | 9.6% | 3.5% |
| 42 | Lewisburg | 12,861 | 5,919 | 75.8% | 8.7% | 7.4% | 0.4% |
| 43 | Winchester | 9,799 | 5,999 | 76.2% | 10.6% | 8.3% | 1.8% |
| 44 | Paris | 10,338 | 6,015 | 75.6% | 16.2% | 2.9% | 0.4% |
| 45 | Athens | 14,471 | 6,070 | 76.9% | 6.4% | 7.7% | 1.2% |
| 45 | McKenzie | 5,631 | 6,071 | 75.8% | 17.8% | 3.1% | 1.9% |
| 47 | Smithville | 5,288 | 6,124 | 76.0% | 2.0% | 18.2% | 2.6% |
| 48 | Arlington | 15,205 | 6,131 | 77.0% | 13.1% | 2.7% | 2.7% |
| 49 | McMinnville | 13,844 | 6,193 | 77.3% | 4.2% | 13.9% | 1.0% |
| 50 | Millersville | 5,836 | 6,203 | 78.0% | 7.5% | 6.5% | 1.5% |
| 51 | Atoka | 10,385 | 6,257 | 78.0% | 11.8% | 3.1% | 1.4% |
| 52 | Cookeville | 36,088 | 6,290 | 78.2% | 3.4% | 12.0% | 1.9% |
| 53 | Hendersonville | 63,091 | 6,321 | 78.6% | 9.1% | 7.2% | 2.2% |
| 54 | Manchester | 12,944 | 6,337 | 78.7% | 5.9% | 9.4% | 2.8% |
| 55 | Lenoir City | 11,110 | 6,372 | 78.2% | 1.2% | 15.8% | 1.4% |
| 56 | Dickson | 16,424 | 6,382 | 79.0% | 6.1% | 9.2% | 0.2% |
| 57 | Oak Ridge | 32,693 | 6,402 | 79.3% | 5.8% | 6.8% | 2.6% |
| 58 | Hartsville/Trousdale County | 11,957 | 6,418 | 79.1% | 11.0% | 4.1% | 0.1% |
| 59 | Brentwood | 45,556 | 6,530 | 80.1% | 4.6% | 3.1% | 8.0% |
| 60 | Red Bank | 12,010 | 6,586 | 80.4% | 6.1% | 7.7% | 1.7% |
| 61 | Harriman | 6,090 | 6,638 | 80.3% | 11.3% | 0.9% | 0.1% |
| 62 | Johnson City | 72,222 | 6,784 | 81.8% | 5.8% | 5.4% | 2.0% |
| 63 | Lexington | 7,962 | 6,803 | 81.4% | 12.5% | 1.3% | 0.5% |
| 64 | Nolensville | 15,074 | 6,810 | 82.1% | 2.8% | 4.3% | 3.7% |
| 65 | Savannah | 7,412 | 6,812 | 81.8% | 8.6% | 5.4% | 0.0% |
| 66 | Spring Hill | 55,765 | 6,833 | 82.1% | 3.8% | 8.2% | 2.2% |
| 67 | Sweetwater | 6,532 | 6,841 | 82.1% | 5.1% | 6.9% | 0.0% |
| 68 | Dayton | 7,625 | 6,861 | 81.8% | 3.1% | 12.2% | 1.0% |
| 69 | Fairview | 10,009 | 6,880 | 81.5% | 0.6% | 15.0% | 0.1% |
| 70 | Germantown | 40,673 | 6,972 | 83.1% | 4.4% | 3.0% | 6.3% |
| 71 | Ashland City | 5,424 | 7,027 | 83.2% | 3.8% | 9.1% | 0.2% |
| 72 | Newport | 6,881 | 7,040 | 83.4% | 6.3% | 4.8% | 2.0% |
| 73 | Madisonville | 5,241 | 7,062 | 83.4% | 3.2% | 3.9% | 0.0% |
| 74 | Lafayette | 5,727 | 7,071 | 83.0% | 1.5% | 13.5% | 0.0% |
| 75 | Medina | 5,407 | 7,170 | 84.2% | 2.0% | 5.8% | 0.3% |
| 76 | Tullahoma | 21,103 | 7,251 | 84.7% | 6.4% | 5.1% | 0.8% |
| 77 | Dunlap | 5,678 | 7,291 | 84.7% | 1.3% | 10.3% | 0.0% |
| 78 | White House | 14,631 | 7,296 | 85.0% | 1.9% | 5.6% | 1.0% |
| 79 | Greeneville | 15,646 | 7,316 | 85.1% | 2.4% | 5.6% | 0.4% |
| 80 | Munford | 6,588 | 7,362 | 85.5% | 2.7% | 4.0% | 1.6% |
| 81 | Thompson’s Station | 8,294 | 7,408 | 85.7% | 0.2% | 4.3% | 6.1% |
| 82 | Maryville | 32,392 | 7,532 | 86.5% | 2.9% | 5.3% | 1.9% |
| 83 | Lawrenceburg | 11,844 | 7,555 | 86.6% | 4.8% | 3.1% | 0.0% |
| 84 | Crossville | 12,428 | 7,758 | 87.7% | 2.5% | 7.3% | 0.1% |
| 85 | Jefferson City | 8,579 | 7,847 | 88.3% | 2.8% | 6.5% | 0.5% |
| 86 | Farragut | 24,634 | 7,902 | 88.7% | 1.0% | 2.4% | 4.5% |
| 87 | Pleasant View | 5,276 | 7,928 | 88.8% | 0.3% | 3.9% | 3.2% |
| 88 | Kingsport | 56,262 | 7,985 | 89.2% | 2.7% | 3.7% | 1.0% |
| 89 | Bristol | 27,636 | 8,050 | 89.5% | 3.1% | 3.3% | 0.3% |
| 90 | Elizabethton | 14,374 | 8,053 | 89.6% | 4.0% | 2.4% | 0.4% |
| 91 | Clinton | 10,239 | 8,067 | 89.6% | 1.9% | 3.0% | 0.5% |
| 92 | Portland | 13,449 | 8,164 | 90.2% | 2.4% | 4.5% | 0.2% |
| 93 | Erwin | 5,988 | 8,175 | 90.0% | 0.5% | 8.7% | 0.0% |
| 94 | Rockwood | 5,566 | 8,193 | 90.3% | 1.0% | 4.1% | 0.1% |
| 95 | Kingston | 6,224 | 8,220 | 90.5% | 3.7% | 1.5% | 1.7% |
| 96 | La Follette | 7,273 | 8,510 | 92.1% | 0.8% | 3.8% | 0.2% |
| 97 | Soddy-Daisy | 13,231 | 8,606 | 92.6% | 0.9% | 1.7% | 0.0% |
| 98 | Signal Mountain | 8,860 | 8,637 | 92.8% | 0.6% | 1.2% | 1.2% |
| 99 | Greenbrier | 6,971 | 8,729 | 93.3% | 2.4% | 2.9% | 0.2% |
| 100 | Church Hill | 7,139 | 9,319 | 96.5% | 0.2% | 1.1% | 0.1% |
Source: U.S. Census ACS 2020-2024. 101 cities with more than 5,000 residents.
Summary
Summary: Diversity Across Tennessee
If you’re looking for a scientific breakdown of diversity across Tennessee, this is an accurate list.
The most diverse cities in Tennessee are La Vergne, Springfield, Smyrna, Clarksville, Millington, Humboldt, Goodlettsville, Shelbyville, Chattanooga, and Jackson.


