
Before you decide to relocate to Massachusetts, it’s important to research the exact cost of living around the state. And that’s what we’re going to help you do.
These are the places in Massachusetts that cost a pretty penny — the most expensive cities in the state.
We used Saturday Night Science to compare the 2020-2024 American Community Survey on cost of living for the 48 places in Massachusetts with more than 12,000 people.
After we saved up for months and could finally afford it, we landed on this list of the ten most expensive cities in Massachusetts for 2026.
Table Of Contents: Top Ten | Methodology | Summary | Table
The 10 Most Expensive Places To Live In Massachusetts For 2026
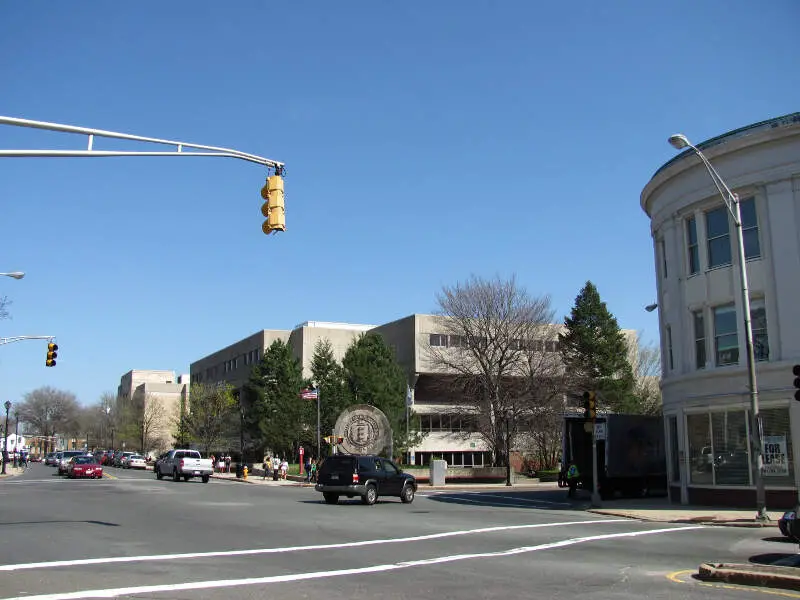
What’s the most expensive place to live in Massachusetts? Well, HomeSnacks crunched the numbers and discovered that Newton is the most expensive place to live in Massachusetts.
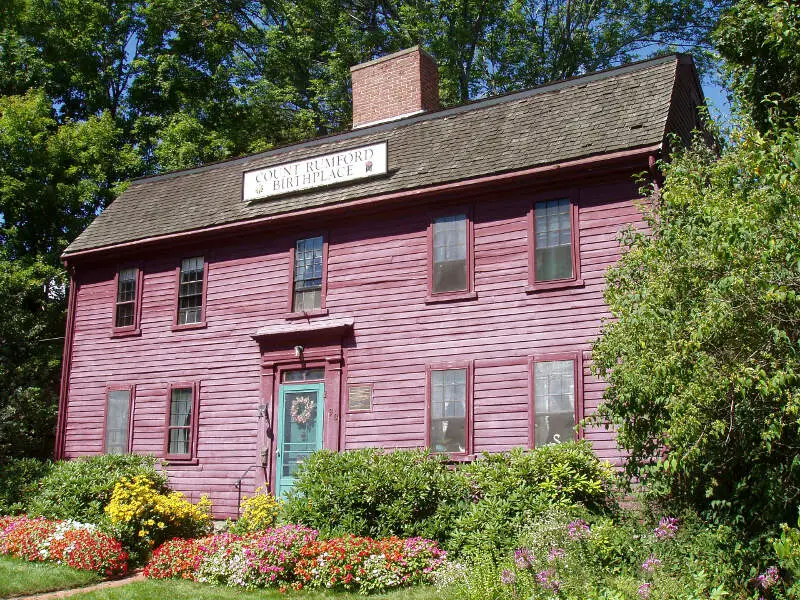
North Adams (the cheapest place to live in Massachusetts) can show these guys how to live on a budget in the coming years. Read on for how these places had costs rise faster than inflation.
And if you already knew these places were expensive, check out some more reading about Massachusetts and the most expensive cities in the country:
The 10 Most Expensive Places To Live In Massachusetts For 2026

/10
Population: 89,044
Cost Of Living Index: 205
Median Income: $190,304
Average Home Price: $1,528,893
Home Price To Income Ratio: 8.0x
More on Newton: Data | Crime | Cost Of Living | Movers
The overall cost of living in Newton is 205. The median income in Newton comes in at $190,304 and the average home value is $1,528,893 for 2026.

/10
Population: 118,796
Cost Of Living Index: 204
Median Income: $130,748
Average Home Price: $1,041,569
Home Price To Income Ratio: 8.0x
More on Cambridge: Data | Crime | Cost Of Living | Movers
The overall cost of living in Cambridge is 204. The median income in Cambridge comes in at $130,748 and the average home value is $1,041,569 for 2026.

/10
Population: 81,036
Cost Of Living Index: 186
Median Income: $132,572
Average Home Price: $940,239
Home Price To Income Ratio: 7.1x
More on Somerville: Data | Crime | Cost Of Living | Movers
The overall cost of living in Somerville is 186. The median income in Somerville comes in at $132,572 and the average home value is $940,239 for 2026.

/10
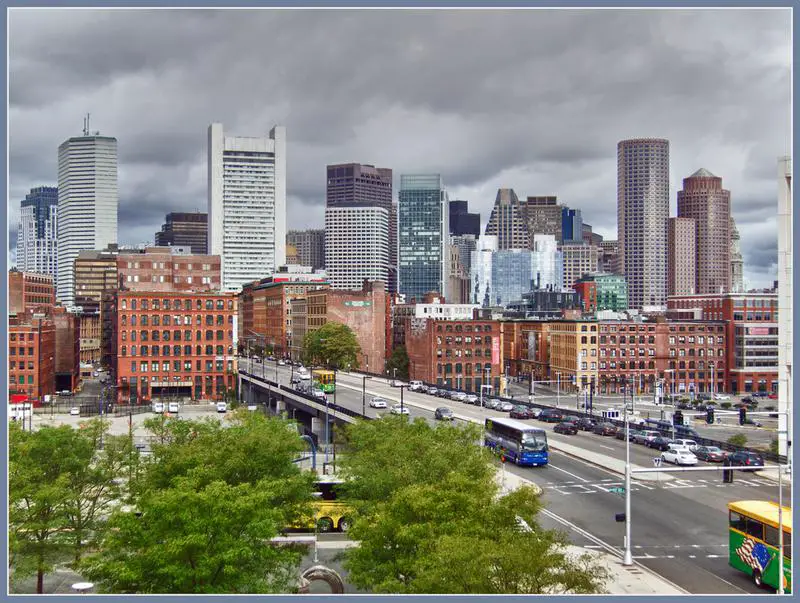
Population: 666,442
Cost Of Living Index: 171
Median Income: $97,344
Average Home Price: $798,216
Home Price To Income Ratio: 8.2x
More on Boston: Data | Crime | Cost Of Living | Movers
The overall cost of living in Boston is 171. The median income in Boston comes in at $97,344 and the average home value is $798,216 for 2026.

/10
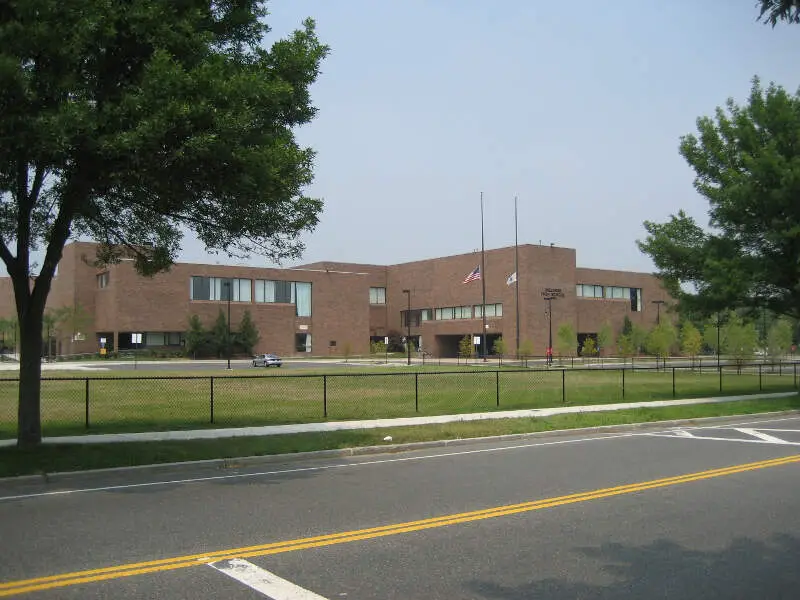
Population: 29,650
Cost Of Living Index: 167
Median Income: $133,953
Average Home Price: $908,130
Home Price To Income Ratio: 6.8x
More on Melrose: Data | Crime | Cost Of Living | Movers
The overall cost of living in Melrose is 167. The median income in Melrose comes in at $133,953 and the average home value is $908,130 for 2026.

/10
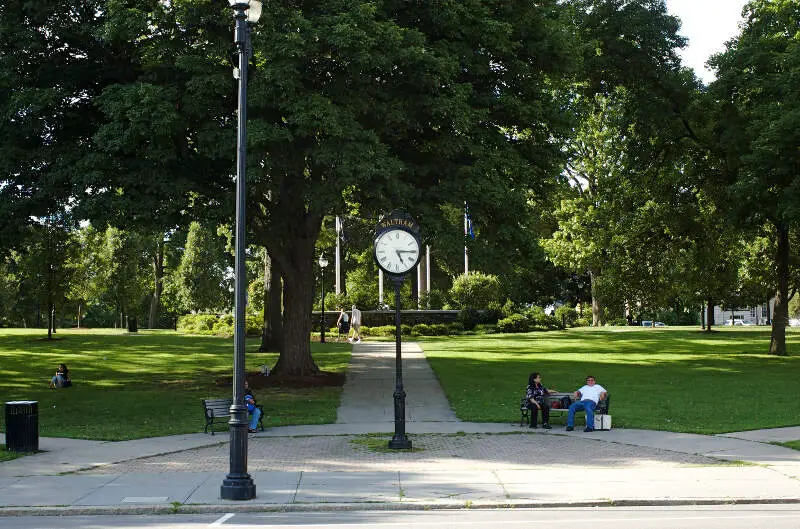
Population: 64,902
Cost Of Living Index: 163
Median Income: $120,216
Average Home Price: $826,437
Home Price To Income Ratio: 6.9x
More on Waltham: Data | Crime | Cost Of Living | Movers
The overall cost of living in Waltham is 163. The median income in Waltham comes in at $120,216 and the average home value is $826,437 for 2026.

/10
Population: 59,354
Cost Of Living Index: 162
Median Income: $129,540
Average Home Price: $842,297
Home Price To Income Ratio: 6.5x
More on Medford: Data | Crime | Cost Of Living | Movers
The overall cost of living in Medford is 162. The median income in Medford comes in at $129,540 and the average home value is $842,297 for 2026.

/10
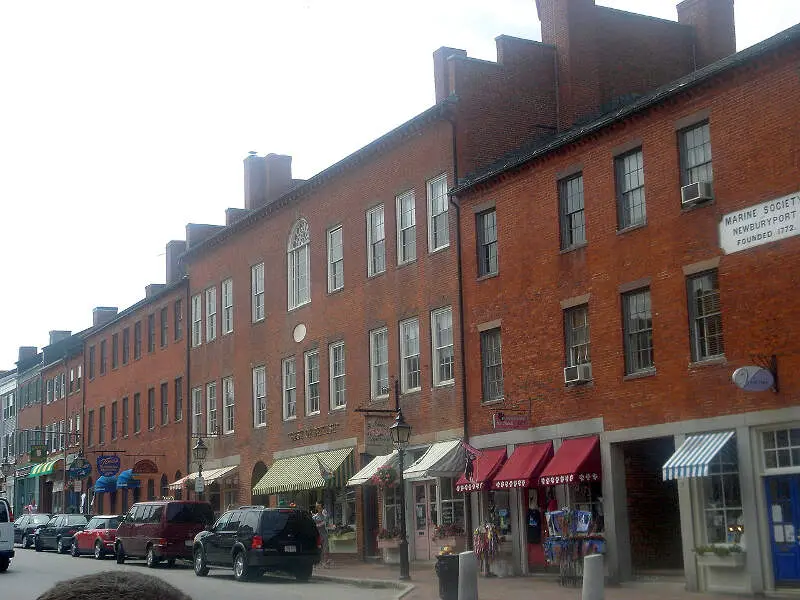
Population: 18,652
Cost Of Living Index: 162
Median Income: $139,625
Average Home Price: $923,542
Home Price To Income Ratio: 6.6x
More on Newburyport: Data | Crime | Cost Of Living | Movers
The overall cost of living in Newburyport is 162. The median income in Newburyport comes in at $139,625 and the average home value is $923,542 for 2026.

/10
Population: 41,939
Cost Of Living Index: 153
Median Income: $111,185
Average Home Price: $758,602
Home Price To Income Ratio: 6.8x
More on Woburn: Data | Crime | Cost Of Living | Movers
The overall cost of living in Woburn is 153. The median income in Woburn comes in at $111,185 and the average home value is $758,602 for 2026.

/10
Population: 65,906
Cost Of Living Index: 150
Median Income: $100,606
Average Home Price: $684,055
Home Price To Income Ratio: 6.8x
More on Malden: Data | Crime | Cost Of Living | Movers
The overall cost of living in Malden is 150. The median income in Malden comes in at $100,606 and the average home value is $684,055 for 2026.
Methodology: How We Determined The Most Expensive Places To Live In The Bay State For 2026
The two most important things to think about when it comes to being able to afford a city in Massachusetts are:
- How much money do I make?
- How much do I have to spend to live there?
You need to understand your costs in the context of how much money you make.
For example, if the median household earns $100,000 and spends $40,000 on housing, it’s actually cheaper to live there than a place with a median income of $50,000 and housing costs of $21,000. You might spend more on housing, but you have more money overall to play with.
With that example in mind, we derived several statistics from the latest Census American Community Survey 2020-2024 around incomes and costs. They are:
- Overall Cost Of Living Index
- Median Home Price / Median Income (lower is better)
- Median Income / Median Rent (Higher is better)
- Median Home Price
You can then compare these metrics in each of the places in Massachusetts to figure out which is the most expensive.
You are left with a “Cost of Living Index” by taking the average rank of each of these metrics for each city.
So we used that cost of living index to rank all of the 48 places in Massachusetts that have more than 12,000 people.
The place with the highest cost of living in Massachusetts according to the data is Newton. We updated this article for 2026. This article is our eleventh time ranking the most expensive places to live in Massachusetts.
Summary: Taking A Chunk Out Of Your Paycheck In Massachusetts For 2026
Well, there you have it, the places in Massachusetts that have the highest cost of living, with Newton ranking as the most expensive city in the Bay State.
The most expensive cities in Massachusetts are Newton, Cambridge, Somerville, Boston, Melrose, Waltham, Medford, Newburyport, Woburn, and Malden.
Here’s a look at the most affordable cities in Massachusetts according to the data:
- North Adams
- Pittsfield
- Gardner
For more Massachusetts reading, check out:
- Best Places To Live In Massachusetts
- Cheapest Places To Live In Massachusetts
- Most Dangerous Cities In Massachusetts
- Best Places To Raise A Family In Massachusetts
- Safest Places In Massachusetts
- Worst Places To Live In Massachusetts
Most Expensive Cities In Massachusetts
| Rank | City | Cost Of Living | Population | Median Income | Average Home Price | Home/Income Ratio |
|---|---|---|---|---|---|---|
| 1 | Newton | 205 | 89,044 | $190,304 | $1,528,893 | 8.0x |
| 2 | Cambridge | 204 | 118,796 | $130,748 | $1,041,569 | 8.0x |
| 3 | Somerville | 186 | 81,036 | $132,572 | $940,239 | 7.1x |
| 4 | Boston | 171 | 666,442 | $97,344 | $798,216 | 8.2x |
| 5 | Melrose | 167 | 29,650 | $133,953 | $908,130 | 6.8x |
| 6 | Waltham | 163 | 64,902 | $120,216 | $826,437 | 6.9x |
| 7 | Medford | 162 | 59,354 | $129,540 | $842,297 | 6.5x |
| 8 | Newburyport | 162 | 18,652 | $139,625 | $923,542 | 6.6x |
| 9 | Woburn | 153 | 41,939 | $111,185 | $758,602 | 6.8x |
| 10 | Malden | 150 | 65,906 | $100,606 | $684,055 | 6.8x |
| 11 | Braintree Town | 150 | 38,899 | $122,214 | $767,326 | 6.3x |
| 12 | Winthrop Town | 150 | 18,759 | $116,167 | $758,914 | 6.5x |
| 13 | Quincy | 149 | 102,114 | $98,882 | $675,958 | 6.8x |
| 14 | Beverly | 148 | 42,665 | $106,044 | $755,766 | 7.1x |
| 15 | Everett | 146 | 50,045 | $85,218 | $639,069 | 7.5x |
| 16 | Franklin Town | 145 | 33,154 | $145,773 | $714,637 | 4.9x |
| 17 | Peabody | 142 | 54,695 | $96,657 | $694,094 | 7.2x |
| 18 | Barnstable Town | 141 | 49,568 | $91,982 | $703,888 | 7.7x |
| 19 | Gloucester | 140 | 30,075 | $83,883 | $760,558 | 9.1x |
| 20 | Revere | 138 | 60,012 | $86,969 | $612,970 | 7.0x |
| 21 | Marlborough | 138 | 41,647 | $91,968 | $578,933 | 6.3x |
| 22 | Weymouth Town | 137 | 58,505 | $102,714 | $645,007 | 6.3x |
| 23 | Lynn | 136 | 101,709 | $75,043 | $580,315 | 7.7x |
| 24 | Salem | 135 | 44,795 | $85,153 | $606,558 | 7.1x |
| 25 | Chelsea | 134 | 39,908 | $72,179 | $526,190 | 7.3x |
| 26 | Northampton | 130 | 30,962 | $80,288 | $486,075 | 6.1x |
| 27 | Lowell | 127 | 118,368 | $78,658 | $480,318 | 6.1x |
| 28 | Brockton | 127 | 105,386 | $80,115 | $503,832 | 6.3x |
| 29 | Lawrence | 127 | 88,736 | $60,433 | $504,150 | 8.3x |
| 30 | Haverhill | 127 | 67,698 | $88,326 | $543,991 | 6.2x |
| 31 | Attleboro | 127 | 46,762 | $98,954 | $532,570 | 5.4x |
| 32 | Taunton | 124 | 60,433 | $79,283 | $513,321 | 6.5x |
| 33 | Fall River | 121 | 94,082 | $56,673 | $445,781 | 7.9x |
| 34 | Agawam Town | 120 | 28,539 | $85,421 | $364,036 | 4.3x |
| 35 | Worcester | 119 | 207,055 | $70,102 | $430,111 | 6.1x |
| 36 | Southbridge Town | 118 | 17,928 | $66,287 | $344,409 | 5.2x |
| 37 | New Bedford | 117 | 100,998 | $56,981 | $434,261 | 7.6x |
| 38 | Leominster | 117 | 43,909 | $83,816 | $463,493 | 5.5x |
| 39 | West Springfield Town | 116 | 28,772 | $69,371 | $375,602 | 5.4x |
| 40 | Westfield | 115 | 40,378 | $87,753 | $378,737 | 4.3x |
| 41 | Palmer Town | 115 | 12,381 | $78,480 | $317,071 | 4.0x |
| 42 | Fitchburg | 113 | 41,798 | $73,040 | $396,820 | 5.4x |
| 43 | Holyoke | 112 | 37,813 | $53,605 | $322,895 | 6.0x |
| 44 | Springfield | 111 | 154,749 | $52,656 | $294,613 | 5.6x |
| 45 | Chicopee | 109 | 55,295 | $62,615 | $311,122 | 5.0x |
| 46 | Gardner | 109 | 21,148 | $67,518 | $369,177 | 5.5x |
| 47 | Pittsfield | 108 | 43,457 | $70,582 | $302,830 | 4.3x |
| 48 | North Adams | 104 | 12,606 | $47,500 | $252,588 | 5.3x |