Before you decide to relocate to Montana, it’s important to research the exact cost of living around the state. And that’s what we’re going to help you do.
These are the places in Montana that cost a pretty penny — the most expensive cities in the state.
We used Saturday Night Science to compare the 2020-2024 American Community Survey on cost of living for the 18 places in Montana with more than 5,000 people.
After we saved up for months and could finally afford it, we landed on this list of the ten most expensive cities in Montana for 2026.
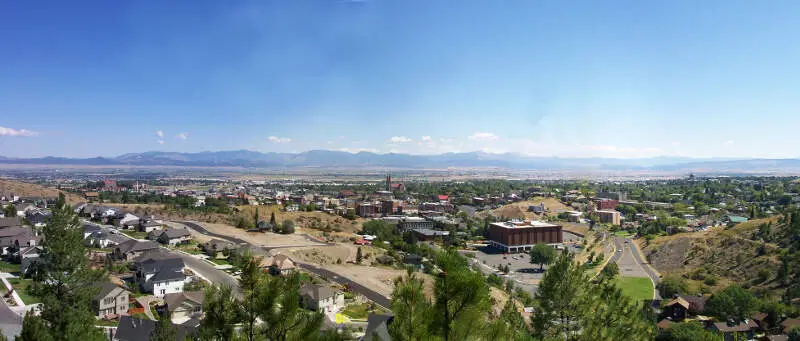
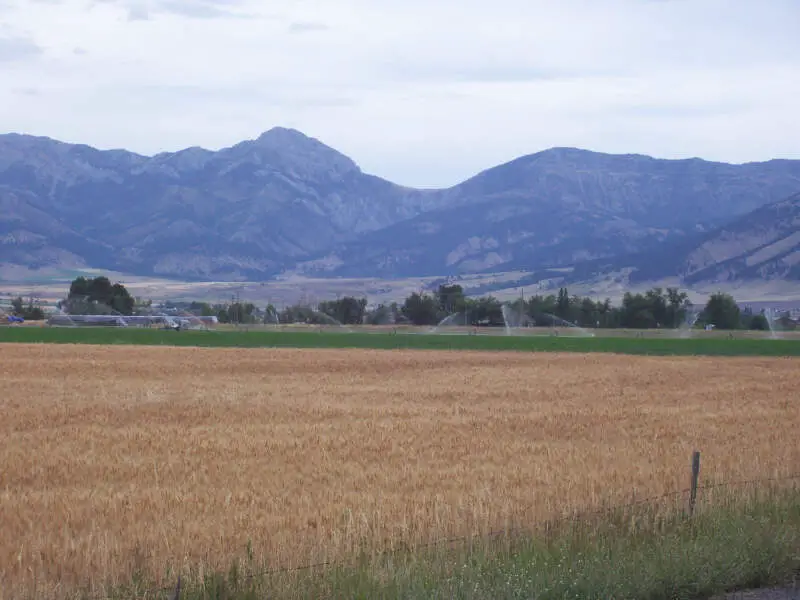
$85,747 median income · $724,089 median home · #2 home prices in Montana
Bozeman is a city in and the seat of Gallatin County, Montana, United States. Located in southwest Montana, the 2010 census put Bozeman’s population at 37,280 and by 2016 the population rose to 45,250, making it the fourth largest city in Montana. It is the principal city of the Bozeman, MT Micropolitan Statistical Area, consisting of all of Gallatin County with a population of 97,304. It is the largest Micropolitan Statistical Area in Montana and is the third largest of all of Montana-s statistical areas.
Data | Crime | Cost of living | Movers
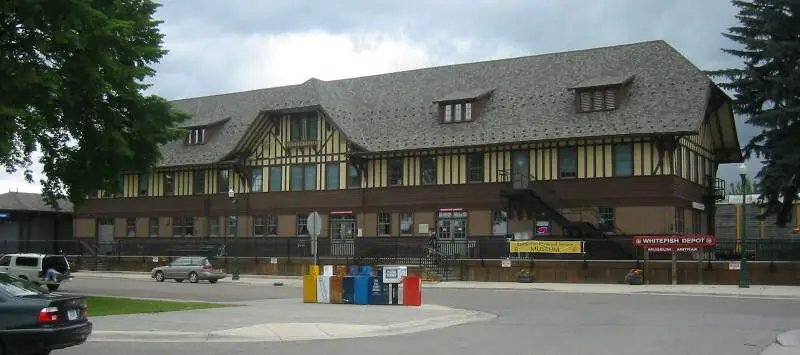
$73,811 median income · $864,157 median home · #1 home prices in Montana
Whitefish is a city in Flathead County, Montana, United States. The population was 6,357 at the 2010 census. It is home to a ski resort on Big Mountain called Whitefish Mountain Resort.
Data | Crime | Cost of living | Movers
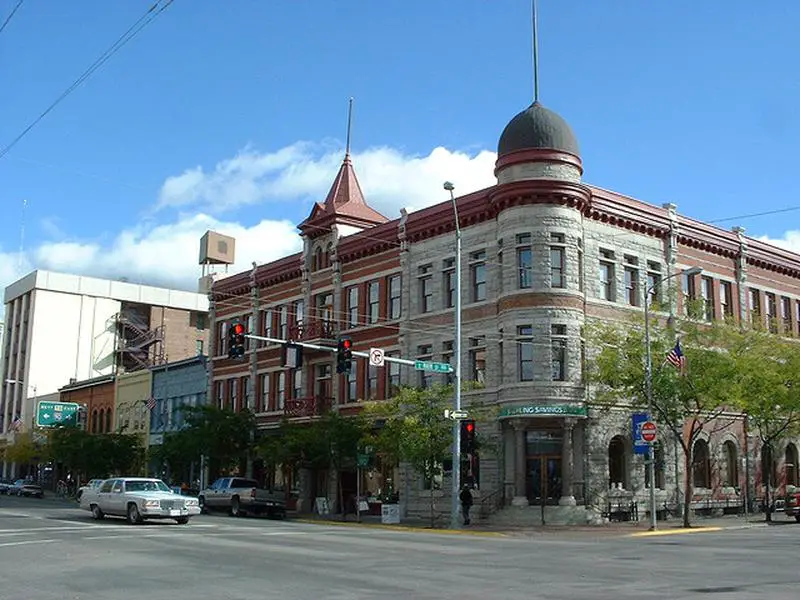
$70,392 median income · $564,622 median home · #4 home prices in Montana
Missoula is a city in the U.S. state of Montana and is the county seat of Missoula County. It is located along the Clark Fork River near its confluences with the Bitterroot and Blackfoot Rivers in western Montana and at the convergence of five mountain ranges, thus is often described as the “hub of five valleys”. In 2016, the United States Census Bureau estimated the city’s population at 72,364 and the population of the Missoula Metropolitan Area at 116,130. In the 1990s, Missoula overtook GreatFalls as Montana-s secondlargest city, behind Billings. Missoula is home to the University of Montana, a public research university.
Data | Crime | Cost of living | Movers
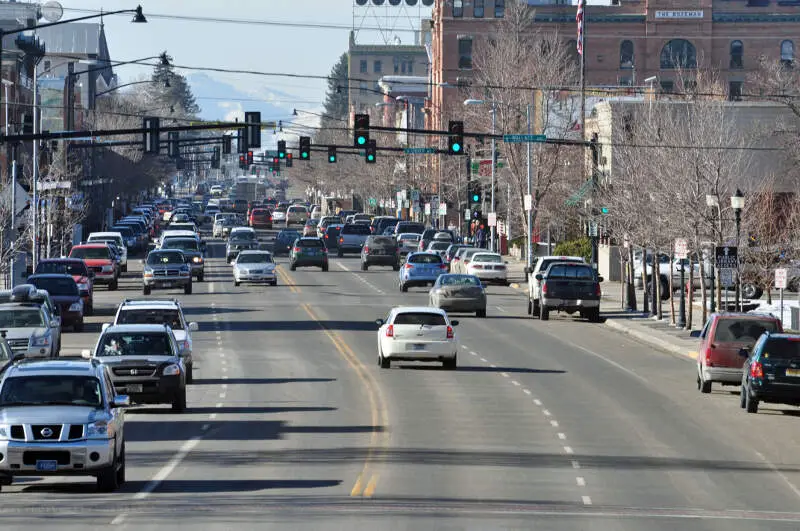
$71,036 median income · $474,029 median home · #10 home prices in Montana
Helena is the state capital of the U.S. state of Montana and the county seat of Lewis and Clark County.
Data | Crime | Cost of living | Movers
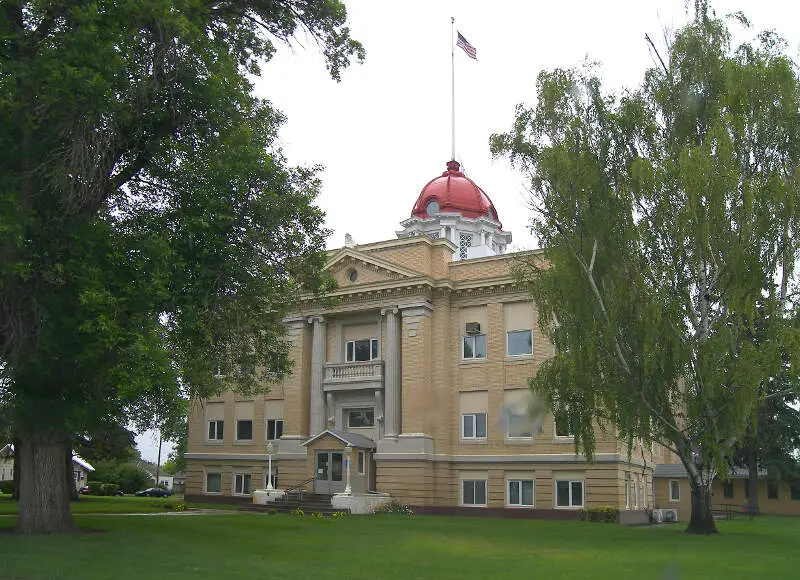
$97,328 median income · $548,236 median home · #7 home prices in Montana
Data | Crime | Cost of living | Movers
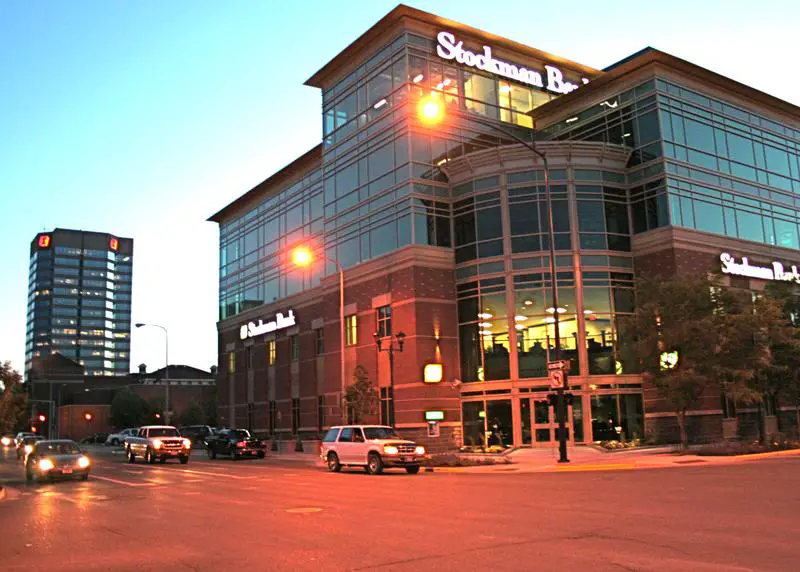
$73,712 median income · $392,209 median home · #11 home prices in Montana
Billings is the largest city in the state of Montana, and the principal city of the Billings Metropolitan Area with a population of 166,855. It has a trade area of over half a million people.
Data | Crime | Cost of living | Movers
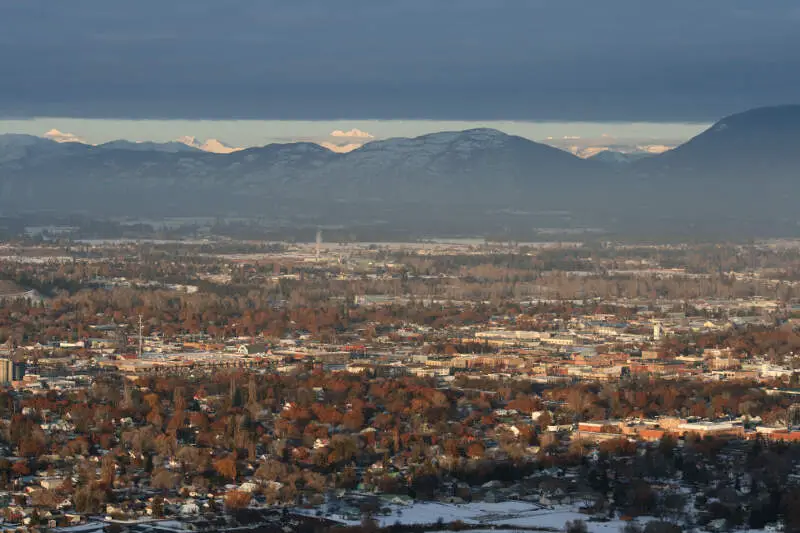
$63,415 median income · $552,745 median home · #6 home prices in Montana
Kalispell is a city in, and the county seat of Flathead County, Montana, United States. The 2015 Census estimates put Kalispell’s population at 22,052. The Kalispell Micropolitan Statistical Area has a population of 93,068 and it is the largest city and commercial center of northwest Montana. The name Kalispell is a Salish word meaning “flat land above the lake”. Kalispell is also the gateway to Glacier National Park.
Data | Crime | Cost of living | Movers
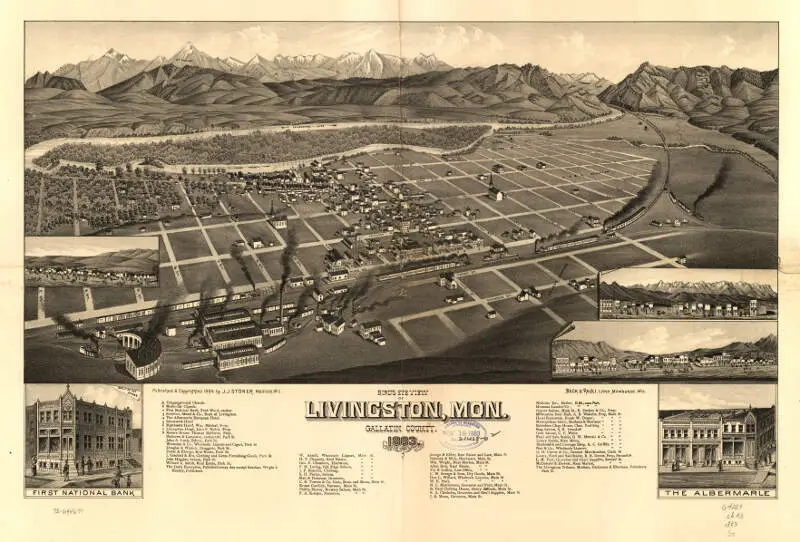
$65,861 median income · $531,831 median home · #8 home prices in Montana
Livingston is a city and the county seat of Park County, Montana, United States. Livingston is located in southwestern Montana, on the Yellowstone River, north of Yellowstone National Park. The population was 7,044 at the 2010 census.
Data | Crime | Cost of living | Movers
$62,538 median income · $269,780 median home · #16 home prices in Montana
Sidney is a city in and the county seat of Richland County, Montana, United States, less than 10mi away from the North Dakota border. The population was 5,191 at the 2010 census. The city lies along the Yellowstone River and is in proximity to the badlands of the Dakotas. Sidney is approximately midway between Glendive, Montana and Williston, North Dakota.
Data | Crime | Cost of living | Movers
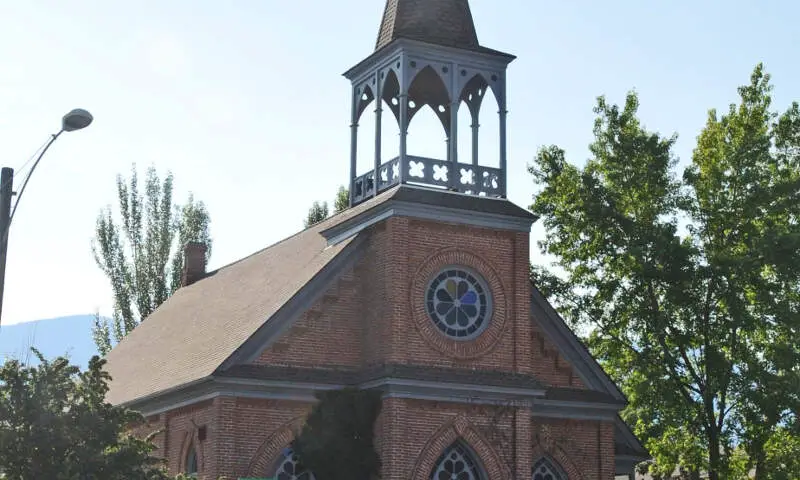
$75,766 median income · $599,165 median home · #3 home prices in Montana
Columbia Falls is a city in Flathead County, Montana, United States. The population was 4,710 at the 2010 census
Data | Crime | Cost of living | Movers
The receipts
Compare the top ten
Pick a metric. The bars rescale. The red line is Montana’s statewide median.
Montana statewide median: $466,917
Montana statewide median: $72,509
On the map
Mapping the most expensive places in Montana
Saturday Night Science
Methodology: How We Determined The Most Expensive Places To Live In The Treasure State For 2026
The two most important things to think about when it comes to being able to afford a city in Montana are how much money you make and how much you have to spend to live there.
You need to understand your costs in the context of how much money you make.
For example, if the median household earns $100,000 and spends $40,000 on housing, it’s actually cheaper to live there than a place with a median income of $50,000 and housing costs of $21,000. You might spend more on housing, but you have more money overall to play with.
With that example in mind, we derived several statistics from the latest Census American Community Survey 2020-2024 around incomes and costs. They are:
- Overall Cost Of Living Index
- Median Home Price / Median Income (lower is better)
- Median Income / Median Rent (Higher is better)
- Median Home Price
You can then compare these metrics in each of the places in Montana to figure out which is the most expensive.
You are left with a “Cost of Living Index” by taking the average rank of each of these metrics for each city.
So we used that cost of living index to rank all of the 18 places in Montana that have more than 5,000 people.
The place with the highest cost of living in Montana according to the data is Bozeman. We updated this article for 2026. This article is our eleventh time ranking the most expensive places to live in Montana. The median Montana home is 43 years old — old enough that it pays to compare home warranty plans before something expensive breaks.
The full plate
Most Expensive Cities In Montana
Click any column to sort. Search by city name.
| Rank | City | Cost Of Living | Population | Median Income | Average Home Price | Home/Income Ratio |
|---|---|---|---|---|---|---|
| 1 | Bozeman | 130 | 56,114 | $85,747 | $724,089 | 8.4x |
| 2 | Whitefish | 127 | 8,749 | $73,811 | $864,157 | 11.7x |
| 3 | Missoula | 115 | 76,514 | $70,392 | $564,622 | 8.0x |
| 4 | Helena | 111 | 33,639 | $71,036 | $474,029 | 6.7x |
| 5 | Belgrade | 110 | 11,872 | $97,328 | $548,236 | 5.6x |
| 6 | Billings | 107 | 119,434 | $73,712 | $392,209 | 5.3x |
| 7 | Kalispell | 107 | 28,504 | $63,415 | $552,745 | 8.7x |
| 8 | Livingston | 106 | 8,780 | $65,861 | $531,831 | 8.1x |
| 9 | Sidney | 102 | 6,171 | $62,538 | $269,780 | 4.3x |
| 10 | Columbia Falls | 102 | 5,615 | $75,766 | $599,165 | 7.9x |
| 11 | Hamilton | 101 | 5,101 | $49,204 | $526,562 | 10.7x |
| 12 | Miles City | 100 | 8,407 | $67,727 | $243,450 | 3.6x |
| 13 | Havre | 99 | 9,258 | $50,329 | $232,554 | 4.6x |
| 14 | Polson | 99 | 5,428 | $53,418 | $560,671 | 10.5x |
| 15 | Great Falls | 98 | 60,329 | $63,373 | $334,708 | 5.3x |
| 16 | Laurel | 97 | 7,215 | $68,474 | $374,157 | 5.5x |
| 17 | Anaconda-Deer Lodge County | 89 | 9,597 | $57,527 | $287,878 | 5.0x |
| 18 | Lewistown | 89 | 6,087 | $48,750 | $296,569 | 6.1x |
Source: U.S. Census ACS 2020-2024, Zillow research. 18 places with more than 5,000 residents.
Summary
Summary: Taking A Chunk Out Of Your Paycheck In Montana For 2026
Well, there you have it, the places in Montana that have the highest cost of living, with Bozeman ranking as the most expensive city in the Treasure State.
The most expensive cities in Montana are Bozeman, Whitefish, Missoula, Helena, Belgrade, Billings, Kalispell, Livingston, Sidney, and Columbia Falls. Not sold on Montana? Take the two-minute Find Your Place quiz and see which state actually fits you.


