Most Hispanic/Latino cities in California research summary. We used Saturday Night Science to analyze California’s most recent Census data to determine the most Hispanic/Latino cities based on the percentage of Hispanic/Latino residents.
99.3% Hispanic · #1 most Hispanic in California
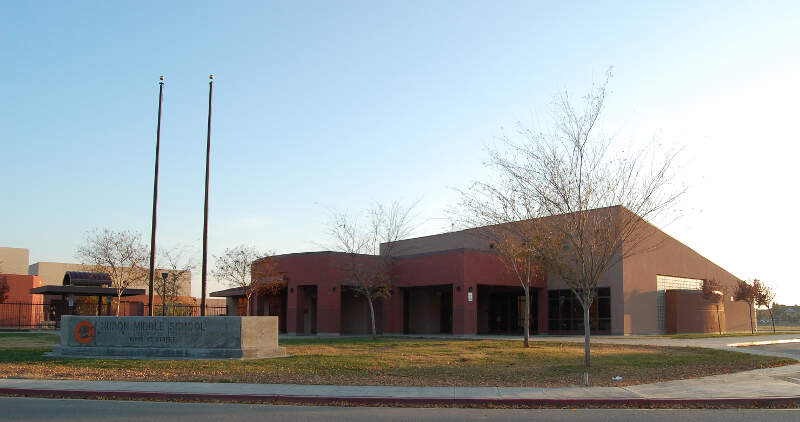
Huron is a small city in Fresno County, California, in the United States. As of the 2010 census, the population was 6,754, up from 6,306 at the 2000 census. During the harvest season, the population swells to over 15,000 people due to the influx of migrant farm workers. Huron is located 15 miles east-northeast of Coalinga, at an elevation of 374 feet. Huron was the city with the highest proportion of Hispanic or Latino people in the United States, according to the 2000 United States Census.
Data | Crime | Cost of living | Movers
97.4% Hispanic · #2 most Hispanic in California
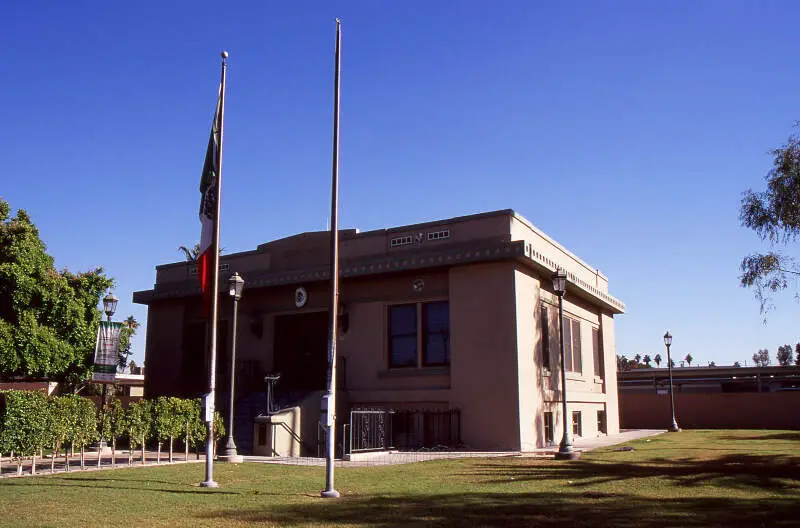
Calexico is a city in Imperial County, California. The population was 38,572 at the 2010 census, up from 27,109 at the 2000 census. Calexico is about 122 miles east of San Diego and 62 miles west of Yuma, Arizona. The name of the city is a portmanteau of California and Mexico, which, like that of its adjacent sister city of Mexicali, emphasizes its identity as a border city.
Data | Crime | Cost of living | Movers
97.2% Hispanic · #3 most Hispanic in California
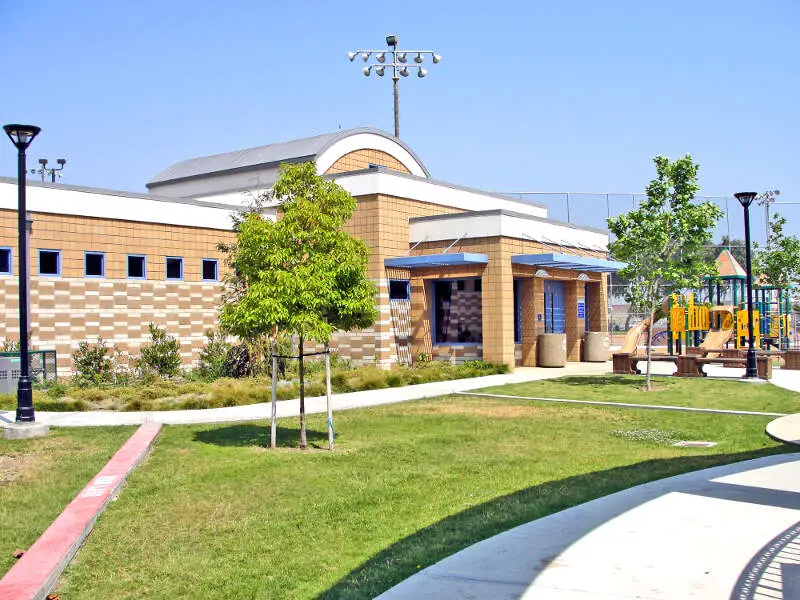
Maywood is a small city in southeast Los Angeles County, California. At 1.18 square miles, Maywood is the third-smallest incorporated city in Los Angeles County. It is bordered by the cities of Bell on the south, Vernon on the north and west, Huntington Park on the southwest, and Commerce on the east. It is the most densely-populated city in California, and has the highest proportion of Latinos, immigrants, and undocumented immigrants in the county.
Data | Crime | Cost of living | Movers
97.2% Hispanic · #4 most Hispanic in California
Orange Cove is a small city in Fresno County, California, United States. The population was 9,078 at the 2010 census, up from 7,722 at the 2000 census. Almost all of Orange Cove’s residents are Hispanic, many of them farmers, and about 1/3 of whom are not US Citizens from Latin America. Orange Cove is located in the San Joaquin Valley, 8 miles east-southeast of Reedley, at an elevation of 423 feet.
Data | Crime | Cost of living | Movers
97.1% Hispanic · #5 most Hispanic in California
Bell Gardens is a city in Los Angeles County, California. The population was 42,072 at the 2010 census, down from 44,054 at the 2000 census.
Data | Crime | Cost of living | Movers
97.1% Hispanic · #6 most Hispanic in California
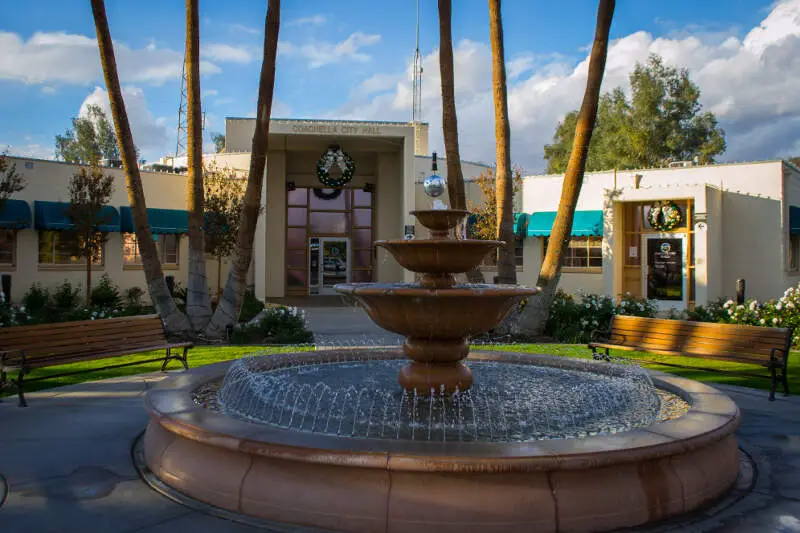
Coachella is a city in Riverside County, California; it is the easternmost city in the region collectively known as the Coachella Valley. It is located 28 miles east of Palm Springs, 72 miles east of Riverside, and 130 miles east of Los Angeles.
Data | Crime | Cost of living | Movers
97.1% Hispanic · #7 most Hispanic in California
Cudahy is a city located in southeastern Los Angeles County, California. In terms of area, Cudahy is the second smallest city in Los Angeles County, after Hawaiian Gardens, but with one of the highest population densities of any incorporated city in the United States. It is part of the Gateway Cities region. Cudahy is populated predominantly by Latino non-citizen immigrants and has a population of 23,805 as of the 2010 U.S. Census.
Data | Crime | Cost of living | Movers
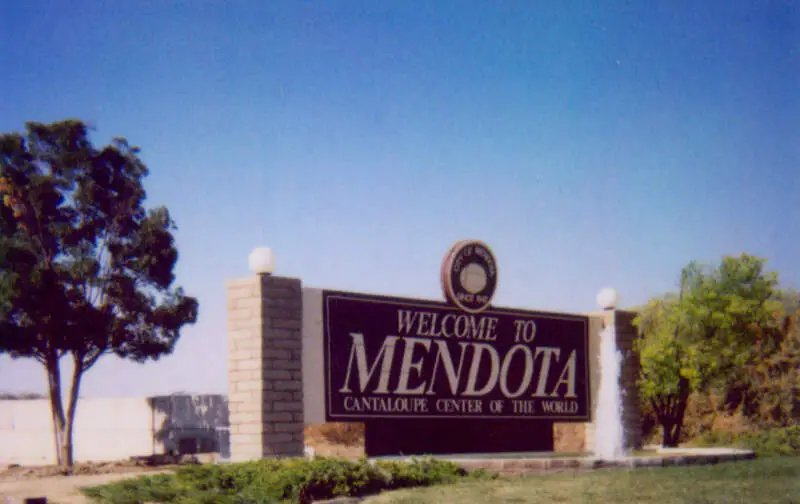
97.0% Hispanic · #8 most Hispanic in California
Mendota is a U.S. city in Fresno County, California. The population was 11,014 at the 2010 U.S. Census. The State Routes 180 and 33 run through the agricultural city. Mendota is located 8.5 miles south-southeast of Firebaugh, at an elevation of 174 feet.
Data | Crime | Cost of living | Movers
97.0% Hispanic · #9 most Hispanic in California
Commerce is a city located in southeast Los Angeles County, California, United States. The population was 12,823 at the 2010 census, up from 12,568 at the 2000 census. It is bordered by Vernon on the west, Los Angeles on the northwest, East Los Angeles on the north, Montebello on the east, Downey and Bell Gardens on the south, and Maywood on the southwest. The Los Angeles River forms part of its southwestern boundary, and the Rio Hondo separates it from Downey. Commerce is served by the Long Beach and Santa Ana freeways, as well as the Metrolink commuter rail service at the Commerce station. It is usually referred to as the “City of Commerce” to distinguish it from the common noun.
Data | Crime | Cost of living | Movers

96.7% Hispanic · #10 most Hispanic in California
Parlier is a city in Fresno County, California, United States. As of the 2010 census, the city had a total population of 14,494, up from 11,145 in 2000. The city has one of the state’s highest percentage of Latinos, a large majority of whom are seasonal migrant laborers who arrive and temporarily work in the area’s agricultural sector. Parlier is located 5.5 miles east-southeast of Selma, at an elevation of 344 feet.
Data | Crime | Cost of living | Movers
The receipts
Compare the top ten
Pick a metric. The bars rescale. The red line is California’s statewide median.
On the map
Where California’s Hispanic and Latino communities live
Saturday Night Science
Methodology: How We Determined The Cities In California With The Largest Hispanic Population For 2026
We used Saturday Night Science to compare data on race from the US Census for every city in California.
California’s most recently available data comes from the 2020-2024 American Community Survey.
Specifically, we looked at table B03002: Hispanic OR LATINO ORIGIN BY RACE. Here are the category names as defined by the Census:
- Hispanic or Latino
- White alone*
- Black or African American alone*
- American Indian and Alaska Native alone*
- Asian alone*
- Native Hawaiian and Other Pacific Islander alone*
- Some other race alone*
- Two or more races*
Our particular column of interest here was the number of people who identified as Hispanic or Latino.
We limited our analysis to places in California with a population greater than 5,000 people. That left us with 421 cities.
We then calculated the percentage of Hispanic or Latino residents in each California city. The percentages ranked from 99.3% to 2.8%.
Finally, we ranked each city based on the percentage of the Hispanic or Latino population, with a higher percentage being more Hispanic or Latino. Huron was the most Hispanic or Latino, while Saratoga was the least Hispanic or Latino city.
We updated this article for 2026. This article represents our eleventh time ranking the cities in California with the largest Hispanic/Latino population.
The full plate
Cities In California By Hispanic Population
Click any column to sort. Search by city name.
| Rank | City | Population | Hispanic Population | % Hispanic |
|---|---|---|---|---|
| 1 | Huron | 6,519 | 6,474 | 99.3% |
| 2 | Calexico | 38,585 | 37,573 | 97.4% |
| 3 | Maywood | 24,317 | 23,648 | 97.2% |
| 4 | Orange Cove | 9,695 | 9,425 | 97.2% |
| 5 | Bell Gardens | 38,229 | 37,135 | 97.1% |
| 6 | Coachella | 43,307 | 42,066 | 97.1% |
| 7 | Cudahy | 22,087 | 21,440 | 97.1% |
| 8 | Mendota | 12,577 | 12,198 | 97.0% |
| 9 | Commerce | 11,993 | 11,629 | 97.0% |
| 10 | Parlier | 14,507 | 14,029 | 96.7% |
| 11 | Huntington Park | 53,108 | 51,357 | 96.7% |
| 12 | Greenfield | 20,232 | 19,439 | 96.1% |
| 13 | Firebaugh | 8,392 | 8,039 | 95.8% |
| 14 | South Gate | 91,483 | 87,050 | 95.2% |
| 15 | Gonzales | 8,492 | 8,079 | 95.1% |
| 16 | Arvin | 19,539 | 18,486 | 94.6% |
| 17 | San Fernando | 23,632 | 21,846 | 92.4% |
| 18 | Pico Rivera | 60,272 | 54,329 | 90.1% |
| 19 | Guadalupe | 8,566 | 7,694 | 89.8% |
| 20 | Bell | 32,476 | 29,049 | 89.4% |
| 21 | Lindsay | 12,643 | 11,230 | 88.8% |
| 22 | Farmersville | 10,397 | 9,235 | 88.8% |
| 23 | Woodlake | 7,702 | 6,804 | 88.3% |
| 24 | King City | 13,604 | 12,017 | 88.3% |
| 25 | Lynwood | 64,578 | 56,651 | 87.7% |
| 26 | McFarland | 14,222 | 12,475 | 87.7% |
| 27 | Wasco | 26,558 | 23,206 | 87.4% |
| 28 | Dinuba | 25,475 | 22,255 | 87.4% |
| 29 | El Centro | 44,240 | 38,336 | 86.7% |
| 30 | Avenal | 13,608 | 11,784 | 86.6% |
| 31 | Holtville | 5,617 | 4,821 | 85.8% |
| 32 | Brawley | 27,283 | 23,351 | 85.6% |
| 33 | Imperial | 21,430 | 18,293 | 85.4% |
| 34 | Selma | 24,659 | 20,469 | 83.0% |
| 35 | Calipatria | 6,548 | 5,400 | 82.5% |
| 36 | Watsonville | 51,712 | 42,560 | 82.3% |
| 37 | Santa Paula | 31,376 | 25,625 | 81.7% |
| 38 | Paramount | 52,050 | 42,303 | 81.3% |
| 39 | Reedley | 25,609 | 20,797 | 81.2% |
| 40 | Madera | 67,831 | 55,024 | 81.1% |
| 41 | Salinas | 161,761 | 130,828 | 80.9% |
| 42 | Soledad | 26,365 | 21,273 | 80.7% |
| 43 | Shafter | 21,193 | 17,079 | 80.6% |
| 44 | La Puente | 37,142 | 29,814 | 80.3% |
| 45 | Santa Maria | 110,462 | 87,357 | 79.1% |
| 46 | Santa Fe Springs | 18,871 | 14,850 | 78.7% |
| 47 | Kerman | 16,815 | 13,160 | 78.3% |
| 48 | Sanger | 26,699 | 20,777 | 77.8% |
| 49 | Perris | 80,511 | 62,563 | 77.7% |
| 50 | Oxnard | 200,928 | 154,996 | 77.1% |
| 51 | Santa Ana | 312,534 | 239,503 | 76.6% |
| 52 | Montebello | 61,045 | 46,569 | 76.3% |
| 53 | Delano | 51,679 | 39,404 | 76.2% |
| 54 | Hawaiian Gardens | 13,691 | 10,351 | 75.6% |
| 55 | Downey | 110,939 | 83,493 | 75.3% |
| 56 | Colton | 53,772 | 40,430 | 75.2% |
| 57 | Rialto | 104,143 | 77,942 | 74.8% |
| 58 | South El Monte | 19,287 | 14,333 | 74.3% |
| 59 | Porterville | 63,157 | 46,506 | 73.6% |
| 60 | Los Banos | 47,593 | 34,940 | 73.4% |
| 61 | Compton | 92,698 | 67,618 | 72.9% |
| 62 | Baldwin Park | 70,138 | 51,148 | 72.9% |
| 63 | Montclair | 37,810 | 27,411 | 72.5% |
| 64 | Fowler | 7,094 | 5,115 | 72.1% |
| 65 | Pomona | 147,943 | 106,153 | 71.8% |
| 66 | Corcoran | 22,491 | 16,103 | 71.6% |
| 67 | Fillmore | 16,816 | 11,955 | 71.1% |
| 68 | Livingston | 14,606 | 10,367 | 71.0% |
| 69 | Norwalk | 99,789 | 70,256 | 70.4% |
| 70 | San Bernardino | 222,724 | 156,369 | 70.2% |
| 71 | Indio | 91,950 | 64,042 | 69.6% |
| 72 | Hollister | 43,811 | 30,372 | 69.3% |
| 73 | Ontario | 180,547 | 123,800 | 68.6% |
| 74 | Adelanto | 37,964 | 25,921 | 68.3% |
| 75 | Fontana | 214,169 | 144,733 | 67.6% |
| 76 | El Monte | 106,109 | 71,253 | 67.2% |
| 77 | Whittier | 86,165 | 57,840 | 67.1% |
| 78 | Patterson | 24,693 | 16,413 | 66.5% |
| 79 | Azusa | 49,031 | 32,067 | 65.4% |
| 80 | Ceres | 49,342 | 32,166 | 65.2% |
| 81 | Lawndale | 30,781 | 20,038 | 65.1% |
| 82 | Coalinga | 17,203 | 11,099 | 64.5% |
| 83 | San Jacinto | 55,180 | 35,523 | 64.4% |
| 84 | Tulare | 70,945 | 45,425 | 64.0% |
| 85 | Desert Hot Springs | 33,200 | 21,110 | 63.6% |
| 86 | Palmdale | 164,634 | 104,593 | 63.5% |
| 87 | National City | 58,893 | 37,393 | 63.5% |
| 88 | Lompoc | 43,646 | 27,650 | 63.4% |
| 89 | Corning | 8,155 | 5,152 | 63.2% |
| 90 | Hesperia | 100,775 | 63,169 | 62.7% |
| 91 | Moreno Valley | 211,666 | 130,997 | 61.9% |
| 92 | Newman | 12,316 | 7,550 | 61.3% |
| 93 | Chula Vista | 276,375 | 168,934 | 61.1% |
| 94 | Bellflower | 76,819 | 46,387 | 60.4% |
| 95 | Cathedral City | 52,267 | 31,543 | 60.3% |
| 96 | Merced | 91,953 | 55,300 | 60.1% |
| 97 | Riverbank | 25,166 | 15,118 | 60.1% |
| 98 | Orland | 8,357 | 5,017 | 60.0% |
| 99 | San Pablo | 31,720 | 18,978 | 59.8% |
| 100 | Atwater | 32,162 | 19,232 | 59.8% |
Source: U.S. Census ACS 2020-2024. 421 cities with more than 5,000 residents.
Summary
Summary: Hispanic or Latino Populations Across California
According to the most recent data, this is an accurate list if you’re looking for a breakdown of Latino populations for each place across California.
The most Hispanic/Latino cities in California are Huron, Calexico, Maywood, Orange Cove, Bell Gardens, Coachella, Cudahy, Mendota, Commerce, and Parlier.