Most Hispanic/Latino cities in Michigan research summary. We used Saturday Night Science to analyze Michigan’s most recent Census data to determine the most Hispanic/Latino cities based on the percentage of Hispanic/Latino residents.
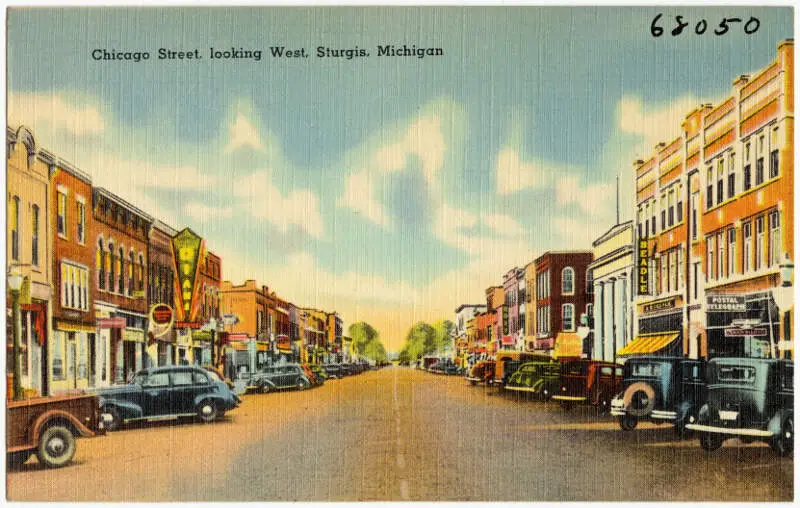
27.3% Hispanic · #1 most Hispanic in Michigan
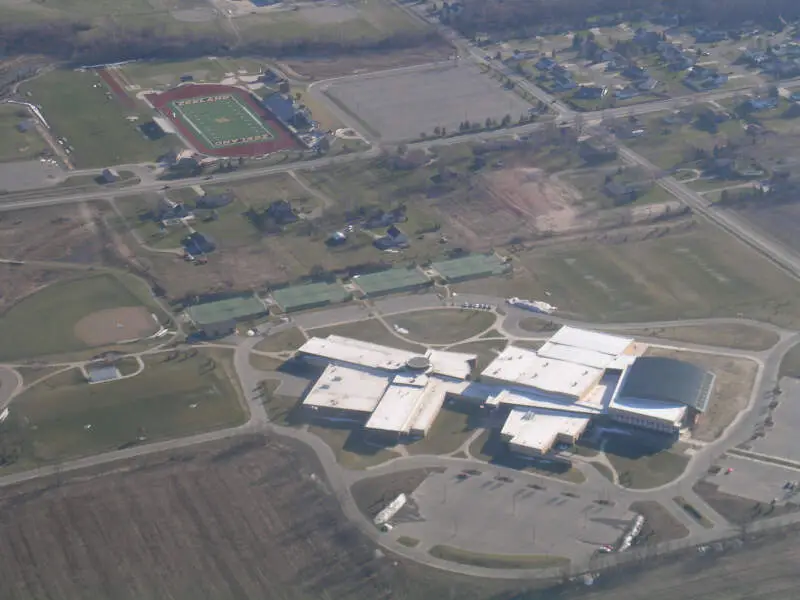
Sturgis is a city in St. Joseph County in the U.S. state of Michigan. The population was 10,994 at the 2010 census. The city is located at the northeast corner of Sturgis Township and at the intersection of U.S. Highway 12 and M-66. Sturgis is just off the Michigan 90 Indiana Toll Road.
Data | Crime | Cost of living | Movers
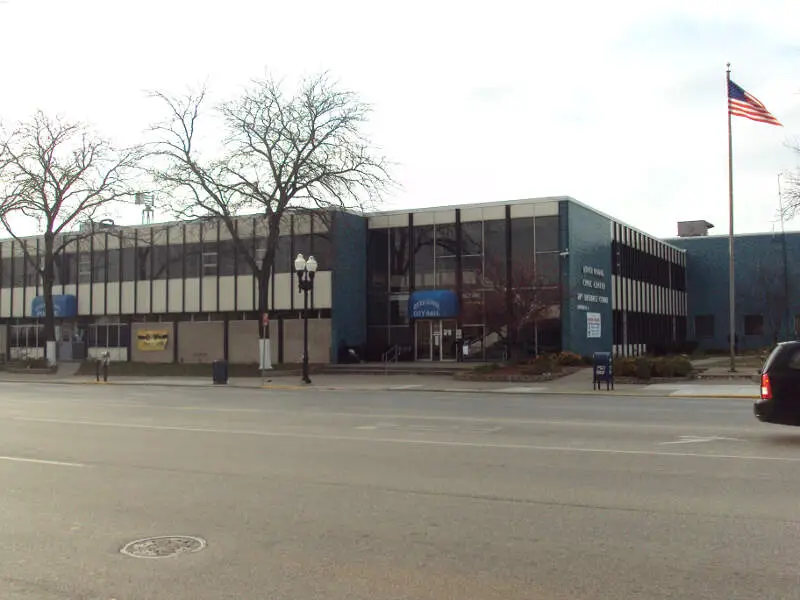
26.5% Hispanic · #2 most Hispanic in Michigan
Melvindale is a city in Wayne County of the U.S. state of Michigan and a Downriver suburb of Detroit. At the 2010 census, the city population was 10,715. Melvindale’s slogan is “The Little City with a Big Heart.”
Data | Crime | Cost of living | Movers
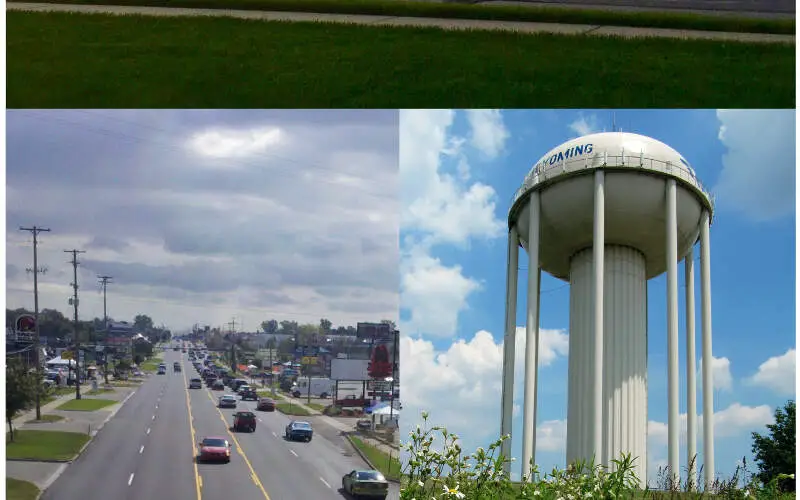
26.5% Hispanic · #3 most Hispanic in Michigan
Wyoming is a city in Kent County, Michigan. As of the 2010 census, the city had a total population of 72,125. That makes it the 3rd largest community or city in West Michigan, the 14th largest city in the state of Michigan, and the 18th largest community in the state as well as being the largest suburb of Grand Rapids.
Data | Crime | Cost of living | Movers

26.2% Hispanic · #4 most Hispanic in Michigan
Lincoln Park is a city in Wayne County in the U.S. state of Michigan. It lies in an area of cities and communities known as Downriver. The population was 38,144 at the 2010 census. The settlement was organized as a village in 1921, and reorganized as a city in 1925. The area was originally home to the Potawatomi Indians who ceded the land to a French settler, Pierre St. Cosme, in 1776. It developed as a bedroom community, providing homes to workers in the nearby steel mills and automobile plants of the Detroit area while having no industry within its bounds.
Data | Crime | Cost of living | Movers
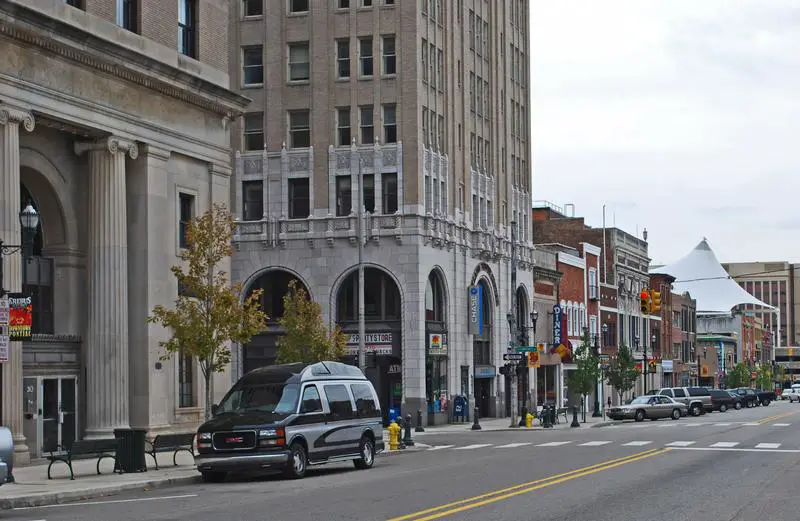
24.1% Hispanic · #5 most Hispanic in Michigan
Pontiac is a city in the U.S. state of Michigan, located near Metro Detroit. As of the 2010 census, the city had a total population of 59,515. It is the county seat of Oakland County, and about 12 miles north and slightly west of the Detroit city limits.
Data | Crime | Cost of living | Movers
23.6% Hispanic · #6 most Hispanic in Michigan
Holland is a city in the western region of the Lower Peninsula of the U.S. state of Michigan. It is situated near the eastern shore of Lake Michigan on Lake Macatawa, which is fed by the Macatawa River.
Data | Crime | Cost of living | Movers
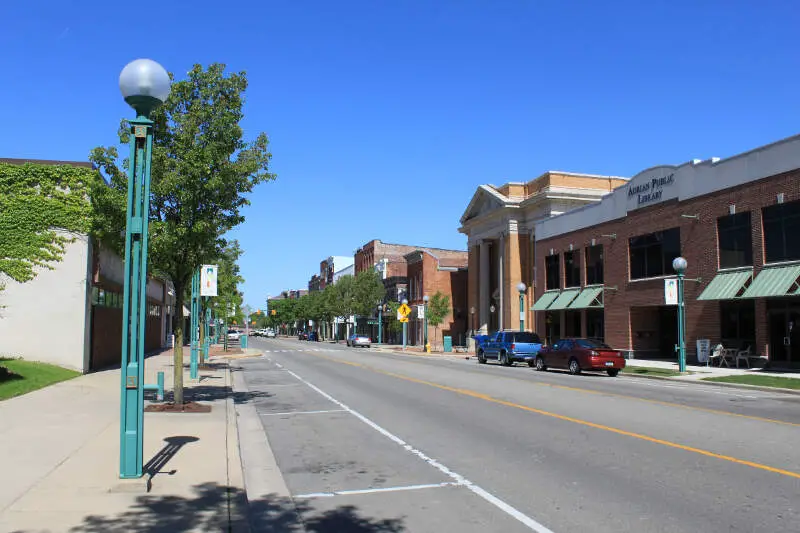
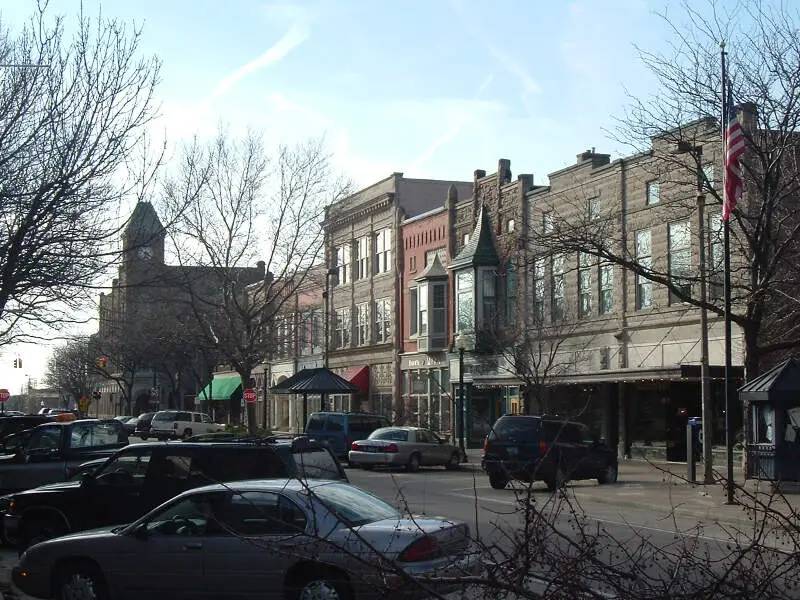
20.7% Hispanic · #7 most Hispanic in Michigan
Adrian is a city in the U.S. state of Michigan and the county seat of Lenawee County. The population was 21,133 at the 2010 census. Adrian lies in Michigan’s 7th congressional district.
Data | Crime | Cost of living | Movers
17.0% Hispanic · #8 most Hispanic in Michigan
River Rouge is a city in Wayne County in the U.S. state of Michigan and an industrial Downriver suburb of Detroit. The population was 7,903 at the 2010 census. It is named after the River Rouge, which flows along the city’s northern border and into the Detroit River. The city includes the heavily industrialized Zug Island at the mouth of the River Rouge.
Data | Crime | Cost of living | Movers
16.3% Hispanic · #9 most Hispanic in Michigan
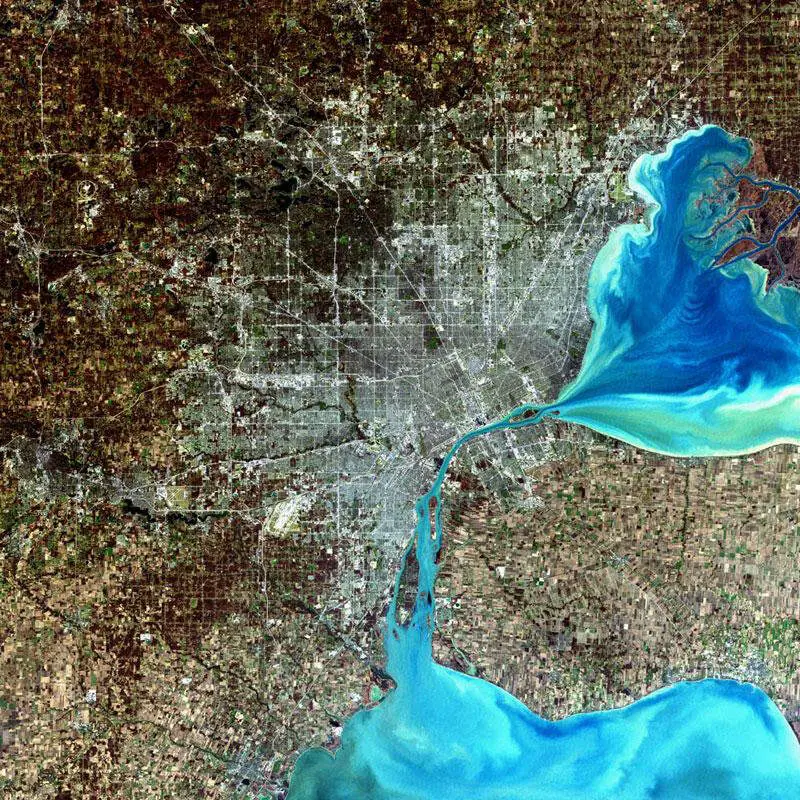
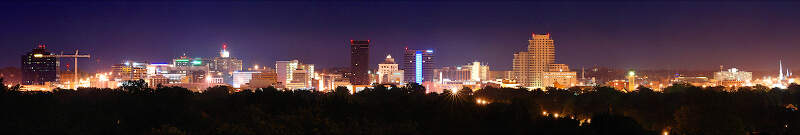
Grand Rapids is the second-largest city in Michigan, and the largest city in West Michigan. It is on the Grand River about 30 miles east of Lake Michigan. As of the 2010 census, the city population was 188,040. In 2010, the Grand Rapids metropolitan area had a population of 1,005,648, and the combined statistical area of Grand Rapids-Muskegon-Holland had a population of 1,321,557. Grand Rapids is the county seat of Kent County.
Data | Crime | Cost of living | Movers
16.1% Hispanic · #10 most Hispanic in Michigan
Zeeland is a city in Ottawa County in the U.S. state of Michigan. The population was 5,504 at the 2010 census. The city is located at the western edge of Zeeland Charter Township which is politically independent. Its name is derived from the Dutch province of Zeeland.
Data | Crime | Cost of living | Movers
The receipts
Compare the top ten
Pick a metric. The bars rescale. The red line is Michigan’s statewide median.
On the map
Where Michigan’s Hispanic and Latino communities live
Saturday Night Science
Methodology: How We Determined The Cities In Michigan With The Largest Hispanic Population For 2026
We used Saturday Night Science to compare data on race from the US Census for every city in Michigan.
Michigan’s most recently available data comes from the 2020-2024 American Community Survey.
Specifically, we looked at table B03002: Hispanic OR LATINO ORIGIN BY RACE. Here are the category names as defined by the Census:
- Hispanic or Latino
- White alone*
- Black or African American alone*
- American Indian and Alaska Native alone*
- Asian alone*
- Native Hawaiian and Other Pacific Islander alone*
- Some other race alone*
- Two or more races*
Our particular column of interest here was the number of people who identified as Hispanic or Latino.
We limited our analysis to places in Michigan with a population greater than 5,000 people. That left us with 147 cities.
We then calculated the percentage of Hispanic or Latino residents in each Michigan city. The percentages ranked from 27.3% to 0.4%.
Finally, we ranked each city based on the percentage of the Hispanic or Latino population, with a higher percentage being more Hispanic or Latino. Sturgis was the most Hispanic or Latino, while Gladstone was the least Hispanic or Latino city.
We updated this article for 2026. This article represents our eleventh time ranking the cities in Michigan with the largest Hispanic/Latino population.
The full plate
Cities In Michigan By Hispanic Population
Click any column to sort. Search by city name.
| Rank | City | Population | Hispanic Population | % Hispanic |
|---|---|---|---|---|
| 1 | Sturgis | 11,054 | 3,018 | 27.3% |
| 2 | Melvindale | 12,554 | 3,324 | 26.5% |
| 3 | Wyoming | 77,353 | 20,471 | 26.5% |
| 4 | Lincoln Park | 39,257 | 10,283 | 26.2% |
| 5 | Pontiac | 62,104 | 14,941 | 24.1% |
| 6 | Holland | 34,423 | 8,109 | 23.6% |
| 7 | Adrian | 20,395 | 4,220 | 20.7% |
| 8 | River Rouge | 7,008 | 1,189 | 17.0% |
| 9 | Grand Rapids | 198,535 | 32,415 | 16.3% |
| 10 | Zeeland | 5,665 | 912 | 16.1% |
| 11 | Saginaw | 43,536 | 6,910 | 15.9% |
| 12 | Ecorse | 9,064 | 1,404 | 15.5% |
| 13 | Allen Park | 27,925 | 3,664 | 13.1% |
| 14 | Alma | 9,396 | 1,216 | 12.9% |
| 15 | Lansing | 113,023 | 14,574 | 12.9% |
| 16 | Auburn Hills | 25,105 | 3,106 | 12.4% |
| 17 | Bay City | 32,320 | 3,706 | 11.5% |
| 18 | Woodhaven | 12,690 | 1,404 | 11.1% |
| 19 | Kentwood | 54,296 | 5,586 | 10.3% |
| 20 | Muskegon | 37,226 | 3,693 | 9.9% |
| 21 | Southgate | 29,366 | 2,750 | 9.4% |
| 22 | Dowagiac | 5,732 | 529 | 9.2% |
| 23 | Riverview | 12,186 | 1,118 | 9.2% |
| 24 | Ionia | 12,753 | 1,150 | 9.0% |
| 25 | Ypsilanti | 19,857 | 1,784 | 9.0% |
| 26 | Howell | 10,021 | 866 | 8.6% |
| 27 | St. Louis | 7,367 | 619 | 8.4% |
| 28 | Detroit | 638,530 | 53,262 | 8.3% |
| 29 | Battle Creek | 52,374 | 4,363 | 8.3% |
| 30 | Belding | 5,960 | 485 | 8.1% |
| 31 | Wyandotte | 24,489 | 1,940 | 7.9% |
| 32 | Kalamazoo | 73,076 | 5,698 | 7.8% |
| 33 | Taylor | 62,081 | 4,734 | 7.6% |
| 34 | Coldwater | 13,671 | 1,038 | 7.6% |
| 35 | Flat Rock | 10,340 | 767 | 7.4% |
| 36 | Albion | 7,560 | 554 | 7.3% |
| 37 | Greenville | 8,995 | 659 | 7.3% |
| 38 | Tecumseh | 8,646 | 625 | 7.2% |
| 39 | Niles | 11,803 | 823 | 7.0% |
| 40 | Jackson | 31,058 | 2,126 | 6.8% |
| 41 | Three Rivers | 7,943 | 529 | 6.7% |
| 42 | East Lansing | 45,758 | 3,008 | 6.6% |
| 43 | Garden City | 26,739 | 1,711 | 6.4% |
| 44 | Port Huron | 28,620 | 1,814 | 6.3% |
| 45 | Mount Pleasant | 21,236 | 1,340 | 6.3% |
| 46 | Walker | 25,386 | 1,562 | 6.2% |
| 47 | Grand Blanc | 7,987 | 485 | 6.1% |
| 48 | Grandville | 16,356 | 986 | 6.0% |
| 49 | Grand Haven | 10,996 | 654 | 5.9% |
| 50 | Benton Harbor | 8,953 | 521 | 5.8% |
| 51 | Springfield | 5,269 | 299 | 5.7% |
| 52 | Lapeer | 9,082 | 506 | 5.6% |
| 53 | Portage | 49,259 | 2,741 | 5.6% |
| 54 | Manistee | 6,275 | 347 | 5.5% |
| 55 | Milan | 5,987 | 330 | 5.5% |
| 56 | Ann Arbor | 122,036 | 6,698 | 5.5% |
| 57 | Dearborn Heights | 61,771 | 3,385 | 5.5% |
| 58 | Hazel Park | 14,963 | 794 | 5.3% |
| 59 | St. Joseph | 7,986 | 415 | 5.2% |
| 60 | Richmond | 5,855 | 302 | 5.2% |
| 61 | Holly | 5,964 | 305 | 5.1% |
| 62 | Grand Ledge | 7,804 | 399 | 5.1% |
| 63 | Rochester Hills | 77,089 | 3,906 | 5.1% |
| 64 | Marshall | 6,804 | 340 | 5.0% |
| 65 | Ludington | 7,676 | 381 | 5.0% |
| 66 | Westland | 83,633 | 3,997 | 4.8% |
| 67 | Ferndale | 19,190 | 909 | 4.7% |
| 68 | Royal Oak | 57,950 | 2,680 | 4.6% |
| 69 | Saline | 9,006 | 415 | 4.6% |
| 70 | Muskegon Heights | 9,841 | 450 | 4.6% |
| 71 | Midland | 42,724 | 1,951 | 4.6% |
| 72 | Clawson | 11,374 | 517 | 4.5% |
| 73 | Novi | 66,717 | 2,993 | 4.5% |
| 74 | Flint | 80,175 | 3,592 | 4.5% |
| 75 | Livonia | 93,851 | 4,168 | 4.4% |
| 76 | Birmingham | 21,763 | 963 | 4.4% |
| 77 | Charlotte | 9,277 | 410 | 4.4% |
| 78 | Trenton | 18,125 | 792 | 4.4% |
| 79 | Wixom | 17,295 | 748 | 4.3% |
| 80 | Iron Mountain | 7,518 | 318 | 4.2% |
| 81 | Eaton Rapids | 5,183 | 215 | 4.1% |
| 82 | Swartz Creek | 5,853 | 234 | 4.0% |
| 83 | Mount Clemens | 15,511 | 616 | 4.0% |
| 84 | Burton | 29,500 | 1,166 | 4.0% |
| 85 | Mason | 8,249 | 321 | 3.9% |
| 86 | Berkley | 15,149 | 581 | 3.8% |
| 87 | Wayne | 17,310 | 661 | 3.8% |
| 88 | Hillsdale | 8,002 | 302 | 3.8% |
| 89 | St. Johns | 7,715 | 288 | 3.7% |
| 90 | Inkster | 25,428 | 940 | 3.7% |
| 91 | Owosso | 14,632 | 540 | 3.7% |
| 92 | Farmington | 11,504 | 423 | 3.7% |
| 93 | New Baltimore | 12,072 | 439 | 3.6% |
| 94 | Traverse City | 15,593 | 563 | 3.6% |
| 95 | Alpena | 10,154 | 346 | 3.4% |
| 96 | Walled Lake | 7,299 | 246 | 3.4% |
| 97 | Davison | 5,076 | 171 | 3.4% |
| 98 | Roseville | 47,123 | 1,587 | 3.4% |
| 99 | Norton Shores | 25,041 | 793 | 3.2% |
| 100 | Flushing | 8,284 | 260 | 3.1% |
Source: U.S. Census ACS 2020-2024. 147 cities with more than 5,000 residents.
Summary
Summary: Hispanic or Latino Populations Across Michigan
According to the most recent data, this is an accurate list if you’re looking for a breakdown of Latino populations for each place across Michigan.
The most Hispanic/Latino cities in Michigan are Sturgis, Melvindale, Wyoming, Lincoln Park, Pontiac, Holland, Adrian, River Rouge, Grand Rapids, and Zeeland. Not sold on Michigan? Take the two-minute Find Your Place quiz and see which state actually fits you.
Questions and answers
Most Hispanic Cities In Michigan FAQs
What is the most Hispanic city in Michigan?
Sturgis is the most Hispanic or Latino city in Michigan for 2026, at 27.3% of residents. Melvindale and Wyoming are next.
What cities in Michigan have the highest Hispanic population?
The Michigan cities with the highest Hispanic and Latino population shares are Sturgis, Melvindale, Wyoming, Lincoln Park, Pontiac, Holland, Adrian, River Rouge, Grand Rapids, and Zeeland. We ranked all 147 places with more than 5,000 residents.
What percent of Sturgis is Hispanic?
Hispanic and Latino residents make up 27.3% of Sturgis, the highest share of the 147 Michigan places we measured. The numbers come from the Census Bureau’s American Community Survey.
What is the least Hispanic city in Michigan?
Gladstone is the least Hispanic or Latino city in Michigan, at 0.4%. It sits at the opposite end of the same ranking.
Where does this data come from?
Every share is calculated from the Census Bureau’s American Community Survey (2020-2024), based on residents identifying as Hispanic or Latino of any race. We rank each Michigan place with more than 5,000 residents.