Most Hispanic/Latino cities in Ohio research summary. We used Saturday Night Science to analyze Ohio’s most recent Census data to determine the most Hispanic/Latino cities based on the percentage of Hispanic/Latino residents.
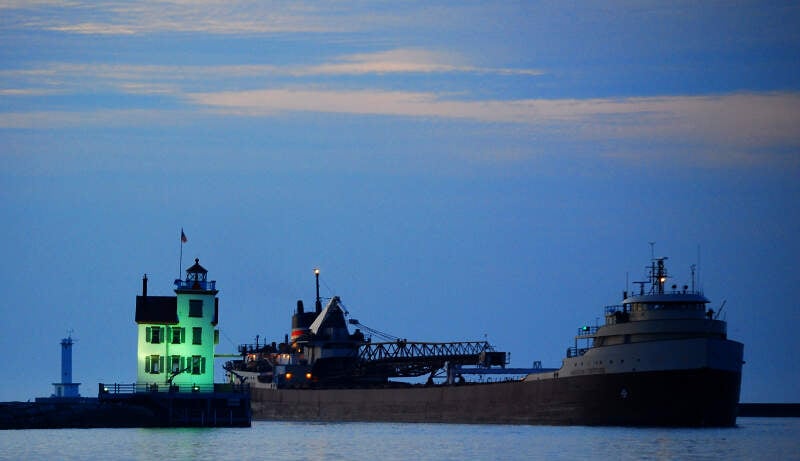
28.3% Hispanic · #1 most Hispanic in Ohio
Lorain is a city in Lorain County, Ohio, United States. The municipality is located in northeastern Ohio on Lake Erie, at the mouth of the Black River, approximately 30 miles west of Cleveland. As of the 2010 census, the city had a total population of 64,097, making it Ohio’s tenth largest city, the second largest in Greater Cleveland, and the largest in Lorain County by population.
Data | Crime | Cost of living | Movers

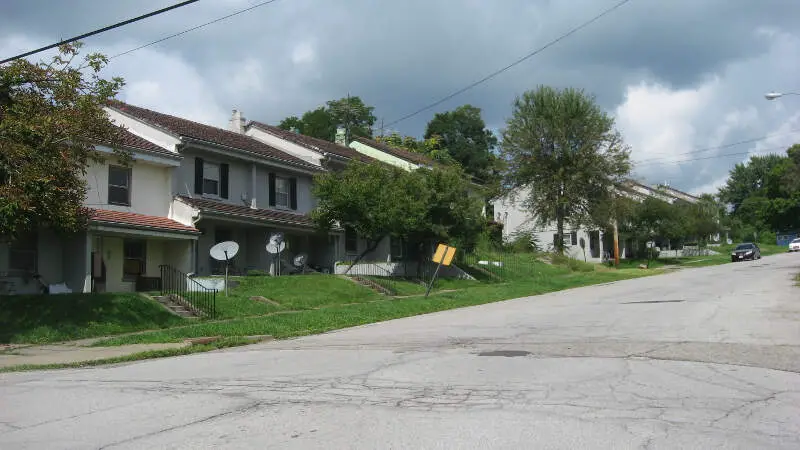
25.8% Hispanic · #2 most Hispanic in Ohio
Painesville is a city in and the county seat of Lake County, Ohio, United States, located along the Grand River. Its population was 19,563 at the 2010 census.
Data | Crime | Cost of living | Movers
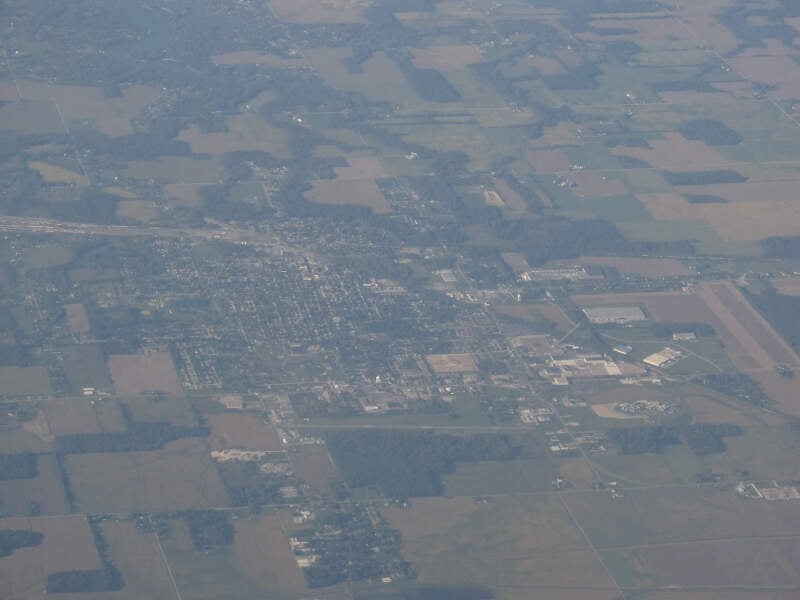
22.8% Hispanic · #3 most Hispanic in Ohio
Data | Crime | Cost of living | Movers
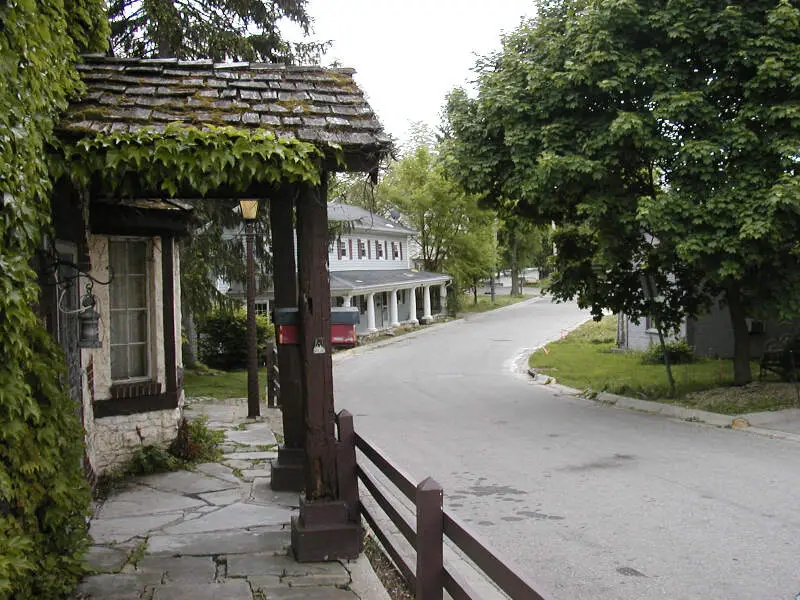
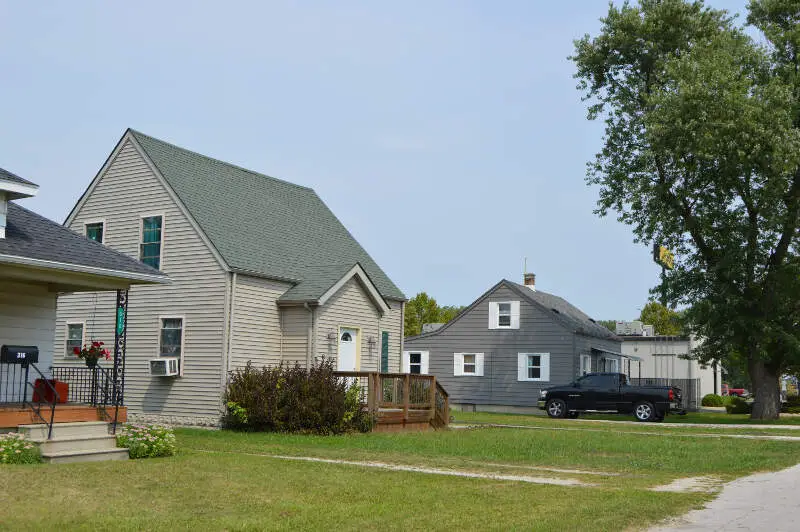
22.2% Hispanic · #4 most Hispanic in Ohio
New Carlisle is a city in Clark County, Ohio, United States. The population was 5,785 at the 2010 census. It is part of the Springfield, Ohio Metropolitan Statistical Area.
Data | Crime | Cost of living | Movers
18.3% Hispanic · #5 most Hispanic in Ohio
Willard is a city in Huron County, Ohio, United States. The population was 6,236 at the 2010 census. Willard is served by the Willard Memorial Library.
Data | Crime | Cost of living | Movers
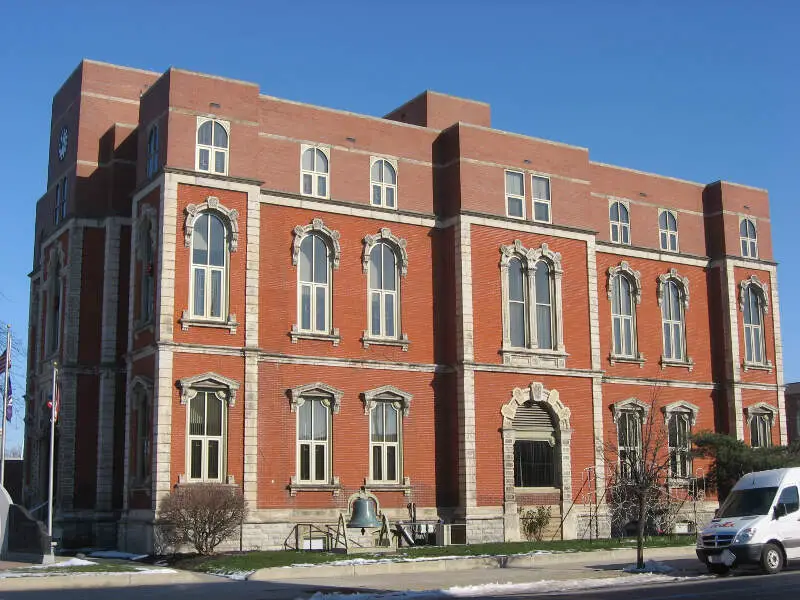
17.3% Hispanic · #6 most Hispanic in Ohio
Defiance is a city in and the county seat of Defiance County, Ohio, United States, about 55 miles southwest of Toledo and 47 miles northeast of Fort Wayne, Indiana, in Ohio’s northwestern corner. The population was 16,494 at the 2010 census.
Data | Crime | Cost of living | Movers
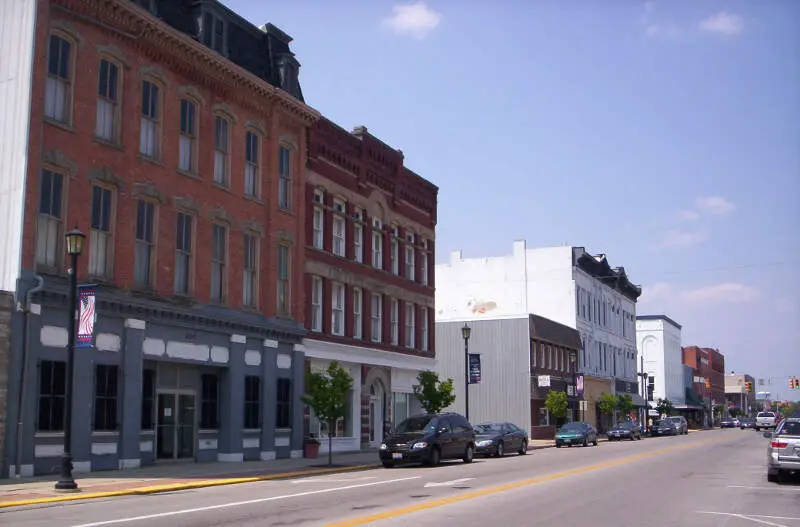
16.6% Hispanic · #7 most Hispanic in Ohio
Fremont is a city in and the county seat of Sandusky County, Ohio, United States, located about 40 miles from Toledo. The population was 16,734 at the 2010 census. It was the home of Rutherford B. Hayes, who served as President of the United States from 1877 to 1881. The Rutherford B. Hayes Presidential Center remains one of the focal points of Fremont, OH. The National Arbor Day Foundation designated Fremont as a Tree City USA.
Data | Crime | Cost of living | Movers
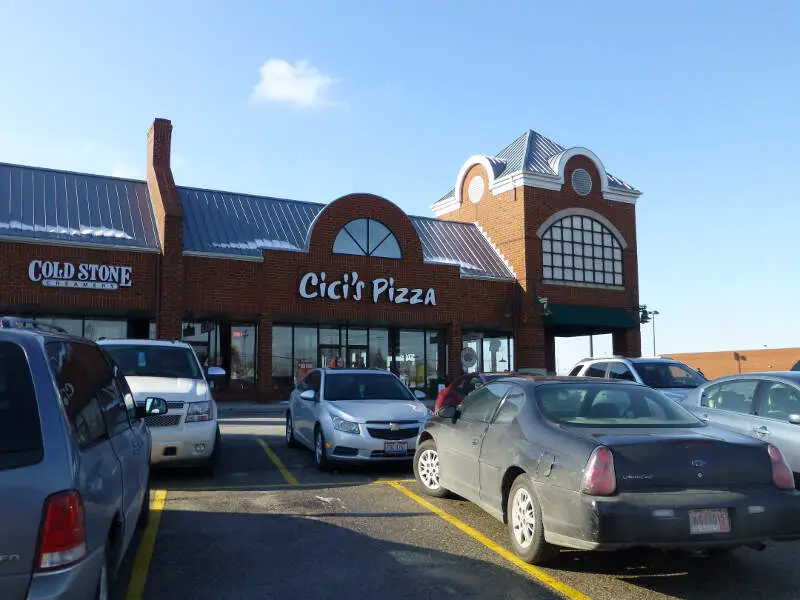
16.4% Hispanic · #8 most Hispanic in Ohio
Data | Crime | Cost of living | Movers
15.6% Hispanic · #9 most Hispanic in Ohio
Northwood is a city and eastern suburb in Wood County, Ohio, United States, within the Toledo metropolitan area. The population was 5,265 at the 2010 census.
Data | Crime | Cost of living | Movers
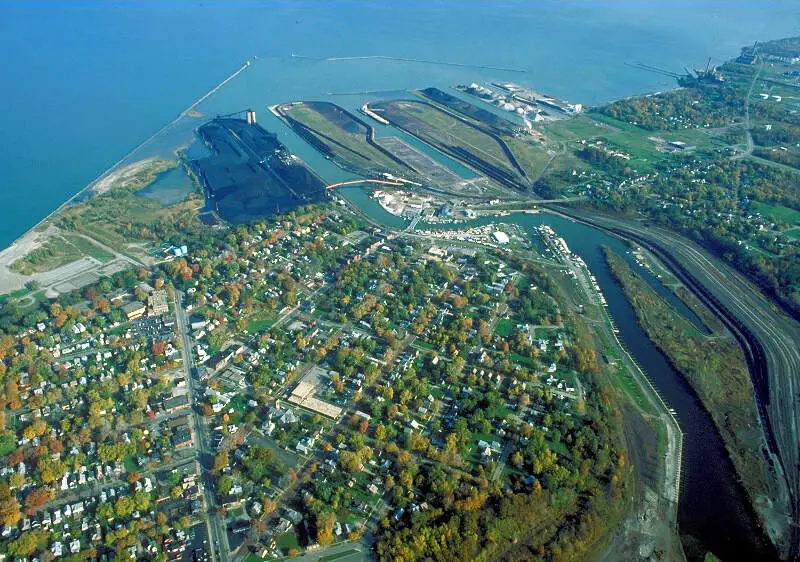
14.0% Hispanic · #10 most Hispanic in Ohio
Ashtabula ash-t-BEW-l is a city in Ashtabula County, Ohio, United States, and the center of the Ashtabula Micropolitan Statistical Area. It is located at the mouth of the Ashtabula River on Lake Erie, one of the Great Lakes, across from the province of Ontario, Canada. The name Ashtabula is derived from ashtepihle, which means ‘always enough fish to be shared around’ in the Lenape language.
Data | Crime | Cost of living | Movers
The receipts
Compare the top ten
Pick a metric. The bars rescale. The red line is Ohio’s statewide median.
On the map
Where Ohio’s Hispanic and Latino communities live
Saturday Night Science
Methodology: How We Determined The Cities In Ohio With The Largest Hispanic Population For 2026
We used Saturday Night Science to compare data on race from the US Census for every city in Ohio.
Ohio’s most recently available data comes from the 2020-2024 American Community Survey.
Specifically, we looked at table B03002: Hispanic OR LATINO ORIGIN BY RACE. Here are the category names as defined by the Census:
- Hispanic or Latino
- White alone*
- Black or African American alone*
- American Indian and Alaska Native alone*
- Asian alone*
- Native Hawaiian and Other Pacific Islander alone*
- Some other race alone*
- Two or more races*
Our particular column of interest here was the number of people who identified as Hispanic or Latino.
We limited our analysis to places in Ohio with a population greater than 5,000 people. That left us with 243 cities.
We then calculated the percentage of Hispanic or Latino residents in each Ohio city. The percentages ranked from 28.3% to 0.0%.
Finally, we ranked each city based on the percentage of the Hispanic or Latino population, with a higher percentage being more Hispanic or Latino. Lorain was the most Hispanic or Latino, while Milford was the least Hispanic or Latino city.
We updated this article for 2026. This article represents our eleventh time ranking the cities in Ohio with the largest Hispanic/Latino population.
The full plate
Cities In Ohio By Hispanic Population
Click any column to sort. Search by city name.
| Rank | City | Population | Hispanic Population | % Hispanic |
|---|---|---|---|---|
| 1 | Lorain | 65,395 | 18,520 | 28.3% |
| 2 | Painesville | 20,548 | 5,293 | 25.8% |
| 3 | Campbell | 7,784 | 1,774 | 22.8% |
| 4 | New Carlisle | 5,544 | 1,228 | 22.2% |
| 5 | Willard | 6,164 | 1,131 | 18.3% |
| 6 | Defiance | 17,276 | 2,987 | 17.3% |
| 7 | Fremont | 15,835 | 2,632 | 16.6% |
| 8 | Brooklyn | 11,158 | 1,826 | 16.4% |
| 9 | Northwood | 5,193 | 808 | 15.6% |
| 10 | Ashtabula | 17,856 | 2,498 | 14.0% |
| 11 | Grafton | 5,657 | 788 | 13.9% |
| 12 | Wauseon | 7,505 | 1,018 | 13.6% |
| 13 | Cleveland | 366,097 | 48,496 | 13.2% |
| 14 | Moraine | 6,536 | 865 | 13.2% |
| 15 | Sharonville | 14,030 | 1,752 | 12.5% |
| 16 | Youngstown | 59,331 | 7,287 | 12.3% |
| 17 | Hamilton | 63,468 | 7,637 | 12.0% |
| 18 | Fairfield | 44,828 | 5,099 | 11.4% |
| 19 | Whitehall | 20,019 | 2,180 | 10.9% |
| 20 | Forest Park | 20,025 | 2,167 | 10.8% |
| 21 | Fostoria | 12,344 | 1,329 | 10.8% |
| 22 | Elyria | 53,035 | 5,557 | 10.5% |
| 23 | Springdale | 11,033 | 1,139 | 10.3% |
| 24 | New Philadelphia | 17,520 | 1,787 | 10.2% |
| 25 | Sheffield Lake | 8,966 | 907 | 10.1% |
| 26 | Struthers | 9,923 | 924 | 9.3% |
| 27 | Bellevue | 8,187 | 761 | 9.3% |
| 28 | Toledo | 267,463 | 24,330 | 9.1% |
| 29 | Norwalk | 17,095 | 1,505 | 8.8% |
| 30 | Oregon | 19,799 | 1,737 | 8.8% |
| 31 | Findlay | 40,287 | 3,443 | 8.5% |
| 32 | West Carrollton | 12,976 | 1,102 | 8.5% |
| 33 | Parma | 79,870 | 6,710 | 8.4% |
| 34 | Columbus | 914,802 | 75,585 | 8.3% |
| 35 | Middletown | 51,617 | 4,241 | 8.2% |
| 36 | Oberlin | 8,329 | 672 | 8.1% |
| 37 | Dover | 13,053 | 994 | 7.6% |
| 38 | Maumee | 13,715 | 1,024 | 7.5% |
| 39 | North Olmsted | 31,924 | 2,380 | 7.5% |
| 40 | Amherst | 12,906 | 898 | 7.0% |
| 41 | Napoleon | 8,802 | 608 | 6.9% |
| 42 | Garfield Heights | 29,269 | 1,988 | 6.8% |
| 43 | Middleburg Heights | 15,786 | 1,068 | 6.8% |
| 44 | Canton | 69,755 | 4,693 | 6.7% |
| 45 | Bowling Green | 29,983 | 2,000 | 6.7% |
| 46 | Norwood | 19,114 | 1,270 | 6.6% |
| 47 | Port Clinton | 5,970 | 392 | 6.6% |
| 48 | Reynoldsburg | 41,224 | 2,699 | 6.5% |
| 49 | Upper Sandusky | 6,558 | 409 | 6.2% |
| 50 | Sandusky | 24,606 | 1,510 | 6.1% |
| 51 | Brook Park | 18,284 | 1,112 | 6.1% |
| 52 | Cincinnati | 311,224 | 18,909 | 6.1% |
| 53 | Madeira | 9,484 | 575 | 6.1% |
| 54 | North Ridgeville | 36,627 | 2,209 | 6.0% |
| 55 | Sylvania | 19,055 | 1,128 | 5.9% |
| 56 | St. Marys | 8,301 | 490 | 5.9% |
| 57 | Bedford Heights | 10,847 | 625 | 5.8% |
| 58 | Marysville | 27,518 | 1,578 | 5.7% |
| 59 | Dayton | 136,579 | 7,759 | 5.7% |
| 60 | Centerville | 25,205 | 1,430 | 5.7% |
| 61 | Van Wert | 10,790 | 611 | 5.7% |
| 62 | Montgomery | 10,855 | 609 | 5.6% |
| 63 | Hilliard | 38,033 | 2,122 | 5.6% |
| 64 | Springfield | 58,190 | 3,238 | 5.6% |
| 65 | Loveland | 13,197 | 734 | 5.6% |
| 66 | Huber Heights | 43,455 | 2,369 | 5.5% |
| 67 | Rossford | 6,323 | 344 | 5.4% |
| 68 | Geneva | 5,886 | 316 | 5.4% |
| 69 | Columbiana | 6,903 | 364 | 5.3% |
| 70 | Steubenville | 18,124 | 943 | 5.2% |
| 71 | Tiffin | 17,818 | 916 | 5.1% |
| 72 | Perrysburg | 25,181 | 1,291 | 5.1% |
| 73 | Olmsted Falls | 8,639 | 441 | 5.1% |
| 74 | Monroe | 15,401 | 785 | 5.1% |
| 75 | St. Clairsville | 5,003 | 254 | 5.1% |
| 76 | Franklin | 11,712 | 574 | 4.9% |
| 77 | Pataskala | 18,223 | 888 | 4.9% |
| 78 | Delaware | 44,589 | 2,156 | 4.8% |
| 79 | Lima | 35,010 | 1,670 | 4.8% |
| 80 | Mount Healthy | 6,919 | 328 | 4.7% |
| 81 | Clyde | 6,331 | 298 | 4.7% |
| 82 | Beavercreek | 47,126 | 2,208 | 4.7% |
| 83 | Girard | 9,505 | 439 | 4.6% |
| 84 | Lyndhurst | 13,801 | 625 | 4.5% |
| 85 | North Royalton | 30,972 | 1,398 | 4.5% |
| 86 | Medina | 25,950 | 1,151 | 4.4% |
| 87 | Westlake | 34,104 | 1,511 | 4.4% |
| 88 | Brunswick | 35,246 | 1,560 | 4.4% |
| 89 | Bedford | 12,931 | 567 | 4.4% |
| 90 | Mayfield Heights | 20,022 | 874 | 4.4% |
| 91 | Orrville | 8,343 | 363 | 4.4% |
| 92 | Bryan | 8,631 | 375 | 4.3% |
| 93 | Fairview Park | 17,018 | 737 | 4.3% |
| 94 | Shaker Heights | 28,922 | 1,248 | 4.3% |
| 95 | Vermilion | 10,343 | 446 | 4.3% |
| 96 | Parma Heights | 20,581 | 887 | 4.3% |
| 97 | Lakewood | 50,007 | 2,155 | 4.3% |
| 98 | Akron | 189,247 | 8,094 | 4.3% |
| 99 | Grove City | 42,517 | 1,799 | 4.2% |
| 100 | Athens | 23,396 | 978 | 4.2% |
Source: U.S. Census ACS 2020-2024. 243 cities with more than 5,000 residents.
Summary
Summary: Hispanic or Latino Populations Across Ohio
According to the most recent data, this is an accurate list if you’re looking for a breakdown of Latino populations for each place across Ohio.
The most Hispanic/Latino cities in Ohio are Lorain, Painesville, Campbell, New Carlisle, Willard, Defiance, Fremont, Brooklyn, Northwood, and Ashtabula. Not sold on Ohio? Take the two-minute Find Your Place quiz and see which state actually fits you.