Most Hispanic/Latino cities in Wyoming research summary. We used Saturday Night Science to analyze Wyoming’s most recent Census data to determine the most Hispanic/Latino cities based on the percentage of Hispanic/Latino residents.
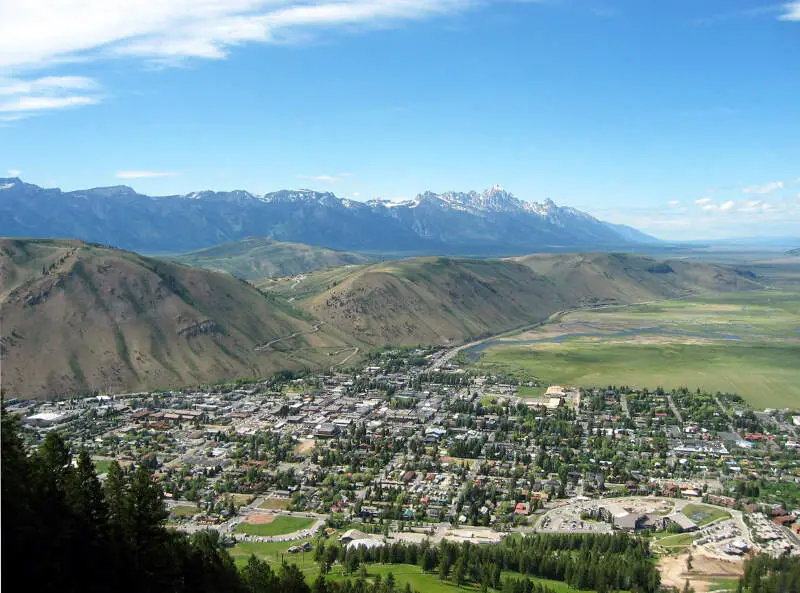
25.8% Hispanic · #1 most Hispanic in Wyoming
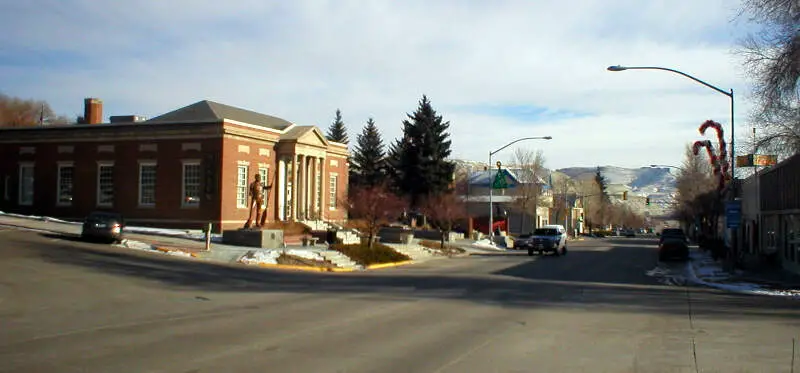
Jackson is a town in the Jackson Hole valley of Teton County, Wyoming, United States. The population was 9,577 at the 2010 census, up from 8,647 in 2000. It is the county seat of Teton County and is its largest town.
Data | Crime | Cost of living | Movers
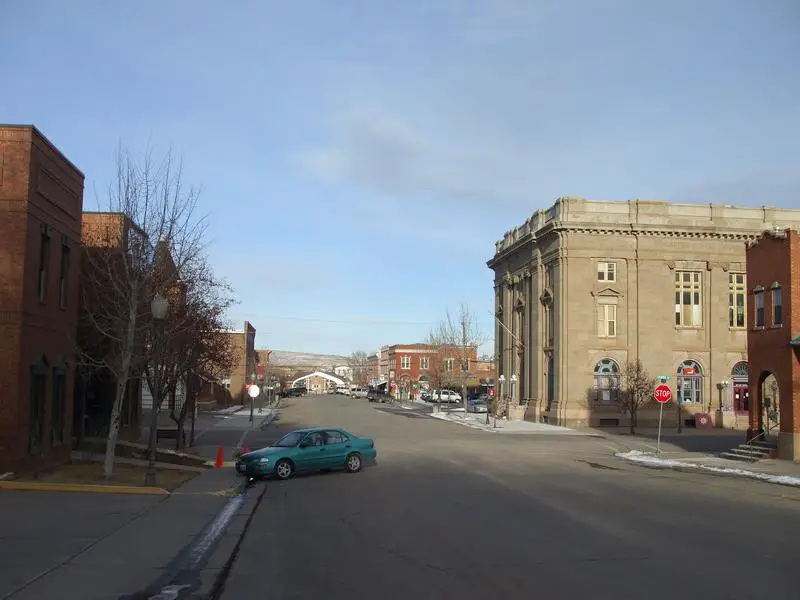
24.0% Hispanic · #2 most Hispanic in Wyoming
Data | Crime | Cost of living | Movers
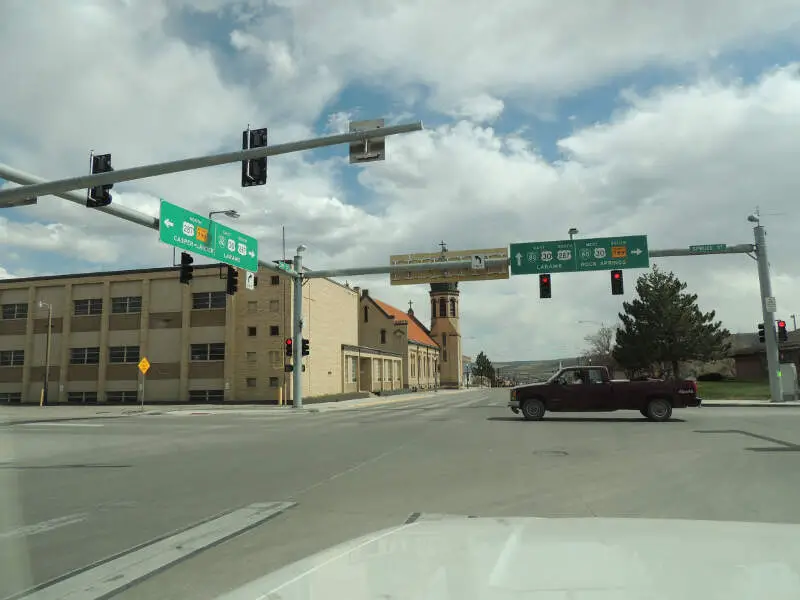
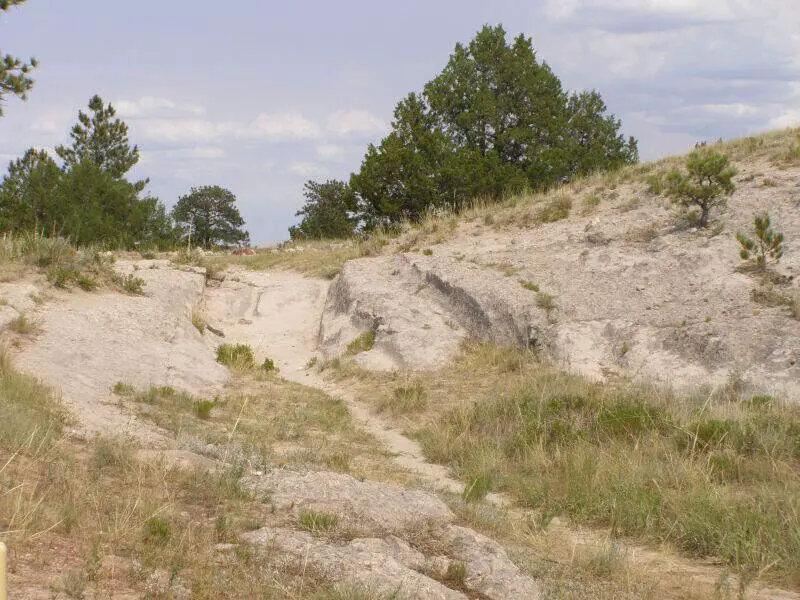
17.0% Hispanic · #3 most Hispanic in Wyoming
Rock Springs is a city in Sweetwater County, Wyoming, United States. The population was 23,036 at the 2010 census, making it the 5th most populated city in the state of Wyoming. Rock Springs is the principal city of the Rock Springs micropolitan statistical area, which has a population of 37,975. Rock Springs is known as the Home of 56 Nationalities because of the influx of immigrants from all over the world who came to work in the coal mines that supplied the fuel to power the steam engines of the Union Pacific Railroad. The city’s rich cultural heritage is celebrated each summer on International Day, a festival where the foods, costumes, and traditions of residents’ ancestors are recreated and enjoyed at Bunning Park in downtown Rock Springs.
Data | Crime | Cost of living | Movers
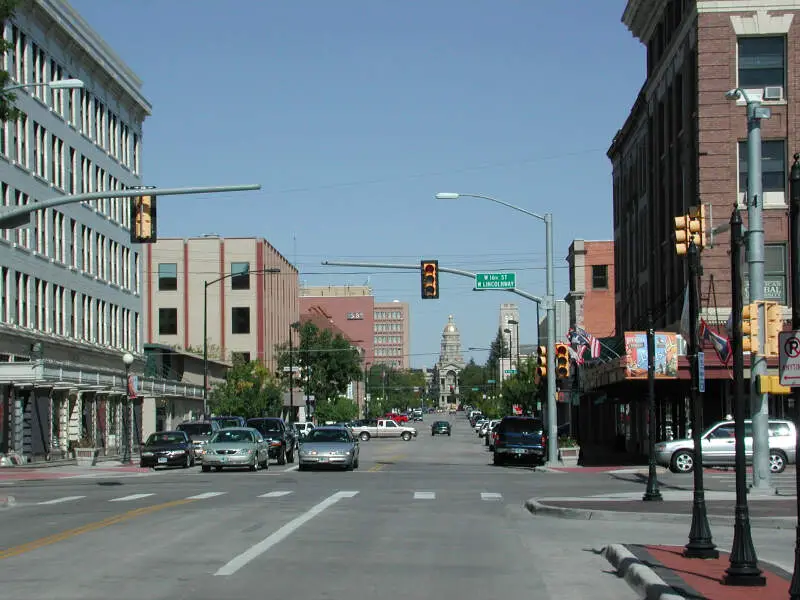
16.8% Hispanic · #4 most Hispanic in Wyoming
Cheyenne is the capital and most populous city of the U.S. state of Wyoming and the county seat of Laramie County. It is the principal city of the Cheyenne, Wyoming, Metropolitan Statistical Area which encompasses all of Laramie County. The population was 59,466 at the 2010 census. Cheyenne is the northern terminus of the extensive and fast-growing Front Range Urban Corridor that stretches from Cheyenne to Pueblo, Colorado, and has a population of 4,333,742 according to the 2010 United States Census. Cheyenne is situated on Crow Creek and Dry Creek. The Cheyenne, Wyoming Metropolitan Area had a 2010 population of 91,738, making it the 354th-most populous metropolitan area in the United States.
Data | Crime | Cost of living | Movers
15.7% Hispanic · #5 most Hispanic in Wyoming
Torrington is a city in, and the county seat of, Goshen County, Wyoming United States. The population was 6,501 at the 2010 census.
Data | Crime | Cost of living | Movers
14.5% Hispanic · #6 most Hispanic in Wyoming
Green River is a city in and the county seat of Sweetwater County, Wyoming, United States, in the southwestern part of the state. The population was 12,515 at the 2010 census.
Data | Crime | Cost of living | Movers
14.3% Hispanic · #7 most Hispanic in Wyoming
Evanston is a city in and the county seat of Uinta County, Wyoming, United States. The population was 12,359 at the 2010 census. It is located on the border with Utah.
Data | Crime | Cost of living | Movers
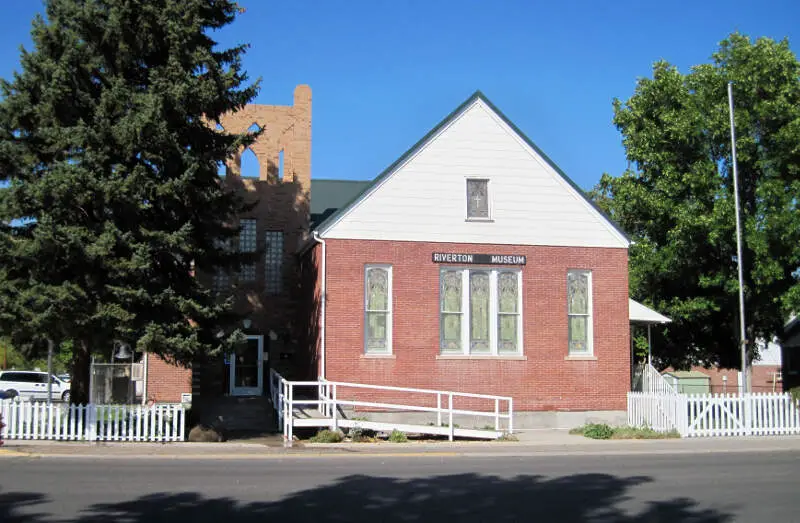
12.0% Hispanic · #8 most Hispanic in Wyoming
Riverton is a city in Fremont County, Wyoming, United States. The city’s population was 10,615 at the 2010 census, making it the largest city in the county overall.
Data | Crime | Cost of living | Movers
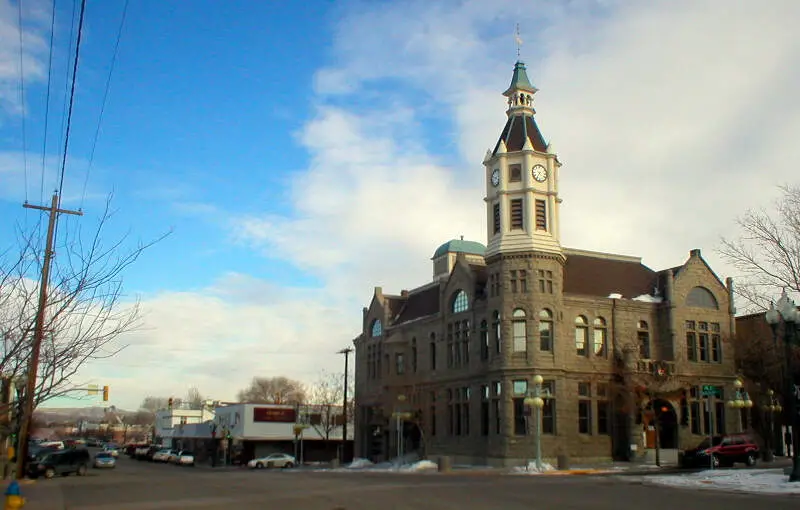
11.6% Hispanic · #9 most Hispanic in Wyoming
Douglas is a city in Converse County, Wyoming, United States. The population was 6,120 at the 2010 census. It is the county seat of Converse County and the home of the Wyoming State Fair.
Data | Crime | Cost of living | Movers
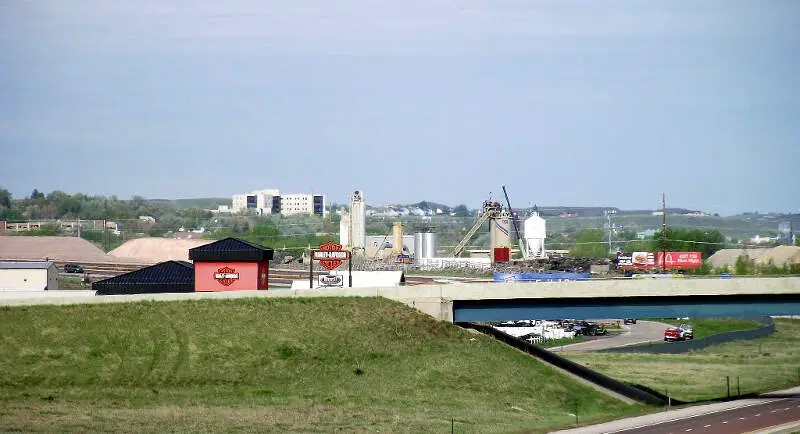
11.5% Hispanic · #10 most Hispanic in Wyoming
Gillette is a city in and the county seat of Campbell County, Wyoming, United States. The population was estimated at 31,797 as of 1 July 2013. Gillette is centrally located in an area involved with the development of vast quantities of American coal, oil, and coalbed methane gas. The city calls itself the “Energy Capital of the Nation,” noting that the state of Wyoming provides nearly 35% of the nation’s coal. Over the last decade Gillette saw a population increase of 48% from the 2000 census of 19,646 residents.
Data | Crime | Cost of living | Movers
The receipts
Compare the top ten
Pick a metric. The bars rescale. The red line is Wyoming’s statewide median.
On the map
Where Wyoming’s Hispanic and Latino communities live
Saturday Night Science
Methodology: How We Determined The Cities In Wyoming With The Largest Hispanic Population For 2026
We used Saturday Night Science to compare data on race from the US Census for every city in Wyoming.
Wyoming’s most recently available data comes from the 2020-2024 American Community Survey.
Specifically, we looked at table B03002: Hispanic OR LATINO ORIGIN BY RACE. Here are the category names as defined by the Census:
- Hispanic or Latino
- White alone*
- Black or African American alone*
- American Indian and Alaska Native alone*
- Asian alone*
- Native Hawaiian and Other Pacific Islander alone*
- Some other race alone*
- Two or more races*
Our particular column of interest here was the number of people who identified as Hispanic or Latino.
We limited our analysis to places in Wyoming with a population greater than 6,000 people. That left us with 16 cities.
We then calculated the percentage of Hispanic or Latino residents in each Wyoming city. The percentages ranked from 25.8% to 5.2%.
Finally, we ranked each city based on the percentage of the Hispanic or Latino population, with a higher percentage being more Hispanic or Latino. Jackson was the most Hispanic or Latino, while Cody was the least Hispanic or Latino city.
We updated this article for 2026. This article represents our eleventh time ranking the cities in Wyoming with the largest Hispanic/Latino population.
The full plate
Cities In Wyoming By Hispanic Population
Click any column to sort. Search by city name.
| Rank | City | Population | Hispanic Population | % Hispanic |
|---|---|---|---|---|
| 1 | Jackson | 10,756 | 2,773 | 25.8% |
| 2 | Rawlins | 8,129 | 1,953 | 24.0% |
| 3 | Rock Springs | 23,127 | 3,934 | 17.0% |
| 4 | Cheyenne | 65,239 | 10,976 | 16.8% |
| 5 | Torrington | 6,182 | 970 | 15.7% |
| 6 | Green River | 11,581 | 1,683 | 14.5% |
| 7 | Evanston | 11,800 | 1,685 | 14.3% |
| 8 | Riverton | 10,856 | 1,301 | 12.0% |
| 9 | Douglas | 6,420 | 744 | 11.6% |
| 10 | Gillette | 33,431 | 3,860 | 11.5% |
| 11 | Laramie | 32,234 | 3,689 | 11.4% |
| 12 | Powell | 6,503 | 624 | 9.6% |
| 13 | Casper | 58,839 | 5,380 | 9.1% |
| 14 | Sheridan | 19,285 | 1,252 | 6.5% |
| 15 | Lander | 7,432 | 455 | 6.1% |
| 16 | Cody | 10,276 | 537 | 5.2% |
Source: U.S. Census ACS 2020-2024. 16 cities with more than 6,000 residents.
Summary
Summary: Hispanic or Latino Populations Across Wyoming
According to the most recent data, this is an accurate list if you’re looking for a breakdown of Latino populations for each place across Wyoming.
The most Hispanic/Latino cities in Wyoming are Jackson, Rawlins, Rock Springs, Cheyenne, Torrington, Green River, Evanston, Riverton, Douglas, and Gillette.