Compare Greensboro to…
Greensboro SnackAbility
Overall SnackAbility
Crime in Greensboro summary. We use data from the FBI to determine the crime rates in Greensboro. Key points include:
There were 13,106 total crimes in Greensboro in the last reporting year.
The overall crime rate per 100,000 people in Greensboro is 4,306.8 / 100k people.
The violent crime rate per 100,000 people in Greensboro is 923.7 / 100k people.
The property crime rate per 100,000 people in Greensboro is 3,383.1 / 100k people.
Overall, crime in Greensboro is 103.23% above the national average.
Total Crimes
Above National Average
Crime In Greensboro Comparison Table
| Statistic | Count Raw | Greensboro / 100k People | North Carolina / 100k People | National / 100k People |
|---|---|---|---|---|
| Total Crimes Per 100K | 13,106 | 4,306.8 | 2,343.9 | 2,119.2 |
| Violent Crime | 2,811 | 923.7 | 375.8 | 359.0 |
| Murder | 43 | 14.1 | 7.5 | 5.0 |
| Robbery | 528 | 173.5 | 50.2 | 61.0 |
| Aggravated Assault | 2,160 | 709.8 | 290.1 | 256.0 |
| Property Crime | 10,295 | 3,383.1 | 1,968.1 | 1,760.0 |
| Burglary | 1,468 | 482.4 | 323.9 | 229.0 |
| Larceny | 7,024 | 2,308.2 | 1,390.2 | 1,272.0 |
| Car Theft | 1,803 | 592.5 | 254.1 | 259.0 |
Source: FBI Uniform Crime Reporting (2024)
Cost of living in Greensboro summary. We use data on the cost of living to determine how expensive it is to live in Greensboro. Real estate prices drive most of the variance in cost of living around North Carolina. Key points include:
The cost of living in Greensboro is 99 with 100 being average.
The cost of living in Greensboro is 1.0x lower than the national average.
The median home value in Greensboro is $264,427.
The median income in Greensboro is $61,515.
Greensboro's Overall Cost Of Living
Lower Than The National Average
Cost Of Living In Greensboro Comparison Table
| Living Expense | Greensboro | North Carolina | National Average |
|---|---|---|---|
| Overall | 99 | 95 | 100 |
| Services | 104 | 98 | 100 |
| Groceries | 103 | 98 | 100 |
| Health | 89 | 89 | 100 |
| Housing | 103 | 100 | 100 |
| Transportation | 102 | 97 | 100 |
| Utilities | 95 | 101 | 100 |
Source: Cost of living index, normalized to US average = 100
Greensboro, NC Weather
The average high in Greensboro is 69.6° and the average low is 47.7°.
There are 72.2 days of precipitation each year.
Expect an average of 43.8 inches of precipitation each year with 5.7 inches of snow.
| Stat | Greensboro |
|---|---|
| Average Annual High | 69.6 |
| Average Annual Low | 47.7 |
| Annual Precipitation Days | 72.2 |
| Average Annual Precipitation | 43.8 |
| Average Annual Snowfall | 5.7 |
Average High
Days of Rain
Source: NOAA climate normals (30-year)
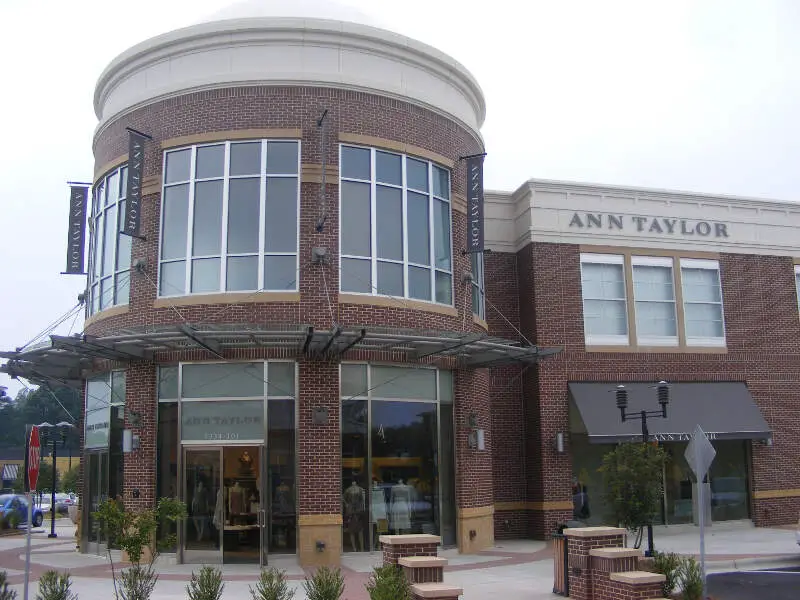
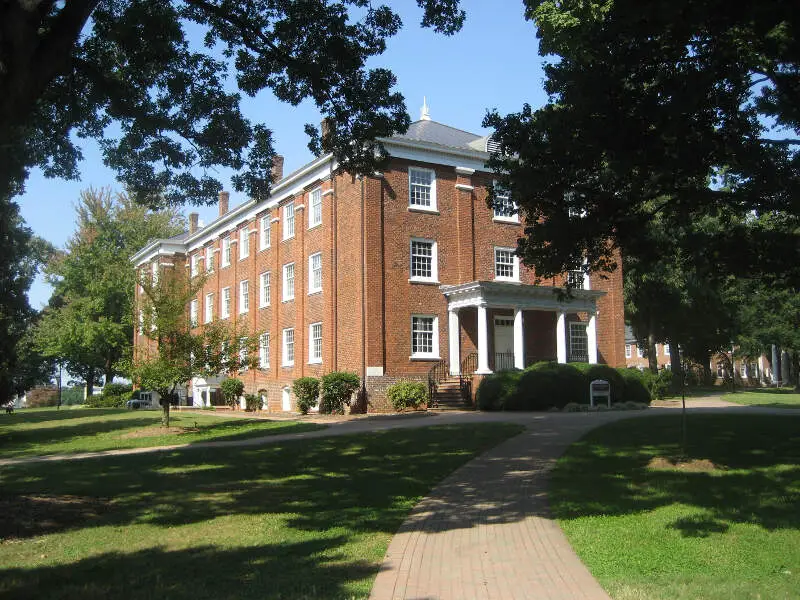
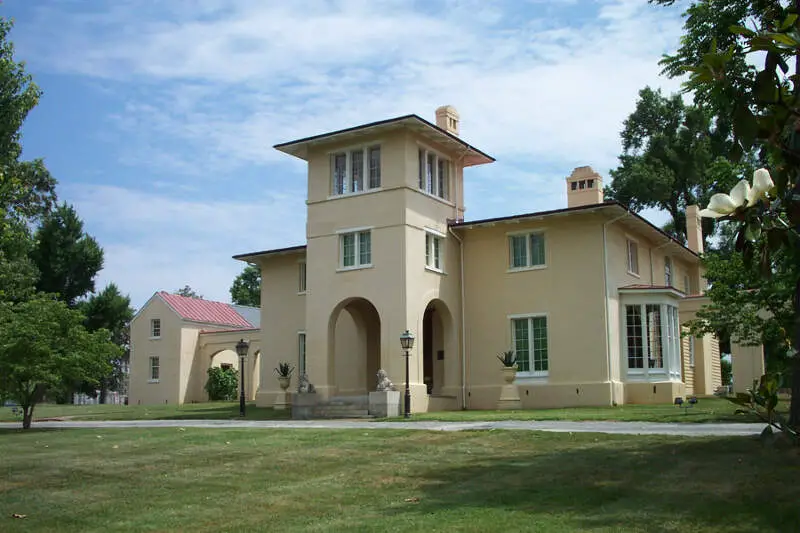
Greensboro, NC Photos


3 Reviews & Comments About Greensboro

It is pretty safe. Some areas are not safe closer to downtown communities. The schools are average here with the school district trying to improve. There is so much to do with shopping centers like the Friendly Shopping Center, city-sponsored events such as food trucks, festivals, competitions, museums, nature activities, etc.
My favorite place to go to is Bur Mil Park It is very pretty to walk around and has tons of recreational activities to participate in.
The crime was relatively low. I lived in a suburban area.
The park nearby was very nice. As well as the local food.
Crime getting worse. Downtown booming with lots to do.
Downtown. Core area.
Rankings & Articles For Greensboro


Locations Around Greensboro
Map Of Greensboro, NC
Best Places Around Greensboro
Oak Ridge, NC
Population 7,744
Summerfield, NC
Population 11,116
Gibsonville, NC
Population 9,467
Elon, NC
Population 11,032
Kernersville, NC
Population 27,830
Archdale, NC
Population 12,087
Stokesdale, NC
Population 6,004
High Point, NC
Population 116,245
Trinity, NC
Population 7,111
Burlington, NC
Population 59,610
Greensboro Demographics And Statistics
Population over time in Greensboro
The current population in Greensboro is 301,198. The population has increased 14.4% from 2010.
| Year | Population | % Change |
|---|---|---|
| 2024 | 301,198 | 0.9% |
| 2023 | 298,564 | 0.5% |
| 2022 | 297,202 | 0.6% |
| 2021 | 295,483 | 0.4% |
| 2020 | 294,395 | 1.1% |
| 2019 | 291,303 | 0.9% |
| 2018 | 288,719 | 1.4% |
| 2017 | 284,816 | 0.9% |
| 2016 | 282,177 | 1.0% |
| 2015 | 279,427 | 1.2% |
| 2014 | 276,225 | 1.1% |
| 2013 | 273,228 | 1.0% |
| 2012 | 270,619 | 1.3% |
| 2011 | 267,095 | 1.4% |
| 2010 | 263,358 | - |
Race / Ethnicity in Greensboro
See the full breakdown
Greensboro is:
38.1% White with 114,829 White residents.
41.0% African American with 123,556 African American residents.
0.2% American Indian with 468 American Indian residents.
5.2% Asian with 15,785 Asian residents.
0.0% Hawaiian with 27 Hawaiian residents.
0.7% Other with 2,160 Other residents.
4.2% Two Or More with 12,788 Two Or More residents.
10.5% Hispanic with 31,585 Hispanic residents.
| Race | Greensboro | NC | USA |
|---|---|---|---|
| White | 38.1% | 60.0% | 57.4% |
| African American | 41.0% | 20.0% | 11.9% |
| American Indian | 0.2% | 0.8% | 0.5% |
| Asian | 5.2% | 3.3% | 5.9% |
| Hawaiian | 0.0% | 0.1% | 0.2% |
| Other | 0.7% | 0.5% | 0.6% |
| Two Or More | 4.2% | 4.1% | 4.3% |
| Hispanic | 10.5% | 11.3% | 19.3% |
Gender in Greensboro
See the full breakdown
Greensboro is 53.7% female with 161,733 female residents.
Greensboro is 46.3% male with 139,465 male residents.
| Gender | Greensboro | NC | USA |
|---|---|---|---|
| Female | 53.7% | 51.1% | 50.5% |
| Male | 46.3% | 48.9% | 49.5% |
Highest level of educational attainment in Greensboro for adults over 25
See the full breakdown
3.0% of adults in Greensboro completed < 9th grade.
5.0% of adults in Greensboro completed 9-12th grade.
21.0% of adults in Greensboro completed high school / ged.
20.0% of adults in Greensboro completed some college.
9.0% of adults in Greensboro completed associate's degree.
25.0% of adults in Greensboro completed bachelor's degree.
12.0% of adults in Greensboro completed master's degree.
3.0% of adults in Greensboro completed professional degree.
2.0% of adults in Greensboro completed doctorate degree.
| Education | Greensboro | NC | USA |
|---|---|---|---|
| < 9th Grade | 3.0% | 3.0% | 4.0% |
| 9-12th Grade | 5.0% | 6.0% | 6.0% |
| High School / GED | 21.0% | 25.0% | 26.0% |
| Some College | 20.0% | 20.0% | 19.0% |
| Associate's Degree | 9.0% | 10.0% | 9.0% |
| Bachelor's Degree | 25.0% | 22.0% | 22.0% |
| Master's Degree | 12.0% | 10.0% | 10.0% |
| Professional Degree | 3.0% | 2.0% | 2.0% |
| Doctorate Degree | 2.0% | 2.0% | 2.0% |
Household Income For Greensboro, North Carolina
See the full breakdown
6.4% of households in Greensboro earn Less than $10,000.
4.7% of households in Greensboro earn $10,000 to $14,999.
7.5% of households in Greensboro earn $15,000 to $24,999.
8.6% of households in Greensboro earn $25,000 to $34,999.
13.5% of households in Greensboro earn $35,000 to $49,999.
18.2% of households in Greensboro earn $50,000 to $74,999.
12.7% of households in Greensboro earn $75,000 to $99,999.
14.6% of households in Greensboro earn $100,000 to $149,999.
6.2% of households in Greensboro earn $150,000 to $199,999.
7.5% of households in Greensboro earn $200,000 or more.
| Income | Greensboro | NC | USA |
|---|---|---|---|
| Less than $10,000 | 6.4% | 5.0% | 5.0% |
| $10,000 to $14,999 | 4.7% | 3.7% | 3.4% |
| $15,000 to $24,999 | 7.5% | 7.1% | 6.3% |
| $25,000 to $34,999 | 8.6% | 7.4% | 6.6% |
| $35,000 to $49,999 | 13.5% | 11.7% | 10.1% |
| $50,000 to $74,999 | 18.2% | 16.8% | 15.5% |
| $75,000 to $99,999 | 12.7% | 13.0% | 12.6% |
| $100,000 to $149,999 | 14.6% | 16.6% | 17.5% |
| $150,000 to $199,999 | 6.2% | 8.3% | 9.6% |
| $200,000 or more | 7.5% | 10.4% | 13.4% |
Source: U.S. Census ACS 5-year estimates (2024)


