Every city has safe neighborhoods and dangerous neighborhhods. We believe you should know which neighborhoods in Washington are the safest before you move.
Every year, more than 30 million Americans move. Sometimes, its for a job, other times its to escape the big city. But no matter where you move, you want a neighborhood thats family friendly, clean, and most importantly, safe.
Weve analyzed the FBI crime reports data on violent and property crimes for every single neighborhood in Washington. Then, we calculated your chances of being the victim of a crime in each one.
What Washington neighborhoods can you leave your doors unlocked at night? Heres the list.
Which neighborhood is the safest in Washington in 2025? That would be Au-Tenleytown. Thats according to the most recent FBI crime data, which takes into account everything from thefts and robberies to assaults and murders.
If you dont see a neighborhood youre looking for in our top , scroll down to the bottom, where we have all Washington neighborhoods listed in order from safest to most dangerous.
For more Washington Dc reading, check out:
- Safest Cities To Live In America
- Safest States To Live In America
- Worst neighborhoods in Washington
- Best neighborhoods to live in Washington.
Table Of Contents: Top 10 | Methodology | Summary | Table
The 10 Safest Neighborhoods To Live In Washington For 2025
1. Au-Tenleytown
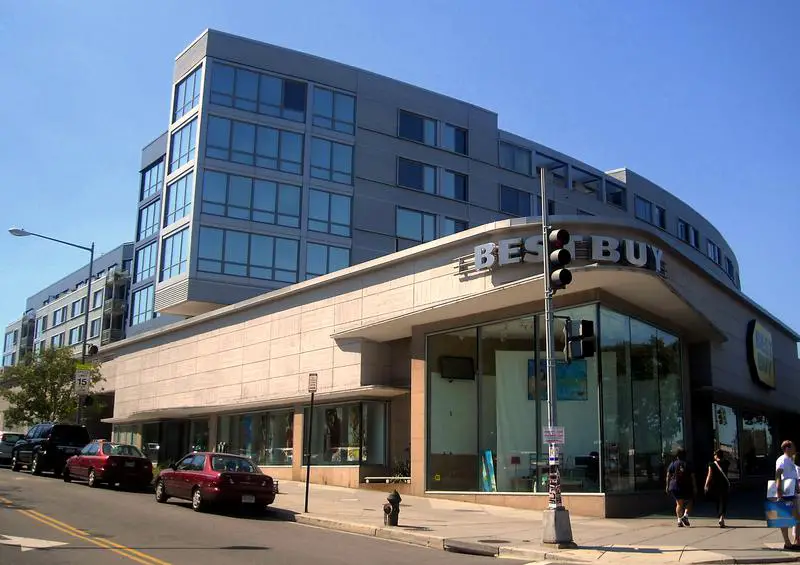
/10
Population: 18,855
Violent Crimes Per 100k: 113
Property Crime Per 100k: 1,054
2. Glover Park
/10
Population: 12,937
Violent Crimes Per 100k: 101
Property Crime Per 100k: 1,091
3. Cleveland Park
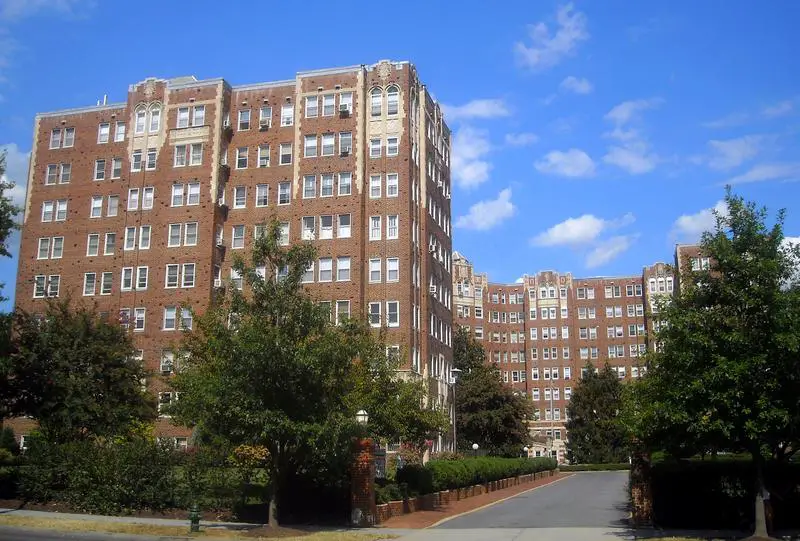
/10
Population: 11,732
Violent Crimes Per 100k: 132
Property Crime Per 100k: 1,669
4. The Palisades
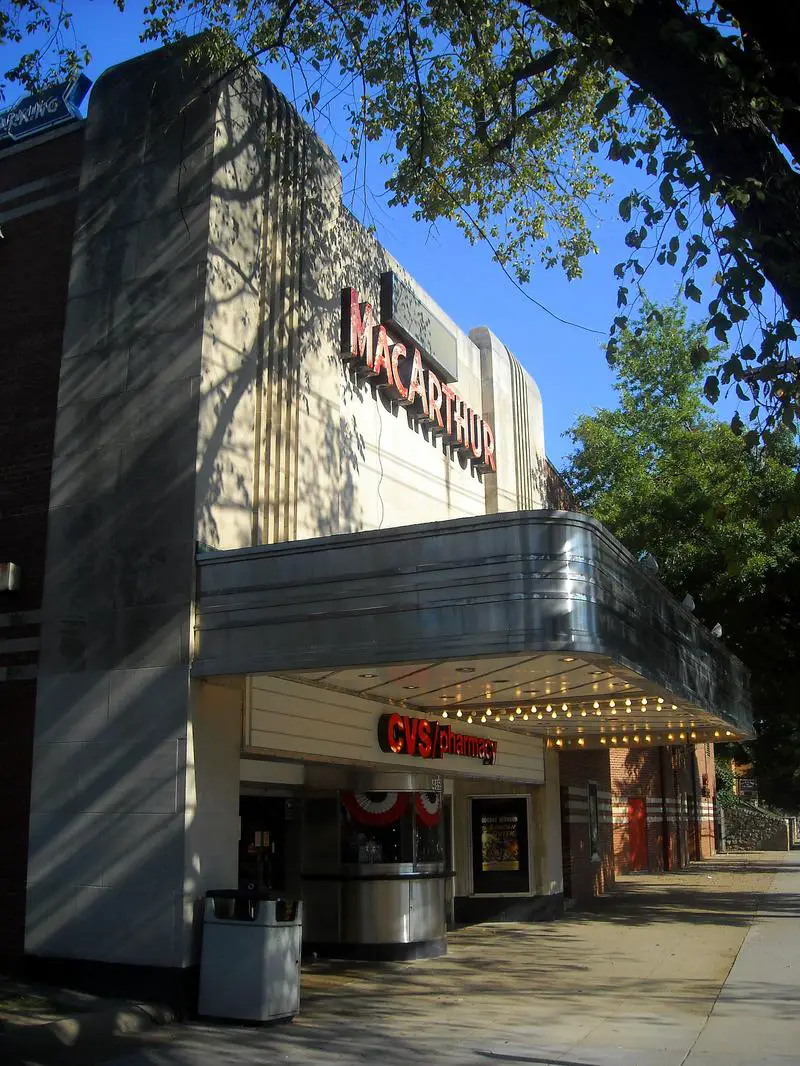
/10
Population: 3,598
Violent Crimes Per 100k: 198
Property Crime Per 100k: 1,575
5. Barnaby Woods
/10
Population: 9,436
Violent Crimes Per 100k: 25
Property Crime Per 100k: 1,285
6. Chevy Chase
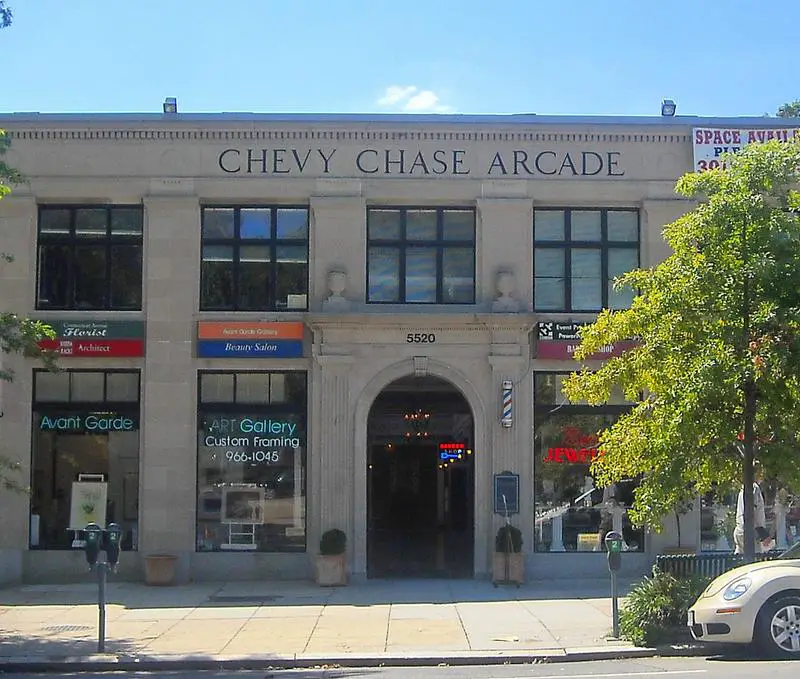
/10
Population: 18,506
Violent Crimes Per 100k: 186
Property Crime Per 100k: 2,138
7. Woodley Park
/10
Population: 7,667
Violent Crimes Per 100k: 202
Property Crime Per 100k: 2,295
8. Berkley
/10
Population: 2,252
Violent Crimes Per 100k: 454
Property Crime Per 100k: 1,803
9. Petworth
/10
Population: 11,886
Violent Crimes Per 100k: 1,000
Property Crime Per 100k: 3,387
10. Mount Pleasant
/10
Population: 12,696
Violent Crimes Per 100k: 234
Property Crime Per 100k: 2,372
Methodology: How We Determined The Safest Washington Hoods In 2025
You can ask people which neighborhoods are the safest, or you can look at the unbiased raw data. We choose data.
Instead of relying on speculation and opinion, we used Saturday Night Science to analyze the numbers from the FBI’s most recent crime report for every neighborhood in Washington.
To be more specific, we analyzed the FBI’s Uniform Crime Report. We then ran an analysis to calculate each neighborhood’s property and violent crimes per capita. We used the following criteria:
- Total Crimes Per Capita
- Violent Crimes Per Capita
- Property Crimes Per Capita
We then ranked each neighborhood with scores from 1 to 34 in each category, where 1 was the safest.
Next, we averaged the rankings for each neighborhood to create a safe neighborhood index.
Finally, we crowned the neighborhood with the lowest safest neighborhood index the “Safest City Neighborhood In Washington.” We’re lookin’ at you, Au-Tenleytown.
We updated this article for 2025. This is our fourth time ranking the safest neighborhoods in Washington.
Skip to the end to see the list of all the neighborhoods in the city, from safest to most expensive.
Summary: The Safest Places In Washington
Looking at the data, you can tell that Au-Tenleytown is as safe as they come, according to science and data.
The safest neighborhoods in Washington are Au-Tenleytown, Glover Park, Cleveland Park, The Palisades, Barnaby Woods, Chevy Chase, Woodley Park, Berkley, Petworth, and Mount Pleasant.
But as most Washington Dc residents would agree, almost every place here has its safe and not safe parts. So make sure you’re informed ahead of time.
The most dangerous neighborhoods in Washington are Mount Vernon Square, Dupont Circle, Capitol Hill, Friendship Heights, and Columbia Heights.
We ranked the neighborhoods from safest to most dangerous in the chart below.
For more Washington Dc reading, check out:
Detailed List Of The Safest Neighborhoods To Live In Washington For 2025
| Rank | Neighborhood | Crime Per 100K |
|---|---|---|
| 1 | Au-Tenleytown | 1,167 |
| 2 | Glover Park | 1,192 |
| 3 | Cleveland Park | 1,801 |
| 4 | The Palisades | 1,773 |
| 5 | Barnaby Woods | 1,310 |
| 6 | Chevy Chase | 2,324 |
| 7 | Woodley Park | 2,497 |
| 8 | Berkley | 2,257 |
| 9 | Petworth | 4,387 |
| 10 | Mount Pleasant | 2,606 |
| 11 | U Street Corridor | 10,387 |
| 12 | Foxhall Village | 3,324 |
| 13 | Downtown | 5,794 |
| 14 | Adams Morgan | 3,512 |
| 15 | Anacostia | 5,327 |
| 16 | Takoma Park | 3,879 |
| 17 | South West | 6,499 |
| 18 | Brightwood | 3,717 |
| 19 | Stadium-Armory | 6,336 |
| 20 | Ledroit Park | 6,521 |
| 21 | Catholic University-Brookland | 3,988 |
| 22 | Kalorama | 4,541 |
| 23 | Fort Totten-Upper Northeast | 4,042 |
| 24 | Logan Circle | 5,060 |
| 25 | Foggy Bottom | 5,085 |
| 26 | Shaw | 8,642 |
| 27 | Brentwood | 9,030 |
| 28 | Georgetown | 7,334 |
| 29 | Deanwood | 8,641 |
| 30 | Columbia Heights | 5,659 |
| 31 | Friendship Heights | 7,951 |
| 32 | Capitol Hill | 6,596 |
| 33 | Dupont Circle | 7,350 |
| 34 | Mount Vernon Square | 9,438 |


