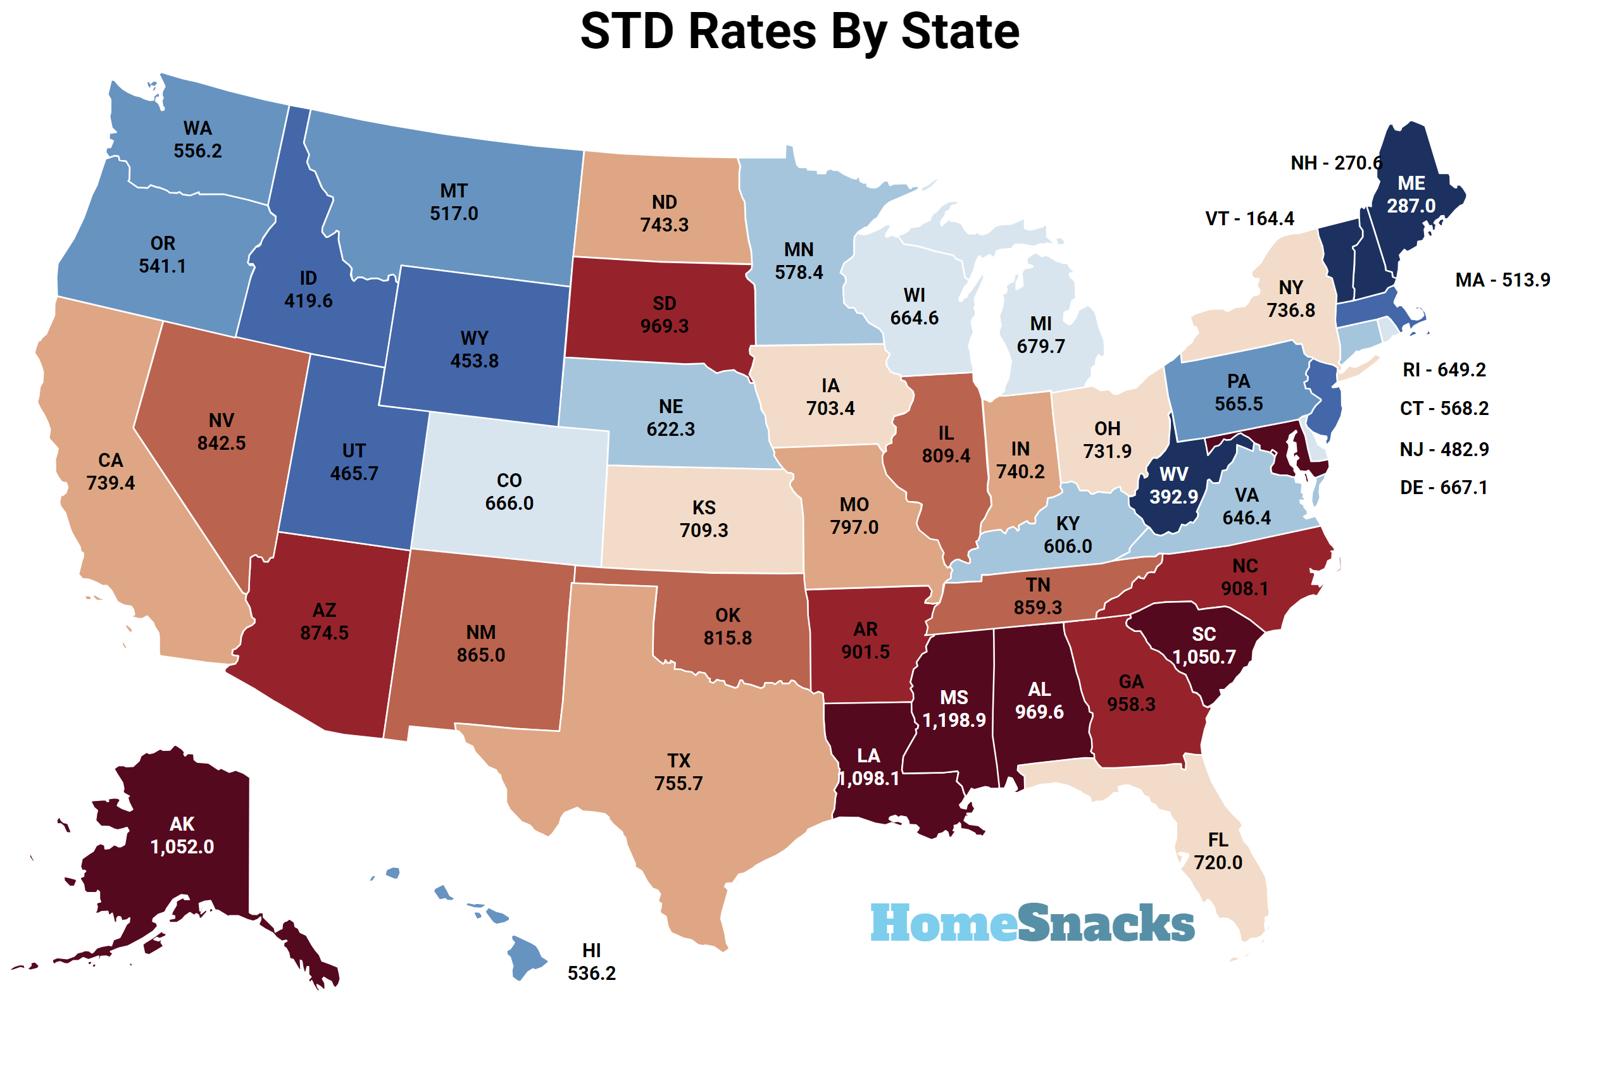
STD rates by state in the United States research summary. The data team at HomeSnacks used Saturday Night Science to analyze STD data by state from the CDC. The CDC tracks cases of chlamydia, gonorrea, and syphilis. Note that the trends in diagnosed and reported STDs, along with data collected through enhanced and sentinel STD surveillance activities at the CDC, were influenced by the COVID-19 pandemic. These are the key takeaways:
-
There were a total of 2,288,491 STDs reported in the last reporting year.
-
The average STD rate in the United States is 684.7 per 100k.
-
The state with the highest overall STD rate in the United States is Louisiana with a rate of 1,097.8 per 100k.
-
The state with the highest rate of chlamydia in the United States is Louisiana with a rate of 785.8 per 100k.
-
The state with the highest rate of gonorrea in the United States is Alaska with a rate of 309.9 per 100k.
-
The state with the highest rate of syphilis in the United States is South Dakota with a rate of 74.4 per 100k.
-
Vermont has the lowest STD rate in the United States with a rate of 236.4 per 100k.
Map: States With the Highest Rate Of STDs In The United States
The United States witnessed a surge in reported cases of chlamydia, gonorrhea, and syphilis in 2023, with a particular focus on demographic disparities, affecting racial/ethnic minorities and gay, bisexual, and other men who have sex with men. Congenital syphilis saw a significant increase, especially among American Indian and Alaska Native infants. The resurgence of syphilis since 2000-2001 is a major concern, concentrated in specific geographic areas like California and Texas.
Because of the significant regional variance, we broke down the rates of STDs by states focusing on the states with the highest and lowest rates of STD.
The 10 States With The Highest STD Rates
Here is a breakdown of the ten states with the highest STD rates in the United States on a per capita basis. Louisiana has the highest rate of STDs at 1,097.8. Alaska and Mississippi also have high rates of STDs. The Southern United States, in particular, is a hotbed for STDs based on the most recent CDC data.
- Louisiana – 1,097.8 STDs Per 100K
- Alaska – 1,027.9 STDs Per 100K
- Mississippi – 979.7 STDs Per 100K
- Georgia – 948.9 STDs Per 100K
- Alabama – 910.5 STDs Per 100K
- North Carolina – 879.5 STDs Per 100K
- South Dakota – 869.6 STDs Per 100K
- South Carolina – 864.1 STDs Per 100K
- Arkansas – 807.0 STDs Per 100K
- Maryland – 797.9 STDs Per 100K
The 10 States With The Lowest STD Rates
Here is a breakdown of the ten states with the lowest STD rates in the United States on a per capita basis. Vermont has the lowest rate of STDs at 236.4. New Hampshire and Maine also have STD rates significantly lower than the national average. The Northern United States generally has lower rates of STDs.
- Vermont – 236.4 STDs Per 100K
- New Hampshire – 243.7 STDs Per 100K
- Maine – 268.6 STDs Per 100K
- West Virginia – 313.1 STDs Per 100K
- Idaho – 343.5 STDs Per 100K
- Wyoming – 358.7 STDs Per 100K
- Utah – 412.6 STDs Per 100K
- Montana – 423.9 STDs Per 100K
- Connecticut – 484.5 STDs Per 100K
- Oregon – 496.3 STDs Per 100K
Table: STD Rates By State In The United States
| Rank | State | Population | STDs Per 100K | Syphilis Per 100K | Chlamydia Per 100K | Gonorrhea Per 100K |
|---|---|---|---|---|---|---|
| 1 | Louisiana | 4,611,961 | 1,097.8 | 25.9 | 785.8 | 286.0 |
| 2 | Alaska | 735,706 | 1,027.9 | 22.4 | 695.5 | 309.9 |
| 3 | Mississippi | 2,946,779 | 979.7 | 30.1 | 699.2 | 250.5 |
| 4 | Georgia | 10,940,407 | 948.9 | 20.2 | 651.7 | 277.0 |
| 5 | Alabama | 5,086,768 | 910.5 | 28.7 | 653.9 | 227.9 |
| 6 | North Carolina | 10,730,404 | 879.5 | 20.1 | 613.8 | 245.6 |
| 7 | South Dakota | 907,428 | 869.6 | 74.4 | 538.6 | 256.7 |
| 8 | South Carolina | 5,296,225 | 864.1 | 17.5 | 621.0 | 225.6 |
| 9 | Arkansas | 3,049,391 | 807.0 | 29.4 | 583.1 | 194.5 |
| 10 | Maryland | 6,206,011 | 797.9 | 14.1 | 577.4 | 206.3 |
| 11 | New York | 19,852,366 | 797.3 | 14.5 | 550.5 | 232.2 |
| 12 | Arizona | 7,378,838 | 772.8 | 24.3 | 556.4 | 192.1 |
| 13 | Illinois | 12,694,798 | 762.8 | 11.5 | 551.3 | 200.0 |
| 14 | Florida | 22,416,077 | 731.2 | 19.5 | 503.2 | 208.4 |
| 15 | Delaware | 1,021,191 | 729.5 | 17.6 | 558.5 | 153.4 |
| 16 | New Mexico | 2,120,246 | 727.2 | 36.5 | 522.2 | 168.6 |
| 17 | Tennessee | 7,066,383 | 724.7 | 14.9 | 521.8 | 188.0 |
| 18 | Nevada | 3,184,612 | 723.1 | 22.8 | 495.1 | 205.3 |
| 19 | Missouri | 6,191,814 | 722.5 | 21.5 | 498.9 | 202.1 |
| 20 | California | 39,287,377 | 691.8 | 16.2 | 487.1 | 188.6 |
| 21 | Texas | 30,188,424 | 690.4 | 15.1 | 497.1 | 178.2 |
| 22 | Oklahoma | 4,028,634 | 673.4 | 27.8 | 474.2 | 171.4 |
| 23 | Indiana | 6,851,073 | 644.8 | 8.7 | 491.8 | 144.2 |
| 24 | Ohio | 11,810,293 | 644.6 | 16.3 | 460.7 | 167.6 |
| 25 | Virginia | 8,705,170 | 642.5 | 10.7 | 473.4 | 158.5 |
| 26 | Rhode Island | 1,101,801 | 638.1 | 8.2 | 478.2 | 151.8 |
| 27 | Kansas | 2,947,197 | 609.9 | 13.5 | 452.8 | 143.7 |
| 28 | North Dakota | 784,841 | 595.3 | 12.4 | 435.9 | 147.0 |
| 29 | Nebraska | 1,978,707 | 594.5 | 10.4 | 468.7 | 115.5 |
| 30 | Michigan | 10,077,761 | 587.8 | 8.4 | 427.8 | 151.6 |
| 31 | Colorado | 5,862,189 | 581.2 | 16.0 | 436.2 | 129.0 |
| 32 | Pennsylvania | 13,018,639 | 572.5 | 9.1 | 419.4 | 144.1 |
| 33 | Hawaii | 1,445,235 | 570.9 | 12.6 | 432.5 | 125.8 |
| 34 | Massachusetts | 7,044,056 | 559.6 | 10.5 | 410.2 | 138.9 |
| 35 | Iowa | 3,210,507 | 553.3 | 10.3 | 426.3 | 116.7 |
| 36 | Wisconsin | 5,914,872 | 550.1 | 9.1 | 422.5 | 118.5 |
| 37 | Kentucky | 4,534,824 | 529.3 | 14.1 | 381.1 | 134.1 |
| 38 | Minnesota | 5,739,445 | 522.6 | 8.7 | 379.4 | 134.5 |
| 39 | Washington | 7,816,116 | 505.1 | 21.3 | 354.2 | 129.6 |
| 40 | New Jersey | 9,343,809 | 498.4 | 8.0 | 382.0 | 108.5 |
| 41 | Oregon | 4,254,293 | 496.3 | 19.1 | 360.7 | 116.6 |
| 42 | Connecticut | 3,624,508 | 484.5 | 7.3 | 364.1 | 113.1 |
| 43 | Montana | 1,116,875 | 423.9 | 27.9 | 327.3 | 68.7 |
| 44 | Utah | 3,392,331 | 412.6 | 9.7 | 324.4 | 78.5 |
| 45 | Wyoming | 582,397 | 358.7 | 2.2 | 314.0 | 42.4 |
| 46 | Idaho | 1,934,262 | 343.5 | 3.8 | 299.5 | 40.2 |
| 47 | West Virginia | 1,778,373 | 313.1 | 10.9 | 247.8 | 54.4 |
| 48 | Maine | 1,387,817 | 268.6 | 5.3 | 218.6 | 44.7 |
| 49 | New Hampshire | 1,394,868 | 243.7 | 3.9 | 197.6 | 42.2 |
| 50 | Vermont | 647,106 | 236.4 | 0.5 | 202.0 | 34.0 |
Methodology: Determining STD Rates By State
We used Saturday Night Science to analyze STDs data by state from the CDC. The CDC figures come from the Sexually Transmitted Disease Surveillance, 2023 cohort. Data collection from this cohort was impacted by Covid 2019, so it may not align with historical trends.
Using the survey results, we ranked each state from the highest to the lowest rate of STDs. We summed up the results from the reports on gonorrhea, syphilis, and chlamydia. The results showed that the state with the highest for 2026 is Louisiana.
Conclusion: STD Rates By States
The data highlights significant regional variations in STD rates. The states with the highest rates are concentrated in the Southern and Western parts of the United States.
The United States experienced a surge in reported cases of chlamydia, gonorrhea, and syphilis, with a focus on demographic disparities and particular impact on racial/ethnic minorities and men who have sex with men.
The resurgence of STDs since 2000-2001 is a primary concern, with specific geographic concentrations such as Louisiana dealing with significant outbreaks.


