Whitest cities in Texas research summary. We analyzed Texas’s most recent Census data to determine the whitest cities in Texas based on the percentage of White residents.
90.1% White · #1 whitest in Texas
Gun Barrel City is a city in Henderson County, Texas, United States. The population was 5,672 at the 2010 Census.
Data | Crime | Cost of living | Movers
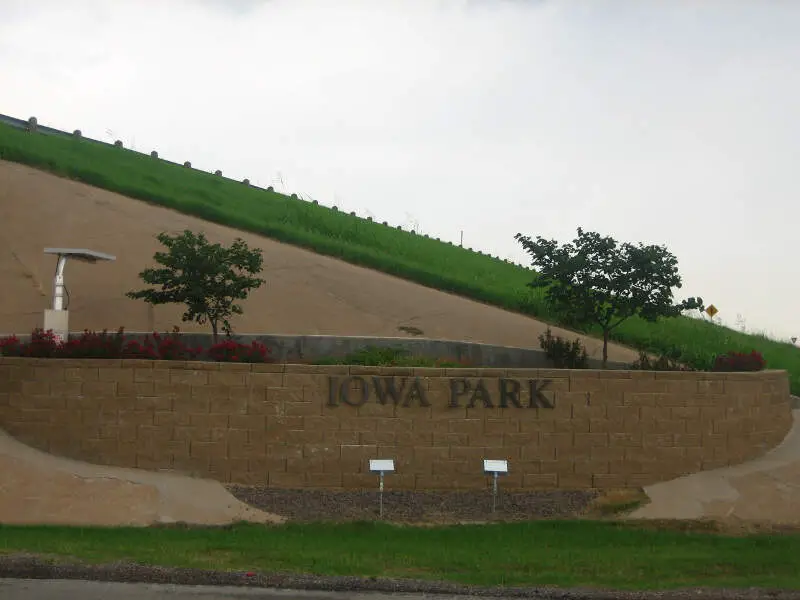
90.0% White · #2 whitest in Texas
Iowa Park is a city in Wichita County, Texas, United States. It is part of the Wichita Falls, Texas Metropolitan Statistical Area. The population was 6,355 at the 2010 census.
Data | Crime | Cost of living | Movers
89.9% White · #3 whitest in Texas
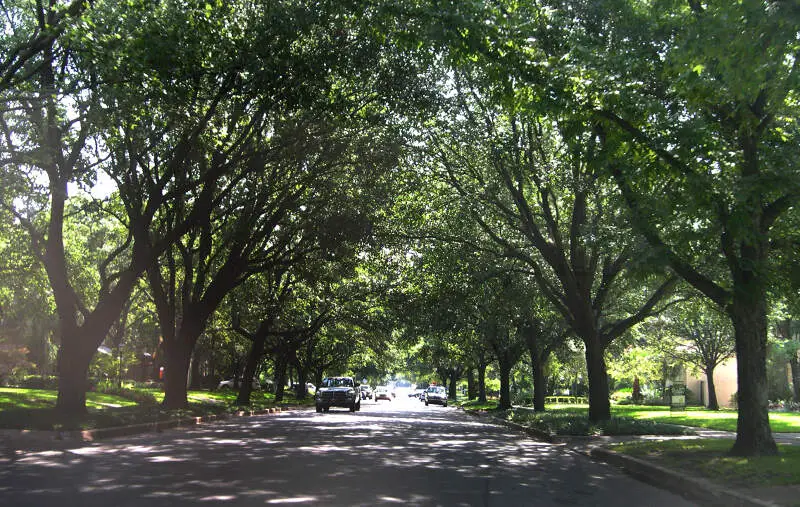
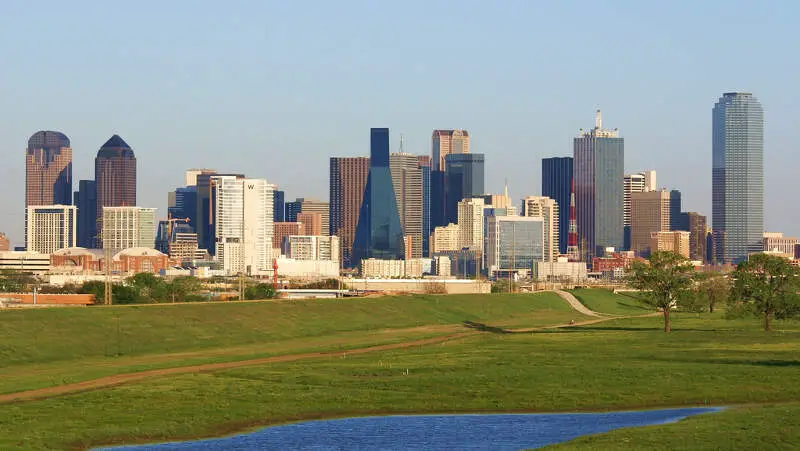
Highland Park is a town in central Dallas County, Texas, United States. It is among the five wealthiest locations in Texas, and the most affluent suburb of Dallas. The population was 8,564 at the 2010 census. It is located between the Dallas North Tollway and U.S. Route 75, 4 miles north of downtown Dallas.
Data | Crime | Cost of living | Movers
89.0% White · #4 whitest in Texas
Data | Crime | Cost of living | Movers
86.4% White · #5 whitest in Texas
Heath is a city in Rockwall and Kaufman Counties, Texas, United States. The population was 6,921 at the 2010 census. It is part of the Dallas-Fort Worth metroplex.
Data | Crime | Cost of living | Movers
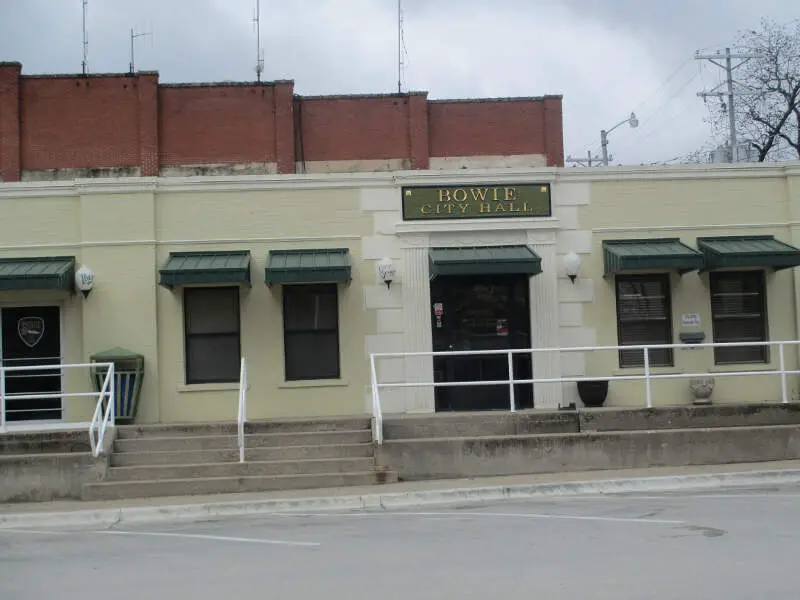
85.4% White · #6 whitest in Texas
Bowie is a town in Montague County, Texas, United States. The population was 5,218 at the 2010 census.
Data | Crime | Cost of living | Movers
84.8% White · #7 whitest in Texas
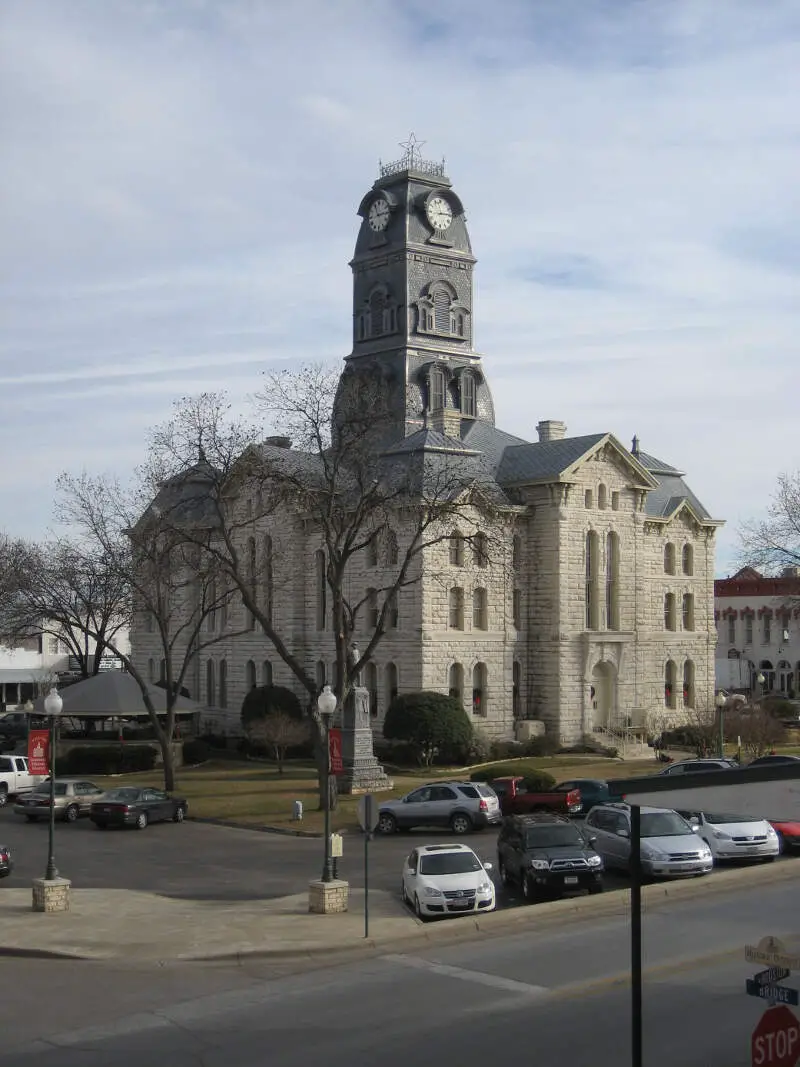
Granbury is a city and the county seat of Hood County, Texas, United States. As of the 2010 census, the city population was 7,978 and is the principal city of the Granbury Micropolitan Statistical Area. Granbury is located 35 miles southwest of Fort Worth, Texas.
Data | Crime | Cost of living | Movers
84.5% White · #8 whitest in Texas
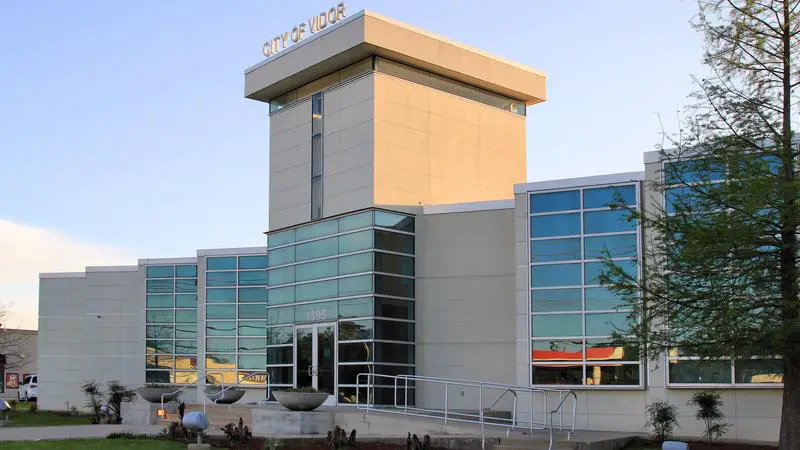
Vidor is a city in western Orange County, Texas, United States. A city of Southeast Texas, it lies at the intersection of Interstate 10 and Farm to Market Road 105, six miles east of Beaumont. The town is mainly a bedroom community for the nearby refining complexes in Beaumont and Port Arthur and is part of the Beaumont-Port Arthur Metropolitan Statistical Area. The population was 10,579 at the 2010 census.
Data | Crime | Cost of living | Movers
81.3% White · #9 whitest in Texas
Woodway is a city in McLennan County, Texas, United States. The population was 8,861 at the 2010 census. It is part of the Waco Metropolitan Statistical Area.
Data | Crime | Cost of living | Movers
80.0% White · #10 whitest in Texas
University Park is a city in Dallas County, Texas, United States, an inner northern suburb of Dallas. The population was 23,068 at the 2010 census. The city is home to Southern Methodist University.
Data | Crime | Cost of living | Movers
The receipts
Compare the top ten
Pick a metric. The bars rescale. The red line is Texas’s statewide median.
On the map
Where Texas’s White population is concentrated
Saturday Night Science
Methodology: How we determined the whitest places in Texas for 2026
To rank the whitest places in Texas, we used Saturday Night Science to look at Census demographic data.
We had to look at the number of white people living in each city in Texas on a per capita basis. In other words, the percentage of white people living in each city in Texas.
We looked at table B03002: Hispanic OR LATINO ORIGIN BY RACE. Here are the category names as defined by the Census:
- Hispanic or Latino
- White alone*
- Black or African American alone*
- American Indian and Alaska Native alone*
- Asian alone*
- Native Hawaiian and Other Pacific Islander alone*
- Some other race alone*
- Two or more races*
Our particular column of interest here was the number of people who identified as White alone.
We limited our analysis to places with a population greater than 5,000 people. That left us with 324 cities.
We then calculated the percentage of residents that are White. The percentages ranked from 90.1% to 0.8%.
Finally, we ranked each city based on the percentage of the White population, with a higher percentage being more White. Gun Barrel City took the distinction of being the most White, while Hidalgo was the least White city.
We updated this article for 2026. This report represents our eleventh time ranking the whitest cities in Texas.
The full plate
Cities In Texas By White Population
Click any column to sort. Search by city name.
| Rank | City | Population | White Population | % White |
|---|---|---|---|---|
| 1 | Gun Barrel City | 6,570 | 5,917 | 90.1% |
| 2 | Iowa Park | 6,578 | 5,922 | 90.0% |
| 3 | Highland Park | 8,773 | 7,888 | 89.9% |
| 4 | Lumberton | 13,963 | 12,427 | 89.0% |
| 5 | Heath | 10,777 | 9,310 | 86.4% |
| 6 | Bowie | 5,770 | 4,926 | 85.4% |
| 7 | Granbury | 12,136 | 10,289 | 84.8% |
| 8 | Vidor | 9,708 | 8,204 | 84.5% |
| 9 | Woodway | 9,570 | 7,782 | 81.3% |
| 10 | University Park | 25,155 | 20,118 | 80.0% |
| 11 | Port Neches | 13,664 | 10,820 | 79.2% |
| 12 | Burkburnett | 11,059 | 8,648 | 78.2% |
| 13 | Highland Village | 16,101 | 12,511 | 77.7% |
| 14 | Fredericksburg | 11,419 | 8,837 | 77.4% |
| 15 | Nederland | 18,381 | 14,183 | 77.2% |
| 16 | Lakeway | 19,307 | 14,884 | 77.1% |
| 17 | Weatherford | 35,788 | 27,481 | 76.8% |
| 18 | Keller | 45,976 | 35,117 | 76.4% |
| 19 | Trophy Club | 13,733 | 10,481 | 76.3% |
| 20 | Burnet | 6,732 | 5,133 | 76.2% |
| 21 | Whitehouse | 9,122 | 6,954 | 76.2% |
| 22 | Rockport | 10,683 | 8,114 | 76.0% |
| 23 | Azle | 14,126 | 10,717 | 75.9% |
| 24 | Bridge City | 9,640 | 7,262 | 75.3% |
| 25 | Lago Vista | 9,650 | 7,237 | 75.0% |
| 26 | Fair Oaks Ranch | 10,728 | 8,037 | 74.9% |
| 27 | Canyon | 15,723 | 11,748 | 74.7% |
| 28 | Fairview | 10,783 | 7,964 | 73.9% |
| 29 | Alamo Heights | 7,492 | 5,507 | 73.5% |
| 30 | Joshua | 8,550 | 6,278 | 73.4% |
| 31 | Friendswood | 41,030 | 29,465 | 71.8% |
| 32 | Marble Falls | 7,752 | 5,565 | 71.8% |
| 33 | West University Place | 14,982 | 10,709 | 71.5% |
| 34 | Richland Hills | 8,493 | 6,070 | 71.5% |
| 35 | Stephenville | 21,682 | 15,487 | 71.4% |
| 36 | Sanger | 9,641 | 6,778 | 70.3% |
| 37 | Gladewater | 6,227 | 4,330 | 69.5% |
| 38 | Graham | 8,792 | 6,094 | 69.3% |
| 39 | Colleyville | 26,012 | 18,011 | 69.2% |
| 40 | Lampasas | 7,671 | 5,292 | 69.0% |
| 41 | Southlake | 31,137 | 21,452 | 68.9% |
| 42 | White Oak | 6,235 | 4,265 | 68.4% |
| 43 | Decatur | 7,426 | 5,074 | 68.3% |
| 44 | Santa Fe | 12,901 | 8,808 | 68.3% |
| 45 | Kerrville | 24,755 | 16,780 | 67.8% |
| 46 | Hewitt | 16,432 | 11,037 | 67.2% |
| 47 | Denison | 25,778 | 17,148 | 66.5% |
| 48 | Georgetown | 85,999 | 56,962 | 66.2% |
| 49 | Rockdale | 5,523 | 3,621 | 65.6% |
| 50 | Burleson | 52,918 | 34,692 | 65.6% |
| 51 | Rockwall | 51,168 | 33,402 | 65.3% |
| 52 | Seabrook | 13,768 | 8,982 | 65.2% |
| 53 | Midlothian | 39,356 | 25,545 | 64.9% |
| 54 | Benbrook | 24,557 | 15,850 | 64.5% |
| 55 | Carthage | 6,601 | 4,238 | 64.2% |
| 56 | North Richland Hills | 70,780 | 45,402 | 64.1% |
| 57 | Flower Mound | 78,389 | 50,235 | 64.1% |
| 58 | Corinth | 23,385 | 14,942 | 63.9% |
| 59 | Buda | 15,859 | 10,081 | 63.6% |
| 60 | Mineral Wells | 15,244 | 9,567 | 62.8% |
| 61 | Sulphur Springs | 16,401 | 10,224 | 62.3% |
| 62 | Brownwood | 18,777 | 11,705 | 62.3% |
| 63 | League City | 116,215 | 72,394 | 62.3% |
| 64 | Robinson | 12,800 | 7,931 | 62.0% |
| 65 | Grapevine | 51,139 | 31,647 | 61.9% |
| 66 | Boerne | 20,518 | 12,598 | 61.4% |
| 67 | Sherman | 46,397 | 28,321 | 61.0% |
| 68 | Tomball | 13,655 | 8,266 | 60.5% |
| 69 | Wake Village | 5,867 | 3,538 | 60.3% |
| 70 | Bonham | 10,697 | 6,425 | 60.1% |
| 71 | New Braunfels | 104,643 | 62,689 | 59.9% |
| 72 | Bellaire | 17,206 | 10,244 | 59.5% |
| 73 | College Station | 124,570 | 73,989 | 59.4% |
| 74 | Prosper | 37,869 | 22,470 | 59.3% |
| 75 | Roanoke | 10,286 | 6,091 | 59.2% |
| 76 | Royse City | 20,037 | 11,840 | 59.1% |
| 77 | Borger | 12,226 | 7,213 | 59.0% |
| 78 | Atlanta | 5,439 | 3,193 | 58.7% |
| 79 | Bastrop | 11,156 | 6,496 | 58.2% |
| 80 | Gainesville | 17,883 | 10,408 | 58.2% |
| 81 | Bedford | 49,085 | 28,541 | 58.1% |
| 82 | Watauga | 23,233 | 13,420 | 57.8% |
| 83 | Lake Dallas | 7,822 | 4,511 | 57.7% |
| 84 | Pampa | 16,659 | 9,601 | 57.6% |
| 85 | Livingston | 5,718 | 3,294 | 57.6% |
| 86 | Paris | 24,775 | 14,215 | 57.4% |
| 87 | Lake Jackson | 27,974 | 16,042 | 57.3% |
| 88 | Anna | 24,330 | 13,930 | 57.3% |
| 89 | Henderson | 13,385 | 7,643 | 57.1% |
| 90 | Wichita Falls | 102,581 | 58,575 | 57.1% |
| 91 | Silsbee | 6,842 | 3,885 | 56.8% |
| 92 | Abilene | 128,053 | 72,685 | 56.8% |
| 93 | Breckenridge | 5,170 | 2,917 | 56.4% |
| 94 | Kaufman | 8,538 | 4,772 | 55.9% |
| 95 | Keene | 6,691 | 3,739 | 55.9% |
| 96 | Cedar Park | 78,301 | 43,621 | 55.7% |
| 97 | Brady | 5,230 | 2,910 | 55.6% |
| 98 | Orange | 19,177 | 10,618 | 55.4% |
| 99 | Hurst | 39,861 | 22,070 | 55.4% |
| 100 | Groves | 16,976 | 9,397 | 55.4% |
Source: U.S. Census ACS 2020-2024. 324 cities with more than 5,000 residents.
Summary
Summary: White Populations Across Texas
We measured the locations with the highest percentage of white people in Texas. According to the most recent data, this list provides accurate information on the whitest places in Texas.
The most White cities in Texas are Gun Barrel City, Iowa Park, Highland Park, Lumberton, Heath, Bowie, Granbury, Vidor, Woodway, and University Park. Not sold on Texas? Take the two-minute Find Your Place quiz and see which state actually fits you.


