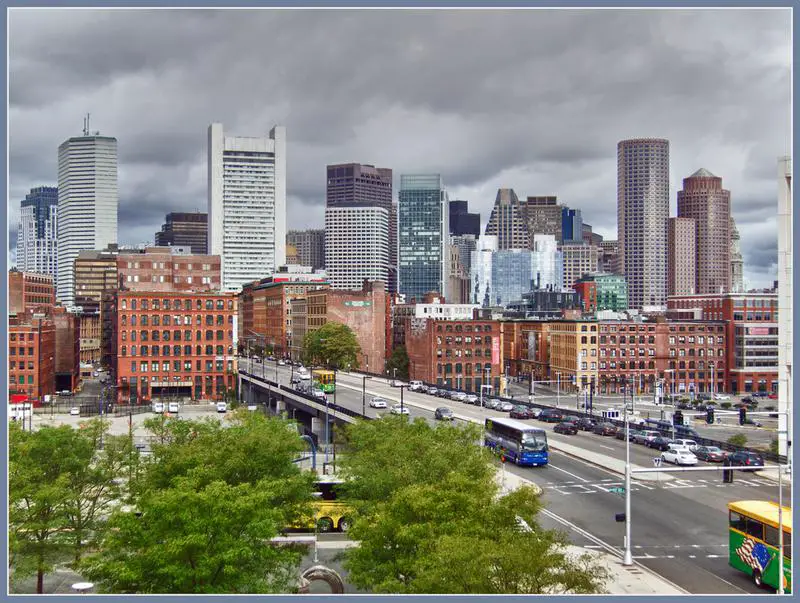
Boston’s neighborhoods conjure up too many stereotypes to count. You’ve got hipster areas, preppy places, neighborhoods where college kids thrive, and of course, ghettos.
It seems as if there’s a neighborhood for everyone in Boston.
And while the city consistently ranks as one of the best places to live in Massachusetts thanks in part to tons of entertainment and jobs, it’s not all rainbows and sunshine in Boston. Some neighborhoods aren’t as safe as others.
So the question arises, which Boston neighborhoods are the most dangerous and which are the safest?
Today, we’ll use Saturday Night Science to determine which Boston hoods need a little tender loving care – the sore thumbs of the Boston area if you will. Realistically, you can’t expect all the neighborhoods to be amazing, although Charlestown ranks way above the rest.
We examined 16 of Boston’s neighborhoods to find out the most dangerous places to live. These places don’t quite measure up to Boston’s reputation.
Table Of Contents: Top 10 | Methodology | Summary | Table
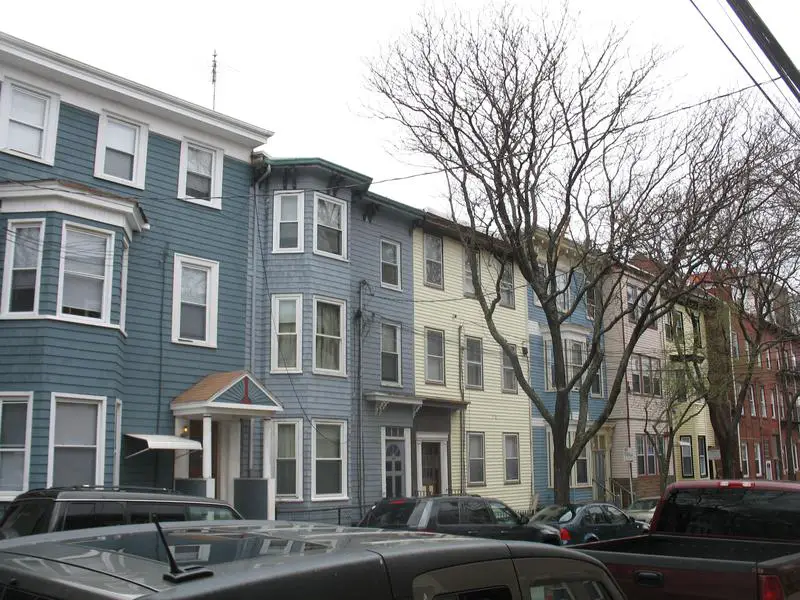
So what’s the worst neighborhood to live in Boston for 2025? According to the most recent census data, Roxbury looks to be the worst neighborhood in Boston.
Read on to see how we determined the places around Boston that need a pick-me-up. And remember, don’t blame the messenger.
For more Massachusetts reading, check out:
- Best Places To Live In Massachusetts
- Cheapest Places To Live In Massachusetts
- Most Dangerous Cities In Massachusetts
The 10 Most Dangerous Neighborhoods In Boston For 2025
/10
Population: 58,696
Violent Crimes Per 100k: 1,285
Property Crime Per 100k: 2,585
Median Home Value: $536,559 (7th worst)
Median Income: $39,763 (worst)
More on Roxbury: Data
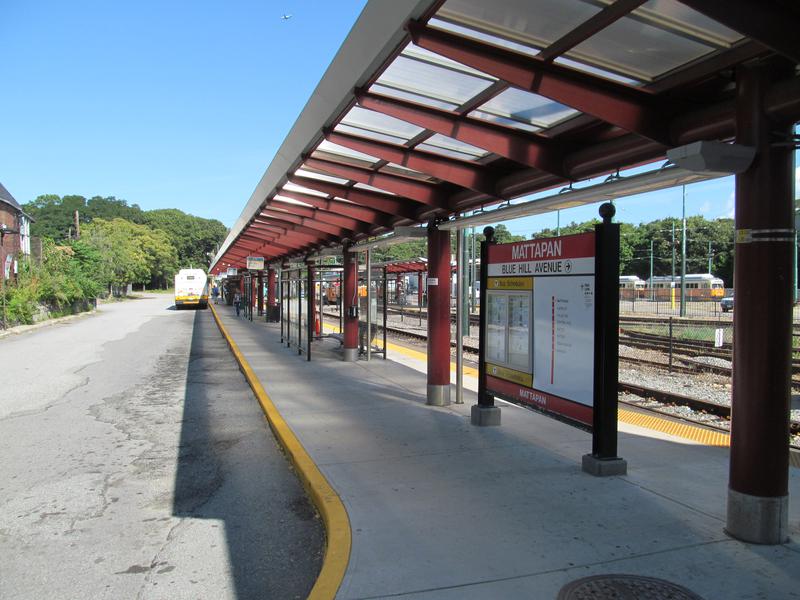
/10
Population: 42,727
Violent Crimes Per 100k: 771
Property Crime Per 100k: 1,304
Median Home Value: $455,068 (4th worst)
Median Income: $59,871 (3rd worst)
More on Mattapan: Data
/10
Population: 38,280
Violent Crimes Per 100k: 350
Property Crime Per 100k: 1,910
Median Home Value: $241,970 (worst)
Median Income: $48,949 (2nd worst)
More on Fenway-Kenmore: Data
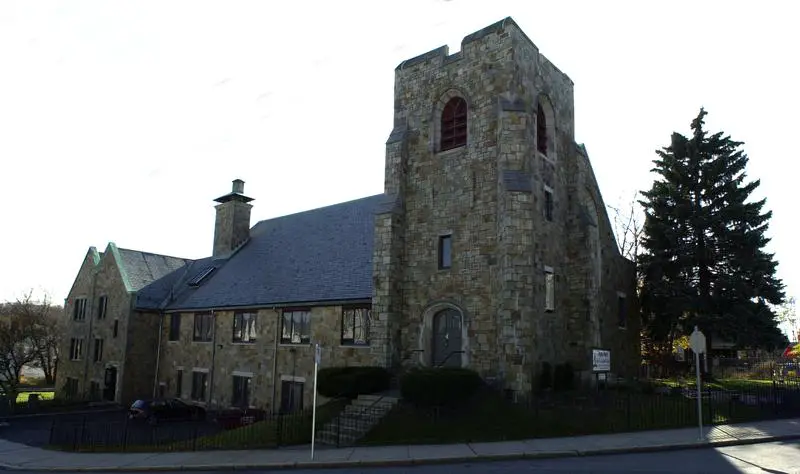
/10
Population: 38,370
Violent Crimes Per 100k: 391
Property Crime Per 100k: 1,126
Median Home Value: $433,932 (3rd worst)
Median Income: $85,927 (8th worst)
More on Hyde Park: Data
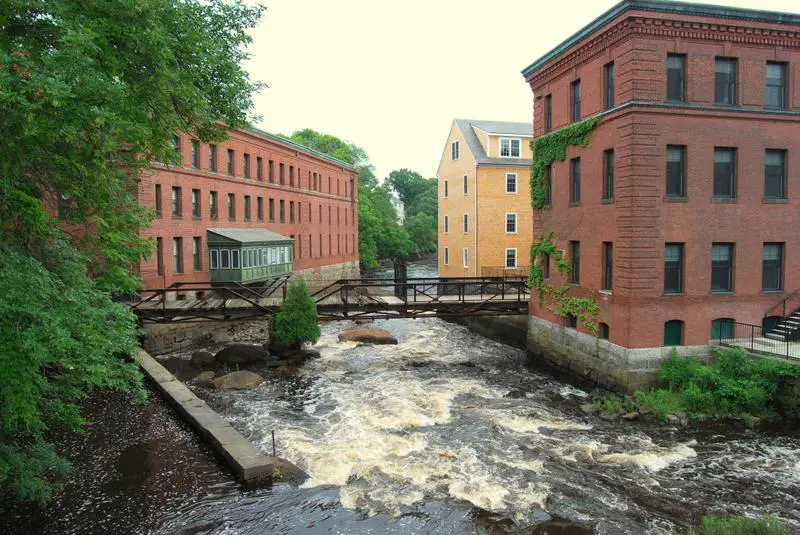
/10
Population: 26,430
Violent Crimes Per 100k: 727
Property Crime Per 100k: 2,887
Median Home Value: $574,240 (10th worst)
Median Income: $78,922 (7th worst)
More on North Dorchester: Data
/10
Population: 68,359
Violent Crimes Per 100k: 769
Property Crime Per 100k: 1,665
Median Home Value: $499,479 (5th worst)
Median Income: $72,827 (6th worst)
More on South Dorchester: Data
/10
Population: 45,902
Violent Crimes Per 100k: 366
Property Crime Per 100k: 878
Median Home Value: $549,416 (8th worst)
Median Income: $69,978 (5th worst)
More on East Boston: Data
/10
Population: 67,713
Violent Crimes Per 100k: 297
Property Crime Per 100k: 1,306
Median Home Value: $306,048 (2nd worst)
Median Income: $61,281 (4th worst)
More on Allston-Brighton: Data
/10
Population: 33,579
Violent Crimes Per 100k: 1,496
Property Crime Per 100k: 4,626
Median Home Value: $595,762 (11th worst)
Median Income: $93,484 (10th worst)
More on Central: Data
/10
Population: 31,348
Violent Crimes Per 100k: 373
Property Crime Per 100k: 1,175
Median Home Value: $503,105 (6th worst)
Median Income: $92,096 (9th worst)
More on Roslindale: Data
Methodology: How we determined the most dangerous Boston neighborhoods in 2025
To figure out how bad a place is to live in, we only needed to know what kinds of things people like and then decide what places have the least amount of those things. We plugged the following criteria into Saturday Night Science to get the worst neighborhoods in Boston:
- High crime (Estimated)
- High unemployment (Less jobs)
- Low median income (Less pay)
- Low population density (No things to do)
- Low home values (No one’s willing to pay to live here)
Then, we ranked each neighborhood in Boston, Massachusetts for each of these criteria from worst to best.
Next, we averaged the individual rankings for each criterion into a “Worst Score.”
The neighborhood with the lowest “Worst Score” ranks as the most dangerous neighborhood of Boston.
The article is an opinion based on facts and is meant as infotainment. We updated this article for 2025. This report is our time ranking the worst neighborhoods to live in Boston.
Skip to the end to see the list of all 16 neighborhoods ranked from worst to best.
Summary: The Worst Neighborhoods Around Boston
Well, there you have it — the worst of the neighborhoods in Boston with Roxbury landing at the bottom of the pack.
The worst neighborhoods in Boston are Roxbury, Mattapan, Fenway-Kenmore, Hyde Park, North Dorchester, South Dorchester, East Boston, Allston-Brighton, Central, and Roslindale.
As mentioned earlier, the neighborhoods in Boston aren’t all bad. Charlestown takes the cake as the best place to live in Boston.
The best neighborhoods in Boston are Charlestown, South Boston, Back Bay-Beacon Hill, West Roxbury, and South End.
We ranked the neighborhoods from worst to best in the chart below.
For more Massachusetts reading, check out:
Most Dangerous Neighborhoods To Live In Boston For 2025?
| Rank | Neighborhood | Population | Home Value | Median Income |
|---|---|---|---|---|
| 1 | Roxbury | 58,696 | $536,559 | $39,763 |
| 2 | Mattapan | 42,727 | $455,068 | $59,871 |
| 3 | Fenway-Kenmore | 38,280 | $241,970 | $48,949 |
| 4 | Hyde Park | 38,370 | $433,932 | $85,927 |
| 5 | North Dorchester | 26,430 | $574,240 | $78,922 |
| 6 | South Dorchester | 68,359 | $499,479 | $72,827 |
| 7 | East Boston | 45,902 | $549,416 | $69,978 |
| 8 | Allston-Brighton | 67,713 | $306,048 | $61,281 |
| 9 | Central | 33,579 | $595,762 | $93,484 |
| 10 | Roslindale | 31,348 | $503,105 | $92,096 |
| 11 | Jamaica Plain | 47,098 | $632,712 | $104,228 |
| 12 | South End | 33,120 | $1,078,380 | $101,034 |
| 13 | West Roxbury | 33,915 | $558,847 | $122,248 |
| 14 | Back Bay-Beacon Hill | 28,988 | $776,224 | $93,684 |
| 15 | South Boston | 41,090 | $746,666 | $132,281 |
| 16 | Charlestown | 19,678 | $742,385 | $123,289 |


