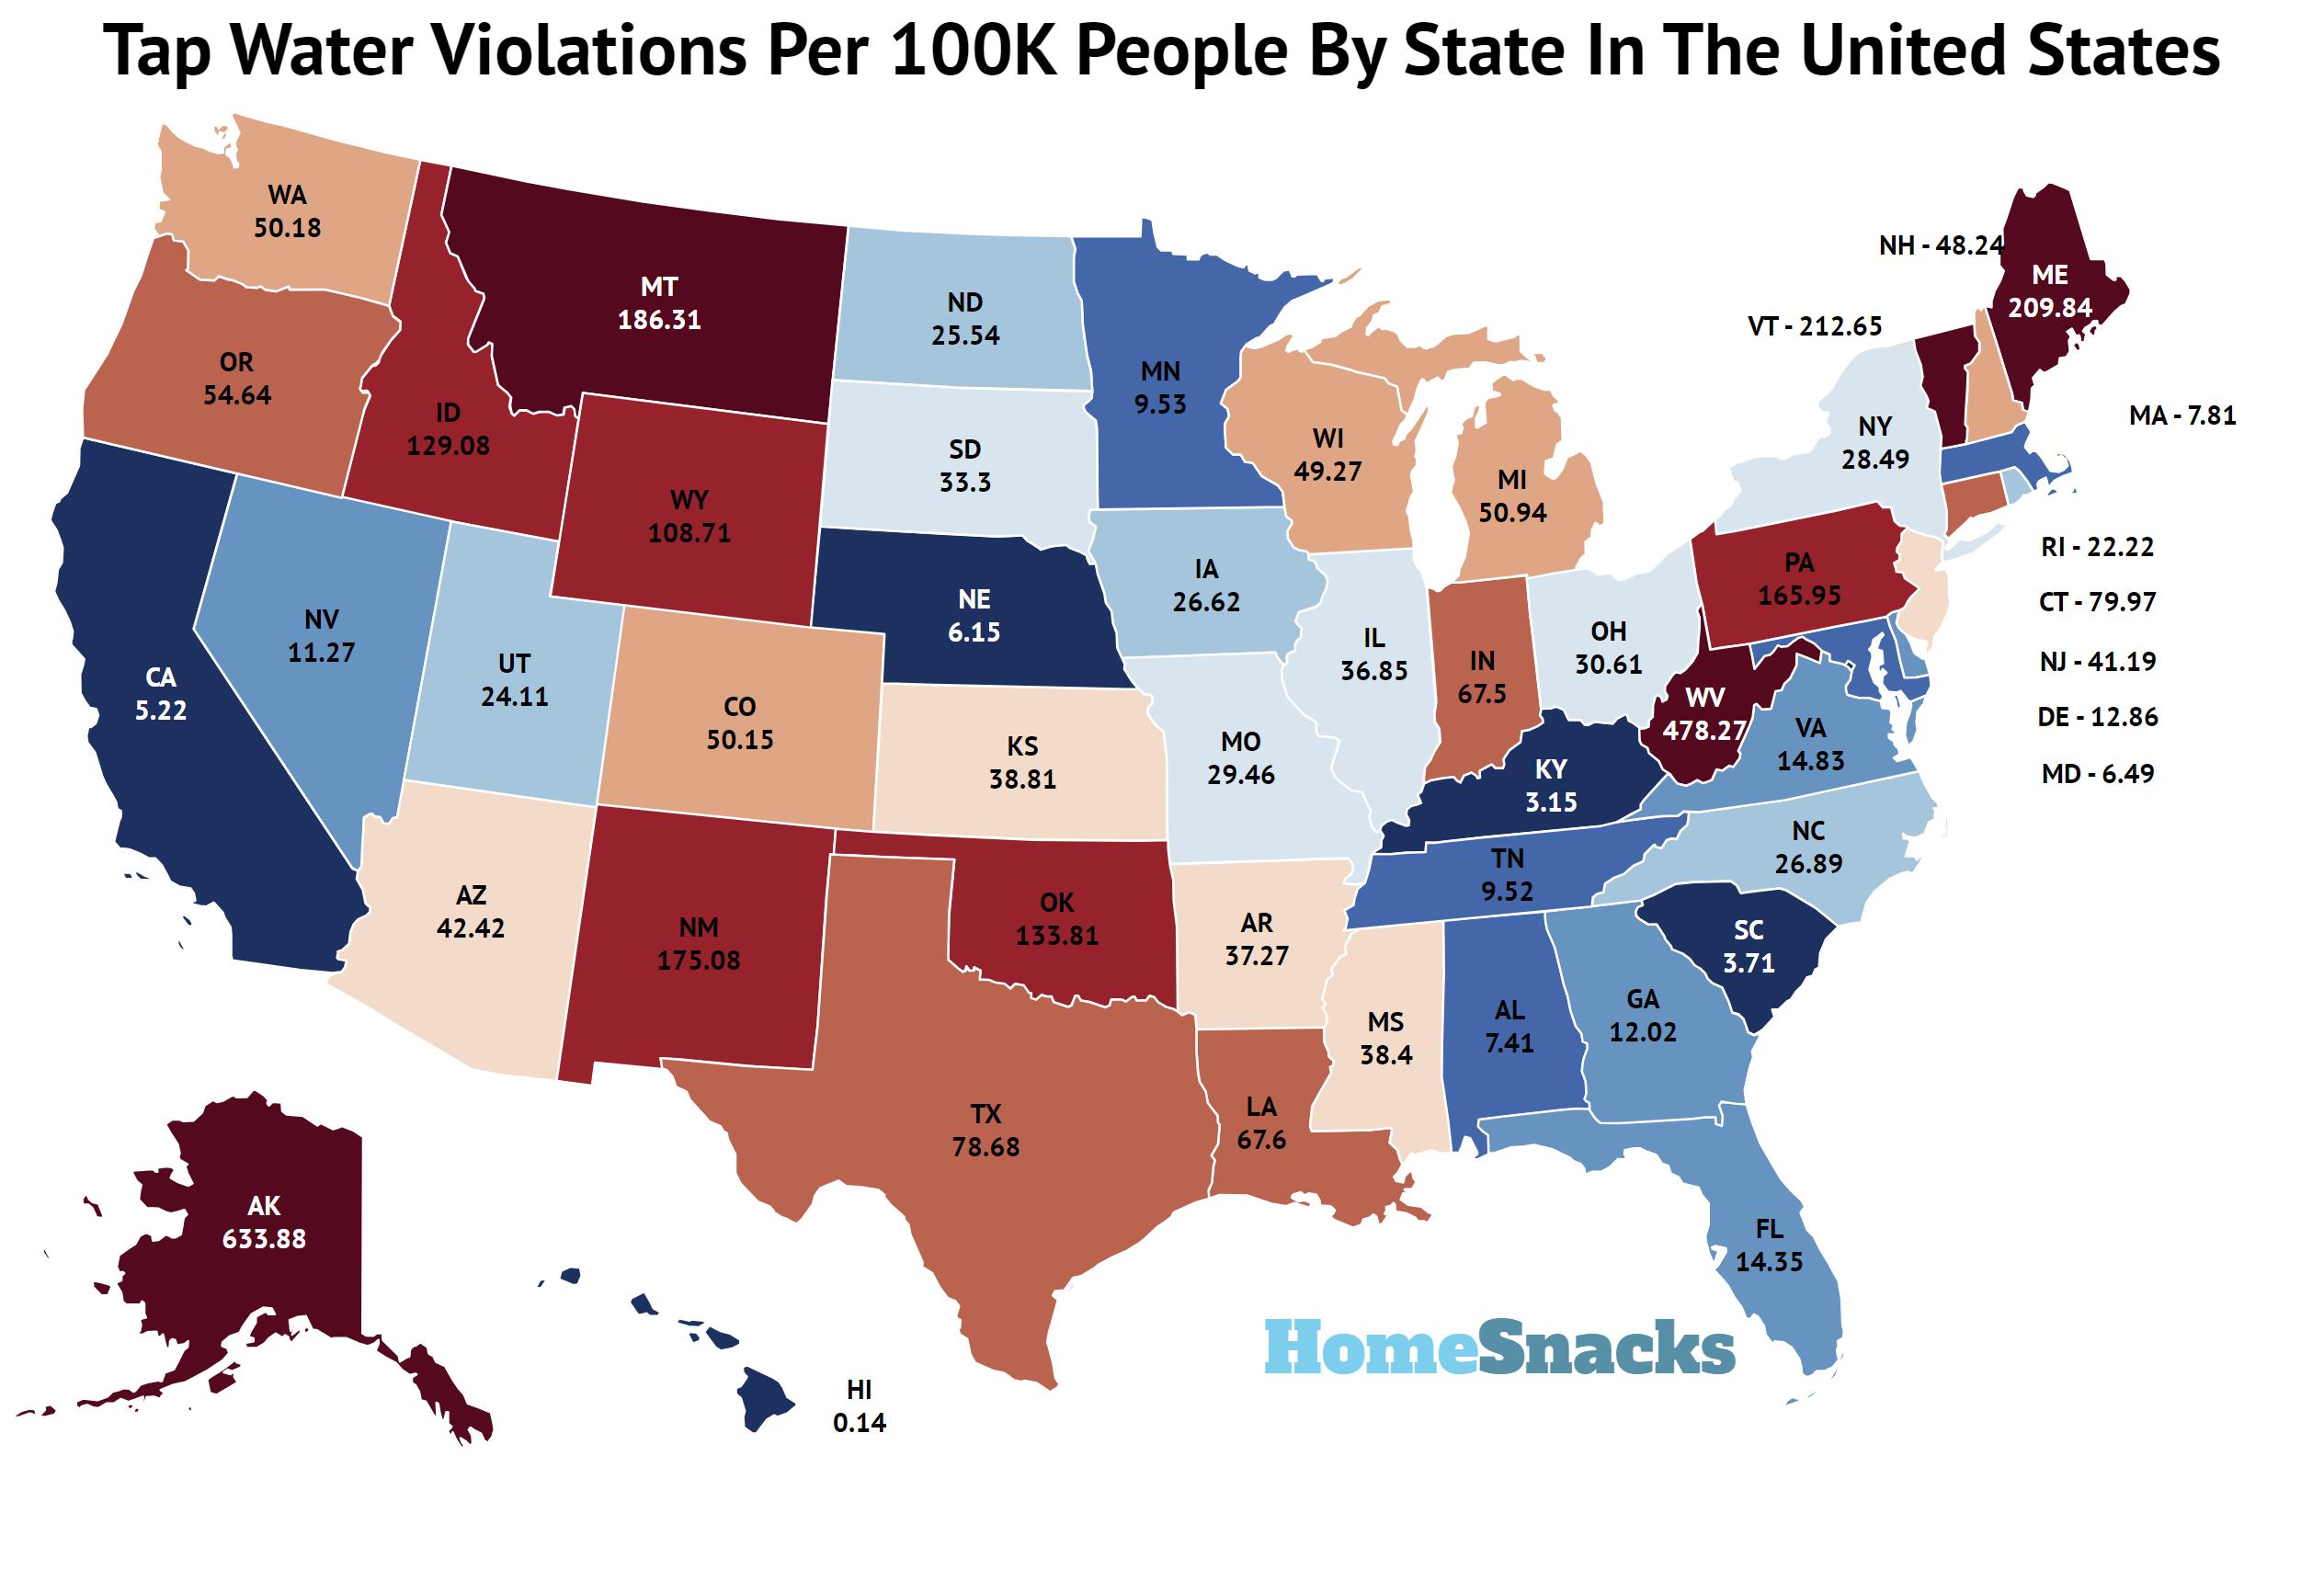
Best tap water in the United States analysis summary. Using data from the Safe Drinking Water Act, we analyzed the number of water quality violations by state. We normalized across states by population size by taking the rates per capita. Here are the key findings derived from this assessment of drinking water quality.
-
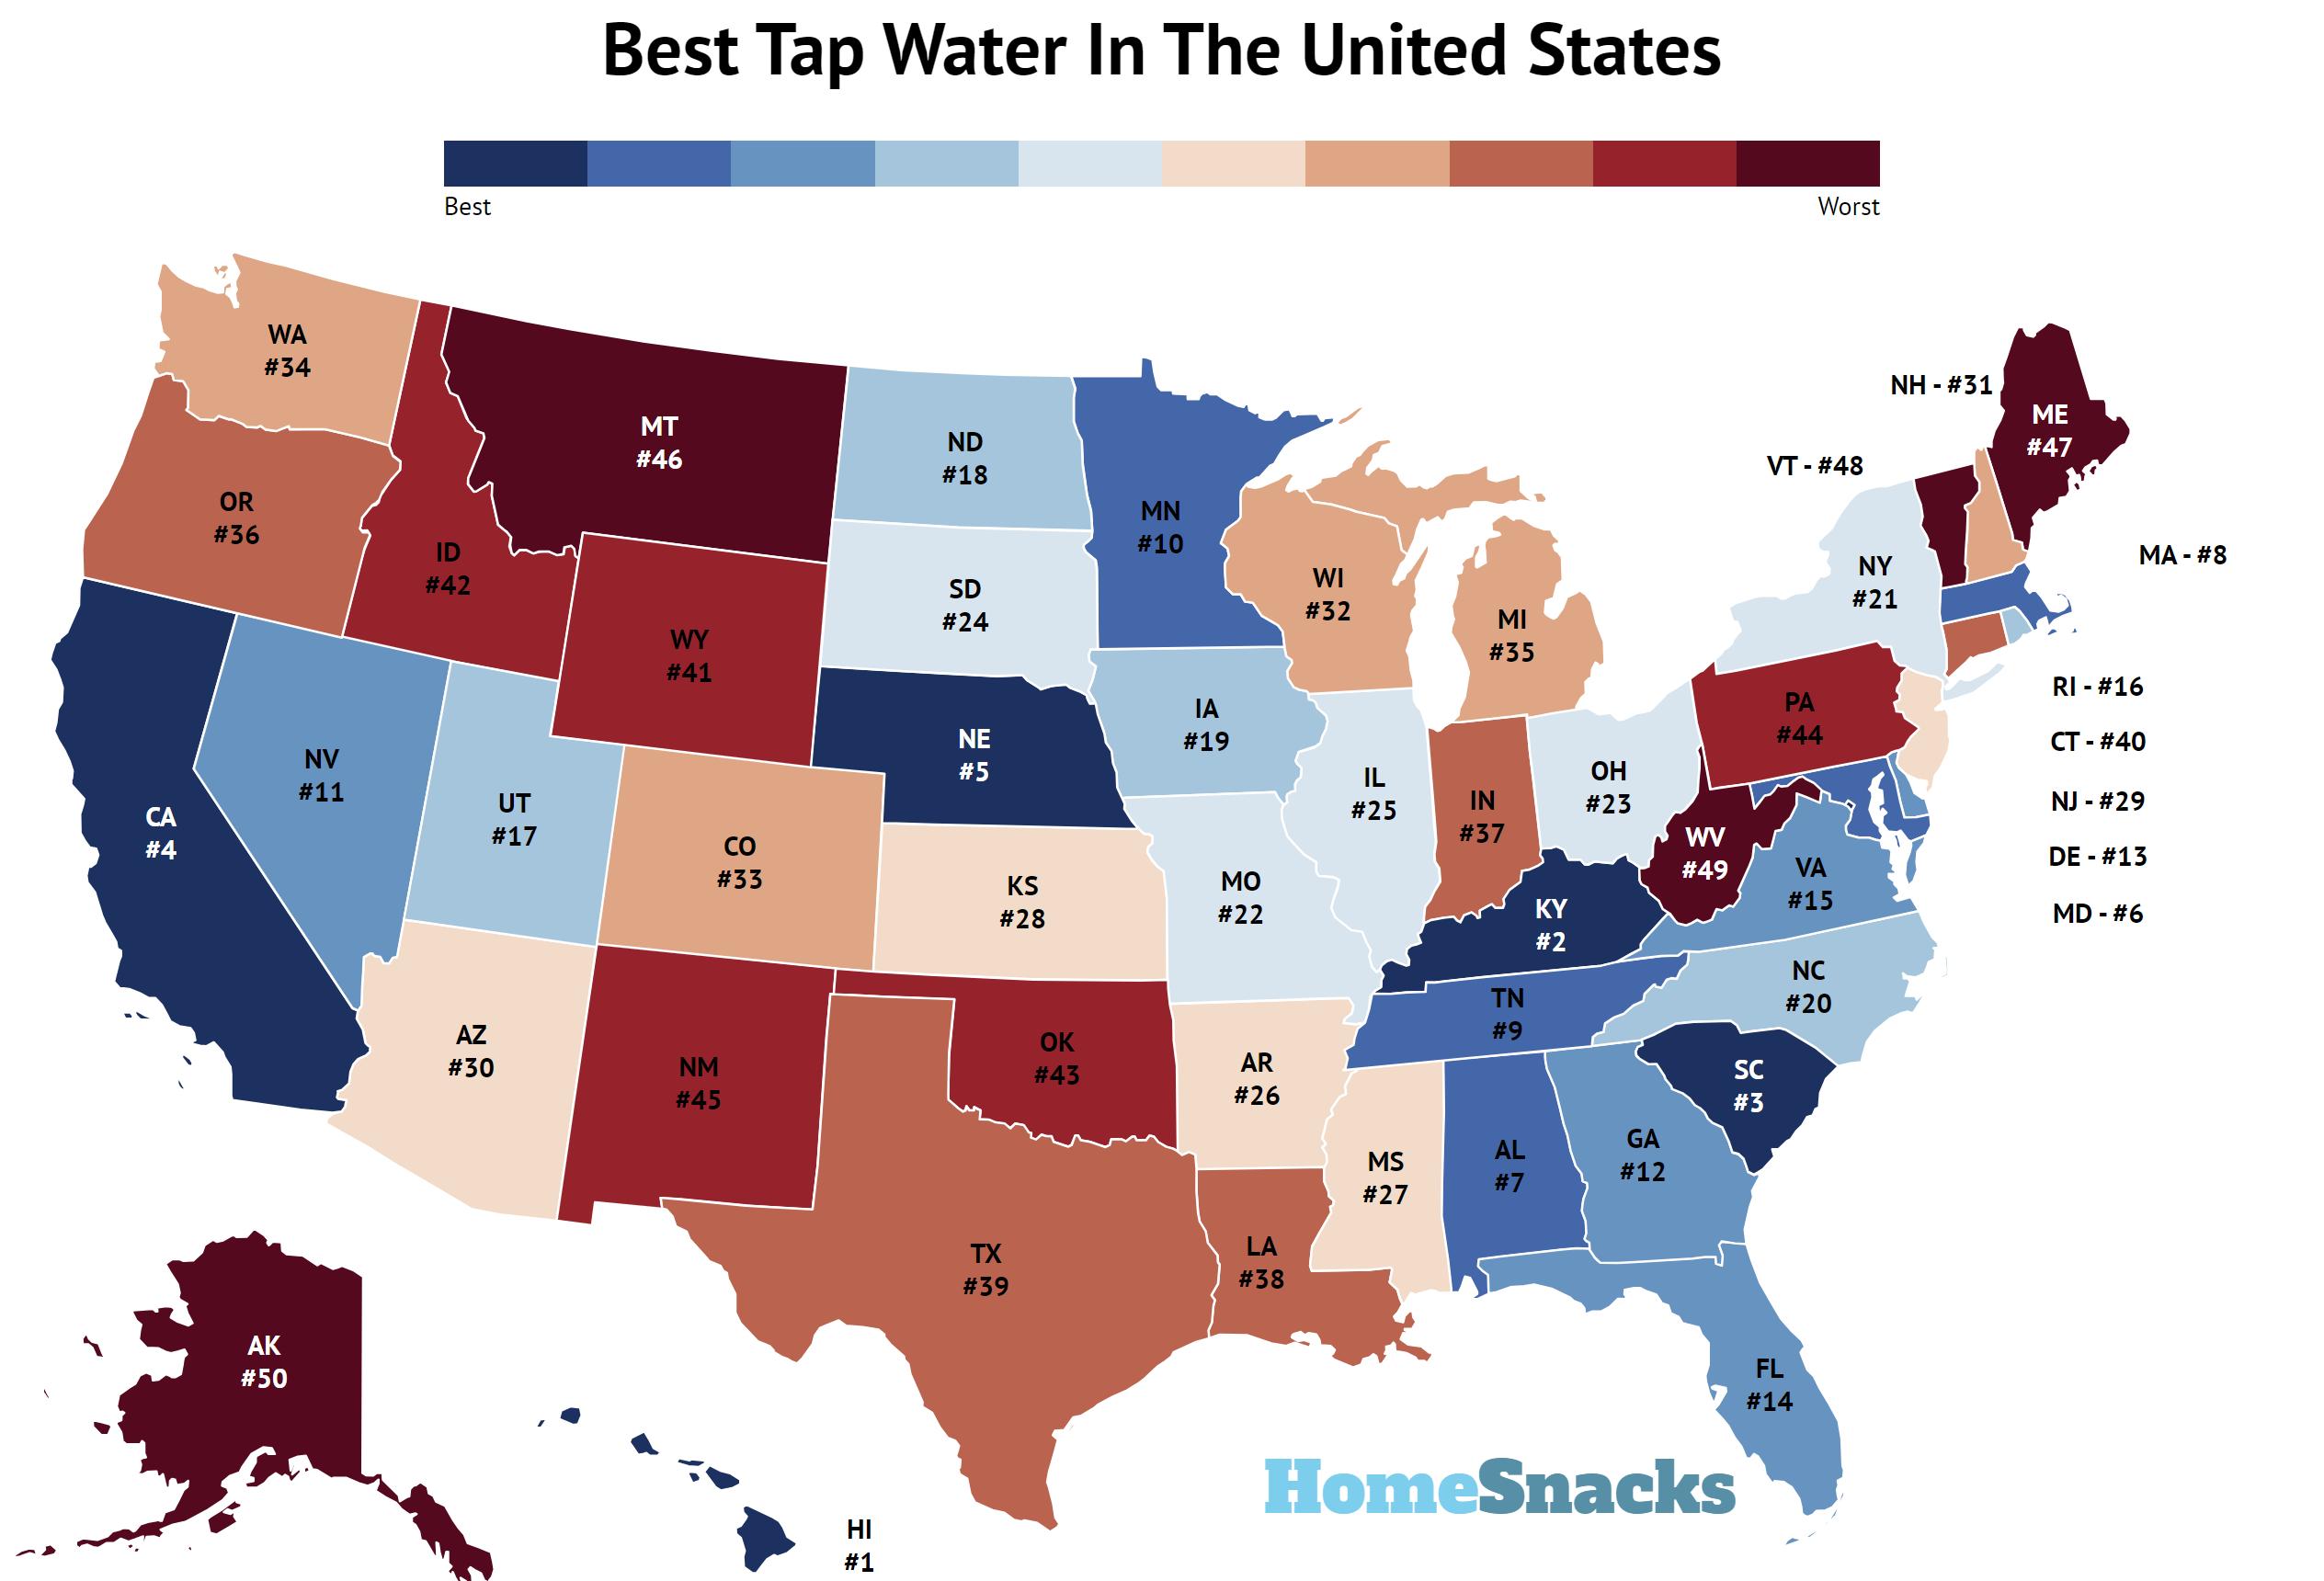
The state with the best tap water in the United States is Hawaii based on water violations per capita.
-
The state with the worst tap water in the United States is Alaska based on water violations per capita.
-
The state with the most water quality violations is 815.
-
The state with the least water quality violations is 1,129.
Map Of Tap Water Quality Across The United States
The quality of tap water in different states can vary due to various factors, including geological, environmental, and infrastructure-related reasons. Here are some key factors that can contribute to variations in tap water quality:
-
Source of Water. A state’s water supply source plays a significant role. States with abundant, naturally filtered water sources, such as pristine mountain springs or deep aquifers, may have naturally higher-quality tap water. In contrast, states with water sources prone to contamination or pollution may face more challenges.
-
Treatment Processes. Water treatment facilities’ treatment and purification processes can differ between states. Some states may invest more in advanced treatment technologies to ensure high water quality, while others may have older or less effective treatment infrastructure.
-
Infrastructure Maintenance. The maintenance and upkeep of water distribution systems are critical. States with well-maintained and regularly upgraded infrastructure are more likely to deliver better-quality tap water. Aging infrastructure can lead to water quality issues.
-
Environmental Factors. Environmental factors like industrial pollution, agricultural runoff, and natural events such as wildfires and droughts can impact source water quality. States with stricter environmental regulations and better enforcement may have cleaner source water.
-
Regulations and Oversight. The effectiveness of state and federal regulations and the oversight of water quality can vary. States with more stringent regulations and robust monitoring systems may have better tap water quality.
-
Geological Factors. The geology of a region can affect water quality. For example, certain geological formations may contain minerals or contaminants that can leach into the water supply.
-
Investment in Water Infrastructure. States that invest in modernizing and improving their water infrastructure are more likely to provide better-quality tap water to their residents.
-
Population Density. Highly populated areas may face additional challenges in maintaining water quality due to increased demand and the potential for more pollution sources.
States With The Best Tap Water
- Hawaii – 0.1 violations per 100k people
- Kentucky – 3.1 violations per 100k people
- South Carolina – 3.7 violations per 100k people
- California – 5.2 violations per 100k people
- Nebraska – 6.2 violations per 100k people
- Maryland – 6.5 violations per 100k people
- Alabama – 7.4 violations per 100k people
- Massachusetts – 7.8 violations per 100k people
- Tennessee – 9.5 violations per 100k people
- Minnesota – 9.5 violations per 100k people
States With The Worst Tap Water
- Alaska – 633.9 violations per 100k people
- West Virginia – 478.3 violations per 100k people
- Vermont – 212.7 violations per 100k people
- Maine – 209.8 violations per 100k people
- Montana – 186.3 violations per 100k people
- New Mexico – 175.1 violations per 100k people
- Pennsylvania – 165.9 violations per 100k people
- Oklahoma – 133.8 violations per 100k people
- Idaho – 129.1 violations per 100k people
- Wyoming – 108.7 violations per 100k people
Tap Water Quality By States In The United States
| Rank | State | Violations/100K Population | Population | Violations |
|---|---|---|---|---|
| 1 | Hawaii | 0.1 | 1,440,196 | 2 |
| 2 | Kentucky | 3.1 | 4,512,310 | 142 |
| 3 | South Carolina | 3.7 | 5,282,634 | 196 |
| 4 | California | 5.2 | 39,029,342 | 0 |
| 5 | Nebraska | 6.2 | 1,967,923 | 121 |
| 6 | Maryland | 6.5 | 6,164,660 | 400 |
| 7 | Alabama | 7.4 | 5,074,296 | 376 |
| 8 | Massachusetts | 7.8 | 6,981,974 | 545 |
| 9 | Tennessee | 9.5 | 7,051,339 | 671 |
| 10 | Minnesota | 9.5 | 5,717,184 | 545 |
| 11 | Nevada | 11.3 | 3,177,772 | 358 |
| 12 | Georgia | 12.0 | 10,912,876 | 0 |
| 13 | Delaware | 12.9 | 1,018,396 | 131 |
| 14 | Florida | 14.3 | 22,244,823 | 0 |
| 15 | Virginia | 14.8 | 8,683,619 | 0 |
| 16 | Rhode Island | 22.2 | 1,093,734 | 243 |
| 17 | Utah | 24.1 | 3,380,800 | 815 |
| 18 | North Dakota | 25.5 | 779,261 | 199 |
| 19 | Iowa | 26.6 | 3,200,517 | 852 |
| 20 | North Carolina | 26.9 | 10,698,973 | 0 |
| 21 | New York | 28.5 | 19,677,151 | 0 |
| 22 | Missouri | 29.5 | 6,177,957 | 0 |
| 23 | Ohio | 30.6 | 11,756,058 | 0 |
| 24 | South Dakota | 33.3 | 909,824 | 303 |
| 25 | Illinois | 36.9 | 12,582,032 | 0 |
| 26 | Arkansas | 37.3 | 3,045,637 | 0 |
| 27 | Mississippi | 38.4 | 2,940,057 | 0 |
| 28 | Kansas | 38.8 | 2,937,150 | 0 |
| 29 | New Jersey | 41.2 | 9,261,699 | 0 |
| 30 | Arizona | 42.4 | 7,359,197 | 0 |
| 31 | New Hampshire | 48.2 | 1,395,231 | 673 |
| 32 | Wisconsin | 49.3 | 5,892,539 | 0 |
| 33 | Colorado | 50.1 | 5,839,926 | 0 |
| 34 | Washington | 50.2 | 7,785,786 | 0 |
| 35 | Michigan | 50.9 | 10,034,113 | 0 |
| 36 | Oregon | 54.6 | 4,240,137 | 0 |
| 37 | Indiana | 67.5 | 6,833,037 | 0 |
| 38 | Louisiana | 67.6 | 4,590,241 | 0 |
| 39 | Texas | 78.7 | 30,029,572 | 0 |
| 40 | Connecticut | 80.0 | 3,626,205 | 0 |
| 41 | Wyoming | 108.7 | 581,381 | 632 |
| 42 | Idaho | 129.1 | 1,939,033 | 0 |
| 43 | Oklahoma | 133.8 | 4,019,800 | 0 |
| 44 | Pennsylvania | 165.9 | 12,972,008 | 0 |
| 45 | New Mexico | 175.1 | 2,113,344 | 0 |
| 46 | Montana | 186.3 | 1,122,867 | 0 |
| 47 | Maine | 209.8 | 1,385,340 | 0 |
| 48 | Vermont | 212.7 | 647,064 | 0 |
| 49 | West Virginia | 478.3 | 1,775,156 | 0 |
| 50 | Alaska | 633.9 | 733,583 | 0 |
Methodology: How To Determine The States With The Best Tap Water
The Environmental Protection Agency collects and maintains a database of water quality violations and compliance data for public water systems across the United States. This database contains information about various violations related to water quality, including chemical contaminants, microbial contaminants, and violations related to the Safe Drinking Water Act.
We analyzed the number of tap water violations from the EPA per capita in each state to determine the best tap water. States with fewer violations per capita were ranked as having better tap water.
This method considers the regulatory compliance and the effectiveness of water management practices in each state.
Various factors beyond violations, such as source water quality, treatment methods, and infrastructure, can influence water quality. Additionally, the accuracy of the rankings may depend on the completeness and timeliness of the data reported to the EPA.
Conclusion
Analyzing EPA tap water violations per capita offers a valuable and systematic approach to gauging the relative quality of tap water in different states. By considering the number and severity of violations in proportion to the state’s population, this method provides a fair and insightful ranking of states’ performance in maintaining safe and clean tap water.
Even with a very large population, states like California can maintain incredibly high water quality standards. While smaller, more rural states like West Virginia, Alaska, and Vermont need help to maintain quality across a smaller population.
It’s crucial to recognize that this analysis represents just one facet of overall water quality, and a comprehensive understanding of tap water quality requires considering additional factors such as source water quality, treatment processes, and infrastructure conditions. Nevertheless, this approach serves as a valuable tool for policymakers, water management authorities, and the public in identifying areas for improvement and ensuring access to safe drinking water across the United States.


