Literacy rates in the United States research summary. We analyzed research by the NCES to identify the states with the highest and lowest literacy rates in the United States. The variation in literacy rates among states can be attributed to socioeconomic, educational, and cultural factors.
Here are the key takeaways from the report on literacy in the United States.
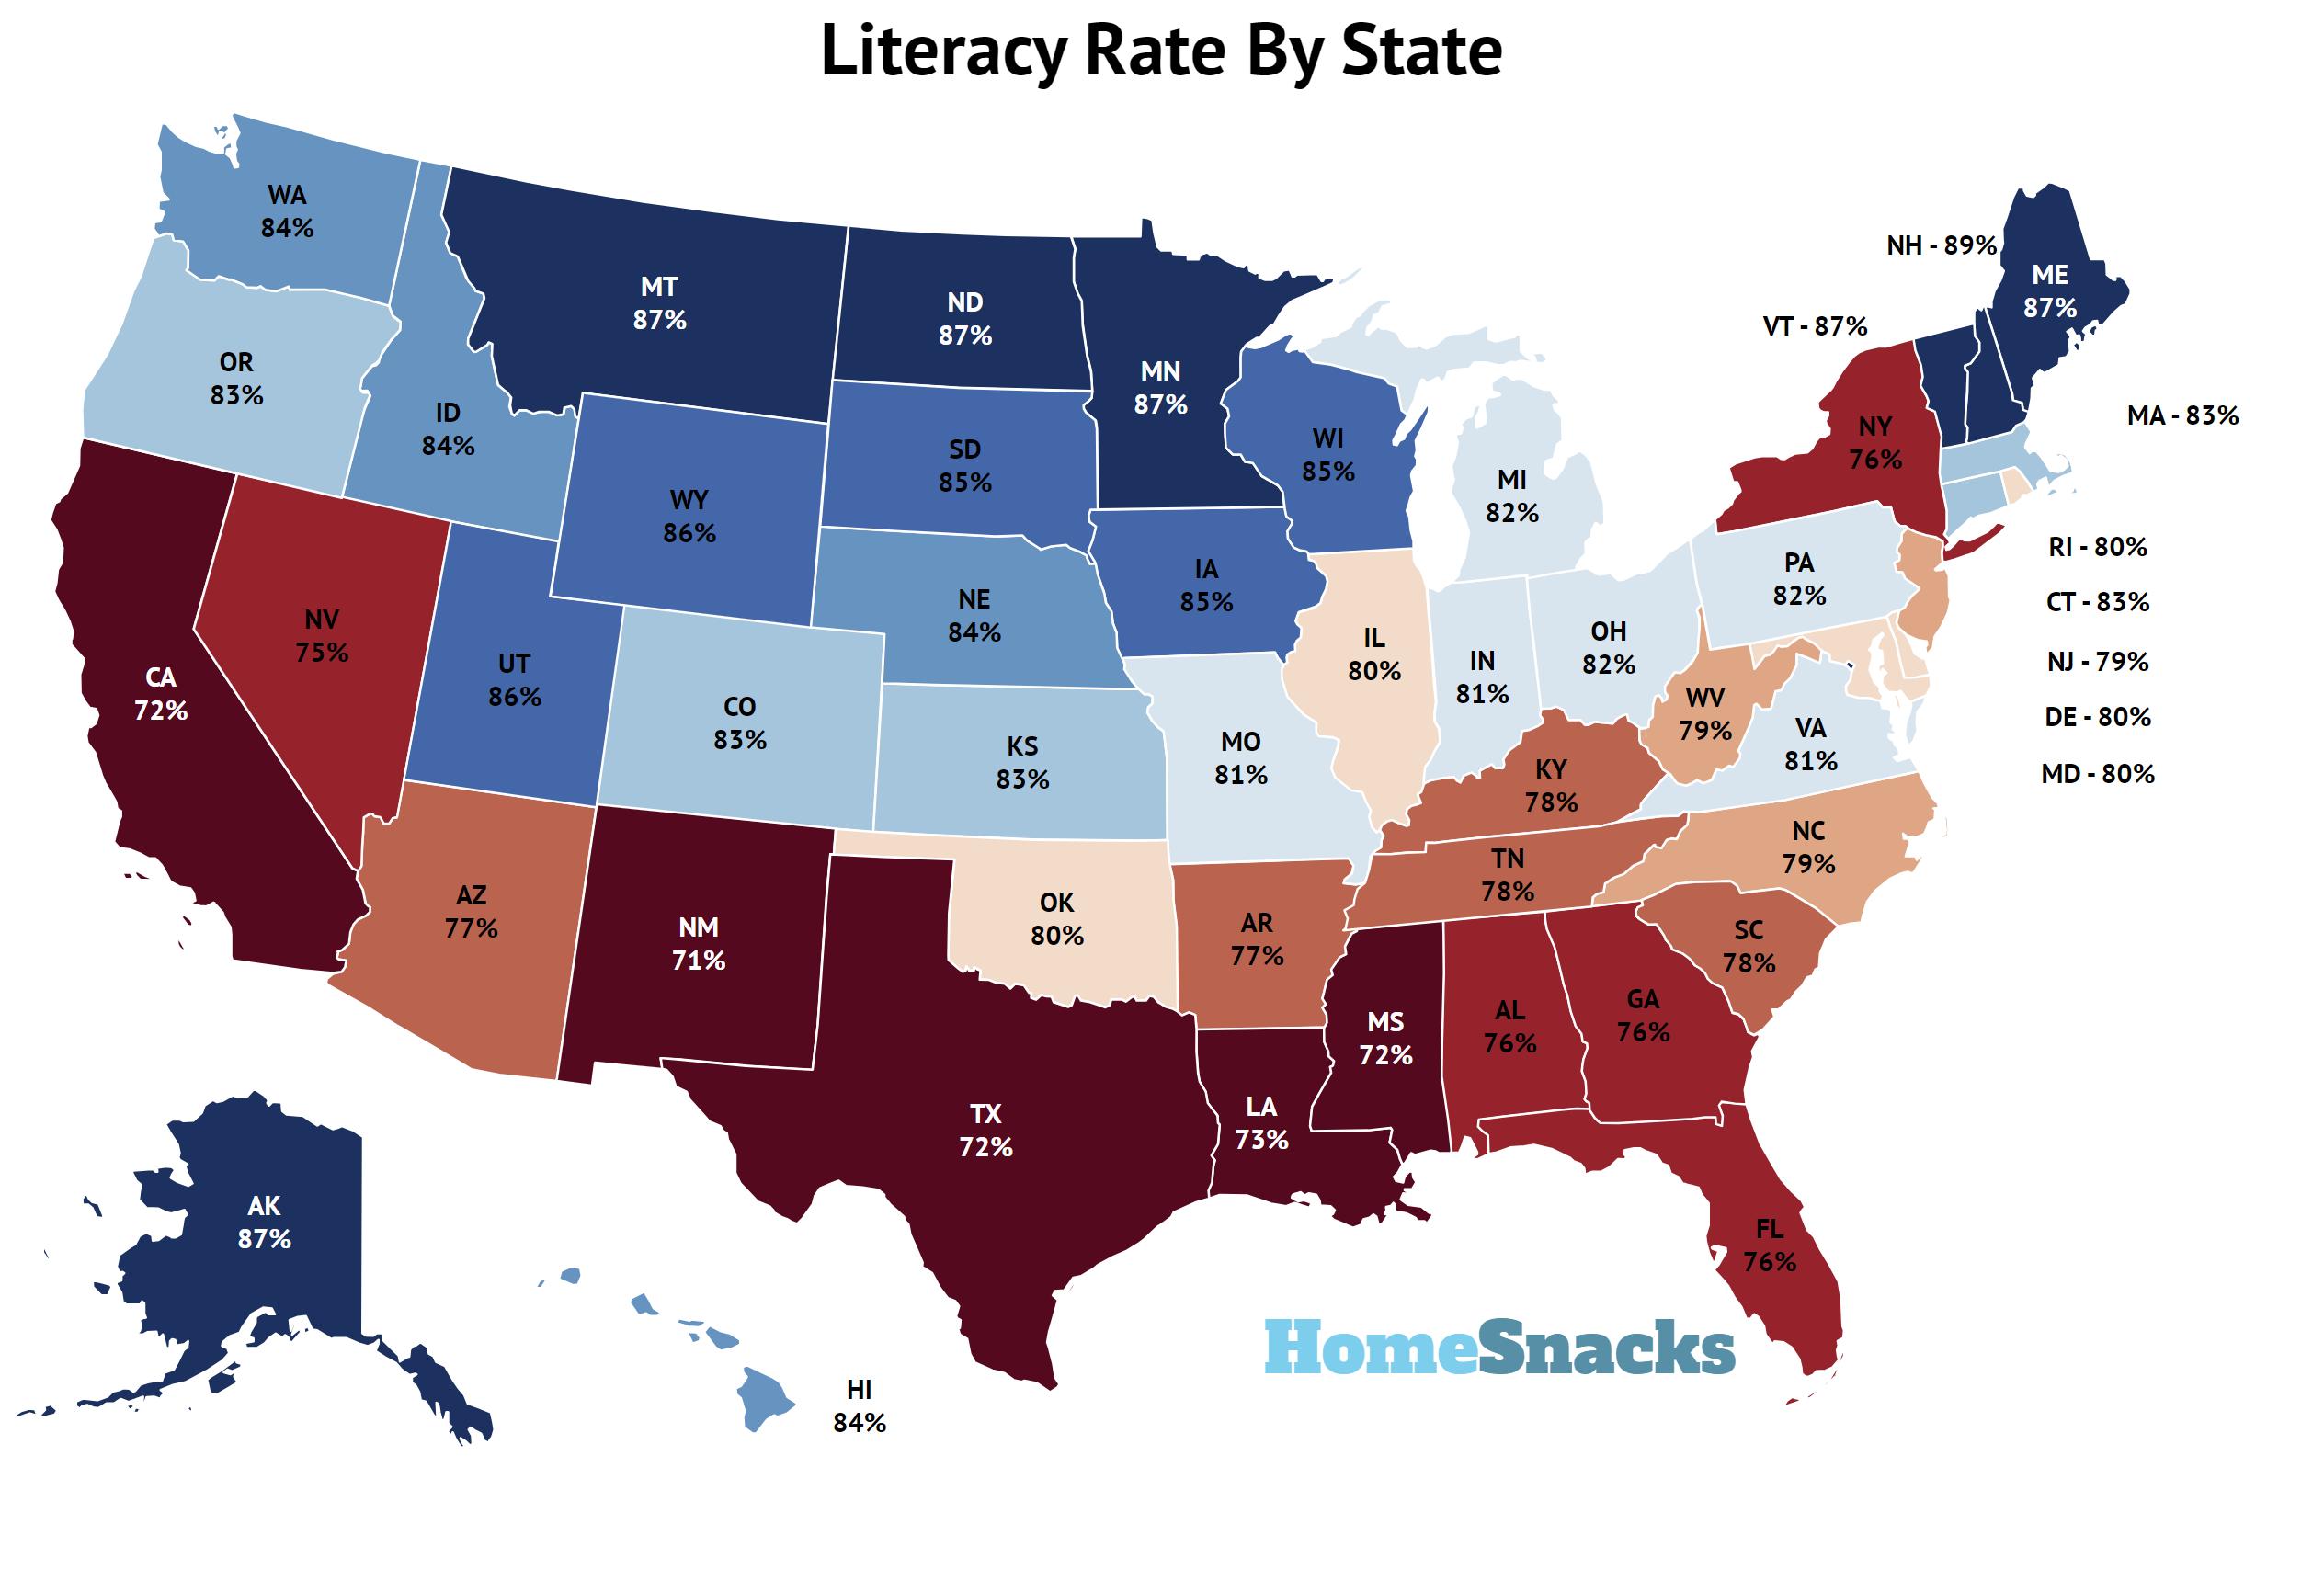
The state with the highest literacy rate in the United States is New Hampshire with a literacy rate of 88%.
The state with the lowest literacy rate in the United States is New Mexico with a literacy rate of 71%.
The national average literacy rate is 78%.
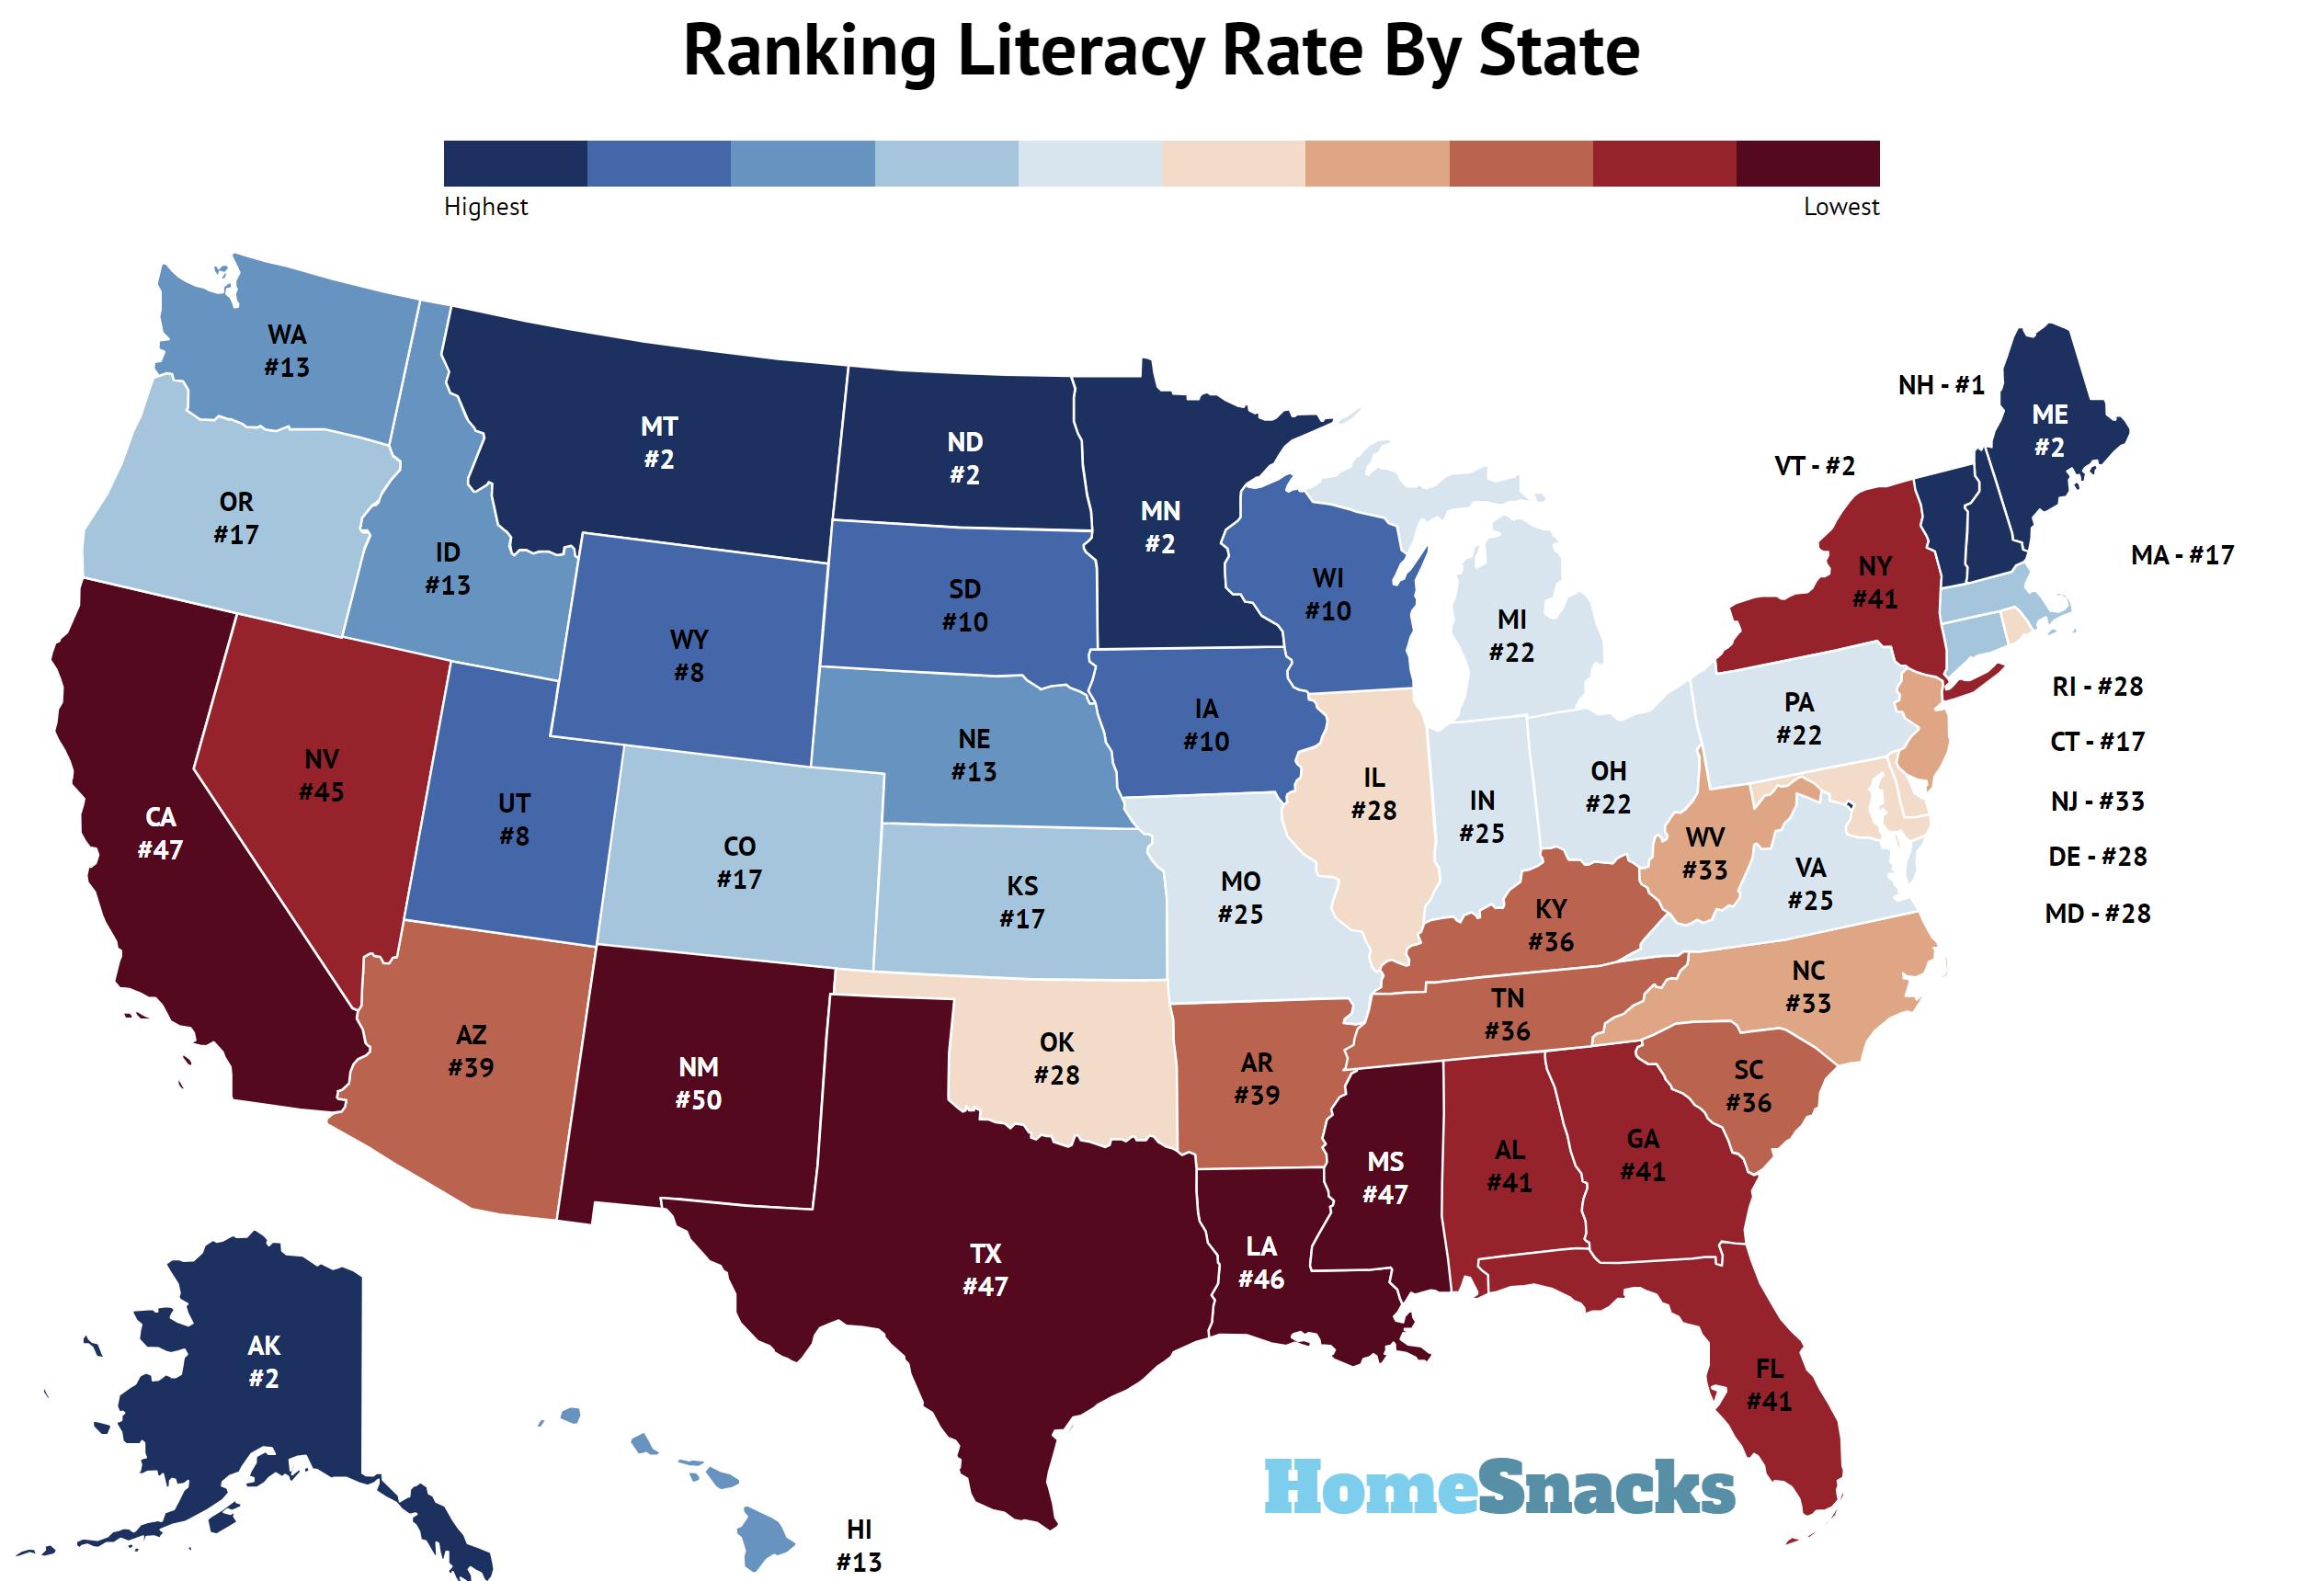
Ranking States By Literacy Rates
The variation in literacy rates among states can be attributed to a combination of socioeconomic, educational, and cultural factors. Here are some key factors that may help explain the differences in literacy rates:
Education Funding. States that allocate more resources and funding towards their education systems tend to have higher literacy rates. These resources can be used to hire qualified teachers, provide quality educational materials, and maintain school infrastructure.
Education Quality. The quality of education can vary significantly from state to state. States with strong educational standards and effective teaching methods are likely to produce literate citizens.
Poverty Levels. Higher poverty levels can be associated with lower literacy rates. When families struggle to make ends meet, children may not have access to educational resources or may be forced to work at a young age instead of attending school.
Access to Education. The availability of schools, especially in rural areas, can impact literacy rates. States with better access to schools and educational programs are more likely to have higher literacy rates.
Cultural and Social Factors. Cultural attitudes towards education can play a role. In some states, there may be a stronger emphasis on the value of education, leading to higher literacy rates.
States With The Highest Literacy Rates
- New Hampshire – 88.0% Literacy Rate
- Maine – 87.0% Literacy Rate
- Minnesota – 87.0% Literacy Rate
- Montana – 87.0% Literacy Rate
- North Dakota – 87.0% Literacy Rate
- Vermont – 87.0% Literacy Rate
- Alaska – 87.0% Literacy Rate
- Utah – 86.0% Literacy Rate
- Wyoming – 86.0% Literacy Rate
- Iowa – 85.0% Literacy Rate
States With The Lowest Literacy Rates
- New Mexico – 71.0% Literacy Rate
- Mississippi – 72.0% Literacy Rate
- California – 72.0% Literacy Rate
- Texas – 72.0% Literacy Rate
- Louisiana – 73.0% Literacy Rate
- Nevada – 75.0% Literacy Rate
- New York – 76.0% Literacy Rate
- Georgia – 76.0% Literacy Rate
- Florida – 76.0% Literacy Rate
- Alabama – 76.0% Literacy Rate
Literacy Rates By State
| Rank | State | Literacy Rate |
|---|---|---|
| 1 | New Hampshire | 88.0% |
| 2 | Alaska | 87.0% |
| 2 | Maine | 87.0% |
| 2 | Minnesota | 87.0% |
| 2 | Montana | 87.0% |
| 2 | North Dakota | 87.0% |
| 2 | Vermont | 87.0% |
| 8 | Utah | 86.0% |
| 8 | Wyoming | 86.0% |
| 10 | Iowa | 85.0% |
| 10 | South Dakota | 85.0% |
| 10 | Wisconsin | 85.0% |
| 13 | Idaho | 84.0% |
| 13 | Hawaii | 84.0% |
| 13 | Washington | 84.0% |
| 13 | Nebraska | 84.0% |
| 17 | Colorado | 83.0% |
| 17 | Connecticut | 83.0% |
| 17 | Kansas | 83.0% |
| 17 | Massachusetts | 83.0% |
| 17 | Oregon | 83.0% |
| 22 | Ohio | 82.0% |
| 22 | Pennsylvania | 82.0% |
| 22 | Michigan | 82.0% |
| 25 | Missouri | 81.0% |
| 25 | Virginia | 81.0% |
| 25 | Indiana | 81.0% |
| 28 | Delaware | 80.0% |
| 28 | Illinois | 80.0% |
| 28 | Maryland | 80.0% |
| 28 | Oklahoma | 80.0% |
| 28 | Rhode Island | 80.0% |
| 33 | New Jersey | 79.0% |
| 33 | North Carolina | 79.0% |
| 33 | West Virginia | 79.0% |
| 36 | Kentucky | 78.0% |
| 36 | South Carolina | 78.0% |
| 36 | Tennessee | 78.0% |
| 39 | Arizona | 77.0% |
| 39 | Arkansas | 77.0% |
| 41 | Alabama | 76.0% |
| 41 | Florida | 76.0% |
| 41 | Georgia | 76.0% |
| 41 | New York | 76.0% |
| 45 | Nevada | 75.0% |
| 46 | Louisiana | 73.0% |
| 47 | Texas | 72.0% |
| 47 | California | 72.0% |
| 47 | Mississippi | 72.0% |
| 50 | New Mexico | 71.0% |
Methodology: How We Analyzed The Literacy Rate In Each State
We used data from the National Center for Education Statistics PIAAC Skills Map to determine the literacy rate in each state of the United States. The state-level estimates combine PIAAC data collected in 2012, 2014, and 2017 with American Community Survey data, and at the state level this remains the most current dataset NCES publishes. NCES released PIAAC Cycle 2 national results in December 2024, which showed U.S. adult literacy proficiency declining; Cycle 2 state-level estimates have not yet been published, so the state ranking below reflects the Cycle 1 vintage.
We ranked each state from the highest to lowest literacy rates based on the results of the most recent report.
It’s worth noting that the data’s limitations, including advanced statistical methods like small area estimation and the combination of PIAAC data with American Community Survey data, may need to be revised in the estimates. However, statistical analysis commonly uses these methods to provide valuable insights when conducting large-scale surveys.
Conclusion
Policy decisions, historical factors, and social dynamics can also contribute to the differences in literacy rates by state. Addressing lower literacy rates often requires a combination of strategies, including improving educational systems, reducing poverty, and promoting a culture of learning and literacy.


