Jewish Population By State In The United States 2021
Research Summary
The data team at HomeSnacks looked at population studies and surveys conducted over the past several years to determine the Jewish population by state in the United States. Key findings include:
There are 7,153,065 Jewish people in the United States.
2.2% of people in the United States are Jewish.
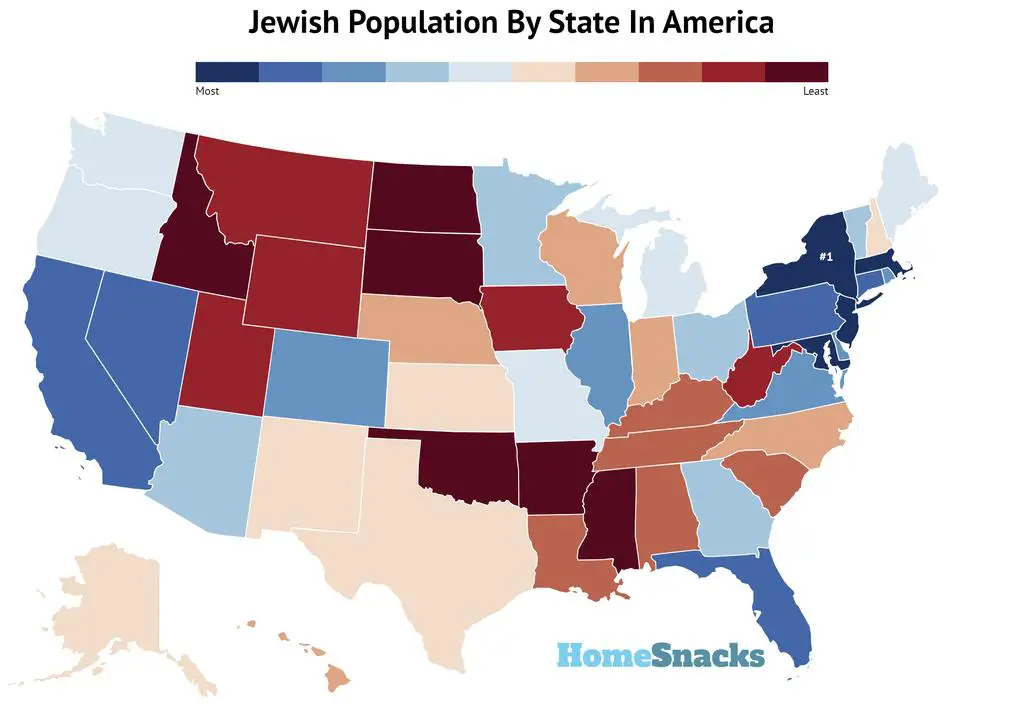
Washington DC has the largest percentage of Jewish people -- 8.27%.
New York has the largest Jewish population 1,772,470 people.
South Dakota has the lowest percentage of Jewish people -- 0.03%.
South Dakota has the smallest Jewish population -- 250 people.
Jewish Population By State
The most recent estimates predict that there are over 7 million Jewish people in the United states. This population estimate has been slowly increasing over time from about 1 million at the turn of the previous century.
Sometimes called Jews, a Jewish person is anyone whose religion is Judaism. There is also a cultural component to Judaism as almost 20% of Jewish adults consider themselves Jewish, but of no religion.
There are currently 18 million Jews throughout the world with Israel having the second largest population after the United States. The vast majority, 95%,, of Jewish Americans are Ashkenazi Jews and were born in the United States. Ashkenazi Jews originate from Central and Eastern Europe.
While New York state, New Jersey, and California have large Jewish populations, the cities with the largest Jewish populations include New York City, Boston, and Miami. Many Jews originally emigrated to New York City and then followed the community south to Miami and north to Boston.
Here is a breakdown of the ten states with the largest number of Jewish people in the United States as a percent:
- New York - 1,772,470 Jews
- Washington D.C. - 57,300 Jews
- New Jersey - 546,950 Jews
- Massachusetts - 293,080 Jews
- Maryland - 238,600 Jews
- Pennsylvania - 434,165 Jews
- Connecticut - 118,350 Jews
- Florida - 657,095 Jews
- California - 1,187,990 Jews
- Nevada - 76,300 Jews
Here is a breakdown of the ten states with the smallest number of Jewish people in the United States as a percent:
- South Dakota - 250 Jews
- Mississippi - 1,525 Jews
- North Dakota - 400 Jews
- Arkansas - 2,225 Jews
- Oklahoma - 4,425 Jews
- Idaho - 2,125 Jews
- West Virginia - 2,310 Jews
- Montana - 1,495 Jews
- Iowa - 5,475 Jews
- Utah - 5,650 Jews
Table: Jewish Population By State
| Rank | State | Jewish Population | Population | % Jewish |
|---|---|---|---|---|
| 1 | New York | 1,772,470 | 19,572,319 | 9.06% |
| 2 | Washington D.c. | 57,300 | 692,683 | 8.27% |
| 3 | New Jersey | 546,950 | 8,878,503 | 6.16% |
| 4 | Massachusetts | 293,080 | 6,850,553 | 4.28% |
| 5 | Maryland | 238,600 | 6,018,848 | 3.96% |
| 6 | Pennsylvania | 434,165 | 12,791,530 | 3.39% |
| 7 | Connecticut | 118,350 | 3,575,074 | 3.31% |
| 8 | Florida | 657,095 | 20,901,636 | 3.14% |
| 9 | California | 1,187,990 | 39,283,497 | 3.02% |
| 10 | Nevada | 76,300 | 2,972,382 | 2.57% |
| 11 | Illinois | 297,735 | 12,770,631 | 2.33% |
| 12 | Virginia | 150,595 | 8,454,463 | 1.78% |
| 13 | Rhode Island | 18,750 | 1,057,231 | 1.77% |
| 14 | Colorado | 98,400 | 5,610,349 | 1.75% |
| 15 | Delaware | 15,100 | 957,248 | 1.58% |
| 16 | Arizona | 108,075 | 7,050,299 | 1.53% |
| 17 | Ohio | 151,615 | 11,655,397 | 1.3% |
| 18 | Vermont | 7,865 | 624,313 | 1.26% |
| 19 | Georgia | 128,720 | 10,403,847 | 1.24% |
| 20 | Minnesota | 65,900 | 5,563,378 | 1.18% |
| 21 | Missouri | 64,275 | 6,104,910 | 1.05% |
| 22 | Washington | 75,350 | 7,404,107 | 1.02% |
| 23 | Oregon | 40,650 | 4,129,803 | 0.98% |
| 24 | Maine | 12,550 | 1,335,492 | 0.94% |
| 25 | Michigan | 87,905 | 9,965,265 | 0.88% |
| 26 | Alaska | 5,750 | 737,068 | 0.78% |
| 27 | New Hampshire | 10,120 | 1,348,124 | 0.75% |
| 28 | Texas | 176,000 | 28,260,856 | 0.62% |
| 29 | Kansas | 17,425 | 2,910,652 | 0.6% |
| 30 | New Mexico | 12,625 | 2,092,454 | 0.6% |
| 31 | Wisconsin | 33,455 | 5,790,716 | 0.58% |
| 32 | Hawaii | 7,100 | 1,422,094 | 0.5% |
| 33 | Nebraska | 9,350 | 1,914,571 | 0.49% |
| 34 | North Carolina | 45,935 | 10,264,876 | 0.45% |
| 35 | Indiana | 25,145 | 6,665,703 | 0.38% |
| 36 | Tennessee | 22,800 | 6,709,356 | 0.34% |
| 37 | South Carolina | 16,820 | 5,020,806 | 0.34% |
| 38 | Louisiana | 14,900 | 4,664,362 | 0.32% |
| 39 | Kentucky | 12,500 | 4,449,052 | 0.28% |
| 40 | Alabama | 10,325 | 4,876,250 | 0.21% |
| 41 | Wyoming | 1,150 | 581,024 | 0.2% |
| 42 | Utah | 5,650 | 3,096,848 | 0.18% |
| 43 | Iowa | 5,475 | 3,139,508 | 0.17% |
| 44 | Montana | 1,495 | 1,050,649 | 0.14% |
| 45 | West Virginia | 2,310 | 1,817,305 | 0.13% |
| 46 | Idaho | 2,125 | 1,717,750 | 0.12% |
| 47 | Oklahoma | 4,425 | 3,932,870 | 0.11% |
| 48 | Arkansas | 2,225 | 2,999,370 | 0.07% |
| 49 | North Dakota | 400 | 756,717 | 0.05% |
| 50 | Mississippi | 1,525 | 2,984,418 | 0.05% |
| 51 | South Dakota | 250 | 870,638 | 0.03% |
Methodology
Using data from the Jewish Virtual Library and the most recent Census data, we found the Jewish population per capita for each state in the United States.
Conclusion
Based on our trend analysis, the overall Jewish population in America continues to grow steadily, as it has done for over 100 years.
The largest Jewish populations in the United States can be found in the Northeast. The smallest Jewish populations are found in the Mountain West. New York and New Jersey are home to the largest Jewish population on a percentage basis, excluding Washington DC. States in the surrounding area, such as Pennslyvania and Maryland, have seen a growing Jewish population in the past several years.