You’ve seen these lists before. Best places to live in California. Best suburbs in California. Best counties in California.
Etc., etc., etc.
But they all focus on major cities and towns in the Golden State, and no one pays attention to the little guy.
Well, that’s all about to change as we put together a list of the superb small towns in California based on numbers–not opinions or hearsay.
We’ll dive right into our methodology in the next section, but first, we thought you might want to know which places in California ranked the best based on Saturday Night Science.
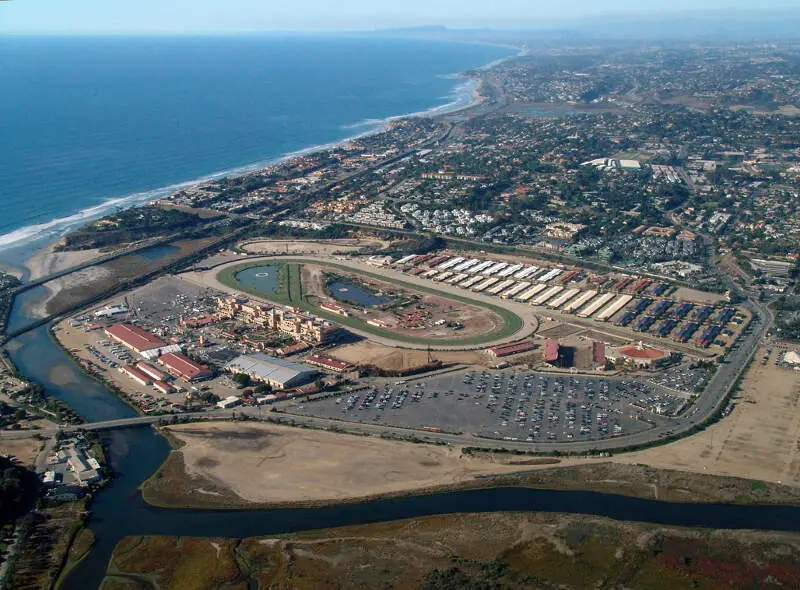
$199,152 median income · 1.8% unemployment
Data | Crime | Cost of living | Movers
$250,001 median income · 6.3% unemployment
$129,250 median income · 3.1% unemployment
Data | Crime | Cost of living | Movers
$250,001 median income · 0.0% unemployment
$208,466 median income · 3.1% unemployment
$250,001 median income · 0.7% unemployment
$167,396 median income · 2.8% unemployment
Broadmoor is a census-designated place in an unincorporated area of San Mateo County, California, United States. The enclave is entirely surrounded by Daly City. The population was 4,176 at the 2010 census.
$250,001 median income · 2.6% unemployment
$235,750 median income · 10.7% unemployment
$250,001 median income · 2.2% unemployment
The receipts
Compare the top ten
Pick a metric. The bars rescale. The red line is California’s statewide median.
California statewide median: $99,122
California statewide median: $774,582
California statewide median: 6.6%
On the map
Where California’s best small towns are
Saturday Night Science
Methodology: How We Determined The Coolest Towns In California
We threw a lot of criteria at this report to get the best, most complete results of the best small towns in California possible.
Using the most recent data from the Census’s 2020-2024 American Community Survey, the Bureau of Labor Statistics, and Saturday Night Science, this is the criteria we used:
- Population Density (Higher is better)
- Lowest Unemployment Rates
- Housing costs (Higher is better. More demand.)
- Adjusted Median Income (Higher is better)
- Highly Educated Adults (Higher is better)
- Insurance Rates (Higher is better)
- Commute Times (Lower is better)
We looked at places with populations lower than 5,000 people and greater than 1,000, of which there were many – 359 to be exact.
We then ranked each place in each category with scores from 1 to 359, averaged them out, and the lowest scores went to our Best Small Towns in California. Top of that list — Del Mar.
This is our eleventh time ranking the best small places to live in California.
The full plate
Best Small Towns In California
Click any column to sort. Search by town name.
| Rank | Town | Population | Median Income | Median Home Value | Unemployment Rate |
|---|---|---|---|---|---|
| 1 | Del Mar | 3,903 | $199,152 | $3,626,890 | 1.8% |
| 2 | West Menlo Park | 3,634 | $250,001 | $2,108,567 | 6.3% |
| 3 | Carmel-by-the-Sea | 3,162 | $129,250 | $2,364,653 | 3.1% |
| 4 | Castle Hill | 1,026 | $250,001 | $2,108,567 | 0.0% |
| 5 | Mission Canyon | 2,357 | $208,466 | $2,108,567 | 3.1% |
| 6 | Ross | 2,606 | $250,001 | $3,904,003 | 0.7% |
| 7 | Broadmoor | 4,586 | $167,396 | $1,322,703 | 2.8% |
| 8 | Emerald Lake Hills | 4,235 | $250,001 | $2,913,160 | 2.6% |
| 9 | Ladera | 1,297 | $235,750 | $2,108,567 | 10.7% |
| 10 | Belvedere | 2,345 | $250,001 | $4,692,541 | 2.2% |
| 11 | Del Rio | 1,508 | $250,001 | $1,265,140 | 2.2% |
| 12 | Monte Sereno | 3,461 | $250,001 | $2,108,567 | 6.8% |
| 13 | Cambrian Park | 3,494 | $192,731 | $2,108,567 | 3.0% |
| 14 | Portola Valley | 4,305 | $250,001 | $4,275,093 | 3.1% |
| 15 | Los Ranchos | 1,467 | $121,800 | $1,312,477 | 0.0% |
| 16 | Fairbanks Ranch | 2,703 | $250,001 | $2,108,567 | 0.0% |
| 17 | Hidden Hills | 2,150 | $250,001 | $5,059,063 | 2.5% |
| 18 | Woodlands | 2,061 | $136,618 | $1,225,288 | 0.0% |
| 19 | Loyola | 3,430 | $250,001 | $2,108,567 | 6.0% |
| 20 | Acalanes Ridge | 1,006 | $181,094 | $1,721,750 | 7.7% |
| 21 | Los Olivos | 1,038 | $143,229 | $1,690,936 | 3.8% |
| 22 | Casa Conejo | 2,671 | $147,616 | $936,625 | 10.4% |
| 23 | Norris Canyon | 1,014 | $250,001 | $2,108,567 | 0.7% |
| 24 | Reliez Valley | 3,173 | $249,864 | $1,834,663 | 6.9% |
| 25 | Felton | 4,093 | $123,056 | $813,449 | 3.0% |
| 26 | Corralitos | 1,884 | $171,113 | $2,108,567 | 1.2% |
| 27 | Monument Hills | 1,551 | $218,333 | $890,447 | 1.7% |
| 28 | Del Monte Forest | 3,613 | $142,763 | $2,886,696 | 5.2% |
| 29 | Lexington Hills | 2,692 | $248,750 | $1,366,852 | 3.1% |
| 30 | Lake Sherwood | 1,633 | $234,020 | $2,108,567 | 5.3% |
| 31 | Rose Hills | 2,314 | $122,771 | $932,092 | 3.8% |
| 32 | El Verano | 3,443 | $123,738 | $958,660 | 6.3% |
| 33 | Rolling Hills | 1,509 | $250,001 | $3,122,204 | 5.6% |
| 34 | Indian Wells | 4,871 | $162,990 | $1,441,368 | 6.1% |
| 35 | Sunnyside-Tahoe City | 1,599 | $118,493 | $1,074,631 | 0.0% |
| 36 | Seacliff | 3,299 | $130,385 | $1,205,678 | 4.9% |
| 37 | Montara | 2,917 | $233,826 | $1,481,995 | 9.5% |
| 38 | La Selva Beach | 2,302 | $160,833 | $1,397,663 | 2.5% |
| 39 | Lagunitas-Forest Knolls | 1,626 | $130,682 | $990,499 | 2.4% |
| 40 | Del Rey Oaks | 1,570 | $134,500 | $898,160 | 12.4% |
| 41 | Aromas | 3,245 | $148,438 | $957,599 | 2.1% |
| 42 | Penryn | 1,114 | $127,361 | $930,455 | 5.5% |
| 43 | Santa Rosa Valley | 2,780 | $213,973 | $1,798,818 | 4.8% |
| 44 | Toro Canyon | 1,477 | $140,743 | $2,108,567 | 5.9% |
| 45 | West Bishop | 2,551 | $114,653 | $649,017 | 2.8% |
| 46 | Santa Susana | 1,235 | $99,783 | $704,894 | 3.3% |
| 47 | Avalon | 3,338 | $105,139 | $914,955 | 0.0% |
| 48 | Woodacre | 1,627 | $231,953 | $1,077,848 | 2.8% |
| 49 | Moss Beach | 2,683 | $99,680 | $1,522,459 | 0.2% |
| 50 | Bell Canyon | 2,177 | $250,001 | $2,204,587 | 8.7% |
| 51 | Tahoe Vista | 1,048 | $113,314 | $819,629 | 3.5% |
| 52 | Sleepy Hollow | 3,063 | $250,001 | $2,108,567 | 12.3% |
| 53 | La Honda | 1,269 | $250,001 | $991,660 | 0.0% |
| 54 | San Pasqual | 1,918 | $123,317 | $1,371,622 | 1.0% |
| 55 | Channel Islands Beach | 2,726 | $107,380 | $1,171,519 | 2.7% |
| 56 | North El Monte | 4,086 | $99,447 | $910,268 | 3.7% |
| 57 | Mather | 4,520 | $146,023 | $577,986 | 3.7% |
| 58 | Santa Venetia | 3,725 | $126,833 | $1,060,925 | 7.5% |
| 59 | Glen Ellen | 1,078 | $202,097 | $1,199,304 | 4.1% |
| 60 | Alto | 1,024 | $129,191 | $0 | 3.9% |
| 61 | Bishop | 3,778 | $83,686 | $593,362 | 0.3% |
| 62 | Hartley | 2,431 | $124,254 | $886,547 | 0.6% |
| 63 | East Richmond Heights | 3,109 | $134,632 | $965,091 | 8.9% |
| 64 | Brisbane | 4,692 | $156,169 | $1,159,533 | 8.7% |
| 65 | Dollar Point | 1,477 | $76,774 | $892,134 | 8.8% |
| 66 | Rancho Santa Fe | 2,260 | $175,792 | $4,316,489 | 9.8% |
| 67 | Diablo | 1,232 | $248,150 | $3,139,087 | 5.0% |
| 68 | Sea Ranch | 1,287 | $139,375 | $1,446,055 | 3.5% |
| 69 | Newcastle | 1,585 | $108,750 | $936,250 | 2.8% |
| 70 | Morada | 3,383 | $96,896 | $744,879 | 3.5% |
| 71 | Cutten | 3,550 | $97,225 | $496,884 | 1.1% |
| 72 | Day Valley | 3,579 | $155,000 | $1,348,744 | 5.6% |
| 73 | Shingle Springs | 3,801 | $135,530 | $665,602 | 4.1% |
| 74 | Aptos Hills-Larkin Valley | 2,127 | $158,788 | $1,249,325 | 1.0% |
| 75 | Mayflower Village | 4,950 | $105,242 | $937,468 | 4.6% |
| 76 | Meadow Vista | 3,162 | $100,859 | $648,738 | 2.4% |
| 77 | Lake San Marcos | 4,693 | $89,851 | $966,778 | 4.1% |
| 78 | Carmel Valley Village | 4,785 | $156,161 | $1,344,738 | 6.3% |
| 79 | Angwin | 2,931 | $117,500 | $920,817 | 7.5% |
| 80 | Black Point-Green Point | 1,655 | $168,438 | $1,793,546 | 6.6% |
| 81 | Angels | 3,716 | $62,188 | $511,116 | 2.2% |
| 82 | Kenwood | 1,028 | $99,526 | $1,290,401 | 0.0% |
| 83 | Forestville | 3,717 | $115,962 | $625,275 | 6.7% |
| 84 | Bolinas | 1,334 | $100,625 | $1,861,962 | 2.6% |
| 85 | Yountville | 3,348 | $80,342 | $1,333,294 | 5.6% |
| 86 | Callender | 2,230 | $136,346 | $996,719 | 6.8% |
| 87 | Mission Hills | 3,859 | $111,974 | $519,656 | 3.8% |
| 88 | Inverness | 1,346 | $80,176 | $1,477,550 | 10.0% |
| 89 | Romoland | 2,268 | $106,861 | $551,812 | 1.3% |
| 90 | Nevada City | 3,172 | $75,792 | $550,883 | 0.0% |
| 91 | East Oakdale | 2,269 | $119,844 | $903,099 | 1.6% |
| 92 | East Sonora | 2,651 | $77,574 | $353,290 | 0.7% |
| 93 | Allendale | 1,734 | $107,679 | $1,115,010 | 6.8% |
| 94 | Colma | 1,636 | $148,295 | $1,111,276 | 4.0% |
| 95 | Forest Meadows | 1,623 | $89,044 | $568,997 | 1.7% |
| 96 | Tuolumne City | 1,148 | $57,313 | $454,607 | 0.0% |
| 97 | Graton | 1,806 | $91,429 | $804,383 | 5.7% |
| 98 | Cayucos | 2,427 | $87,235 | $1,352,123 | 1.4% |
| 99 | Mountain View | 2,418 | $94,046 | $2,037,086 | 3.9% |
| 100 | San Juan Bautista | 2,033 | $115,833 | $921,728 | 4.2% |
Source: U.S. Census ACS 2020-2024 via Saturday Night Science. 359 California towns between 1,000 and 5,000 residents.
Summary
Summary: Science Can Tackle Any Issue, Even Small Ones
We said it once, and we’ll say it again — this list: it’s just science. We did the research, crunched the numbers, and it turns out these small towns in California are the best in which to live.
And who can argue with that?
The best small towns in California are Del Mar, West Menlo Park, Carmel-by-the-Sea, Castle Hill, Mission Canyon, Ross, Broadmoor, Emerald Lake Hills, Ladera, and Belvedere. Not sold on California? Take the two-minute Find Your Place quiz and see which state actually fits you.


