
Research Summary. Using the last five years of Census Data, we determined the levels of people without insurance for each state in the United States. The Affordable Care Act continues to help drive down the rate of the uninsured. Here is the high level summary of the data:
-
There are a total of 27,590,117 uninsued persons in the United States as of 2024, the most recently available data.
-
8.38% of Americans are uninsured.
-
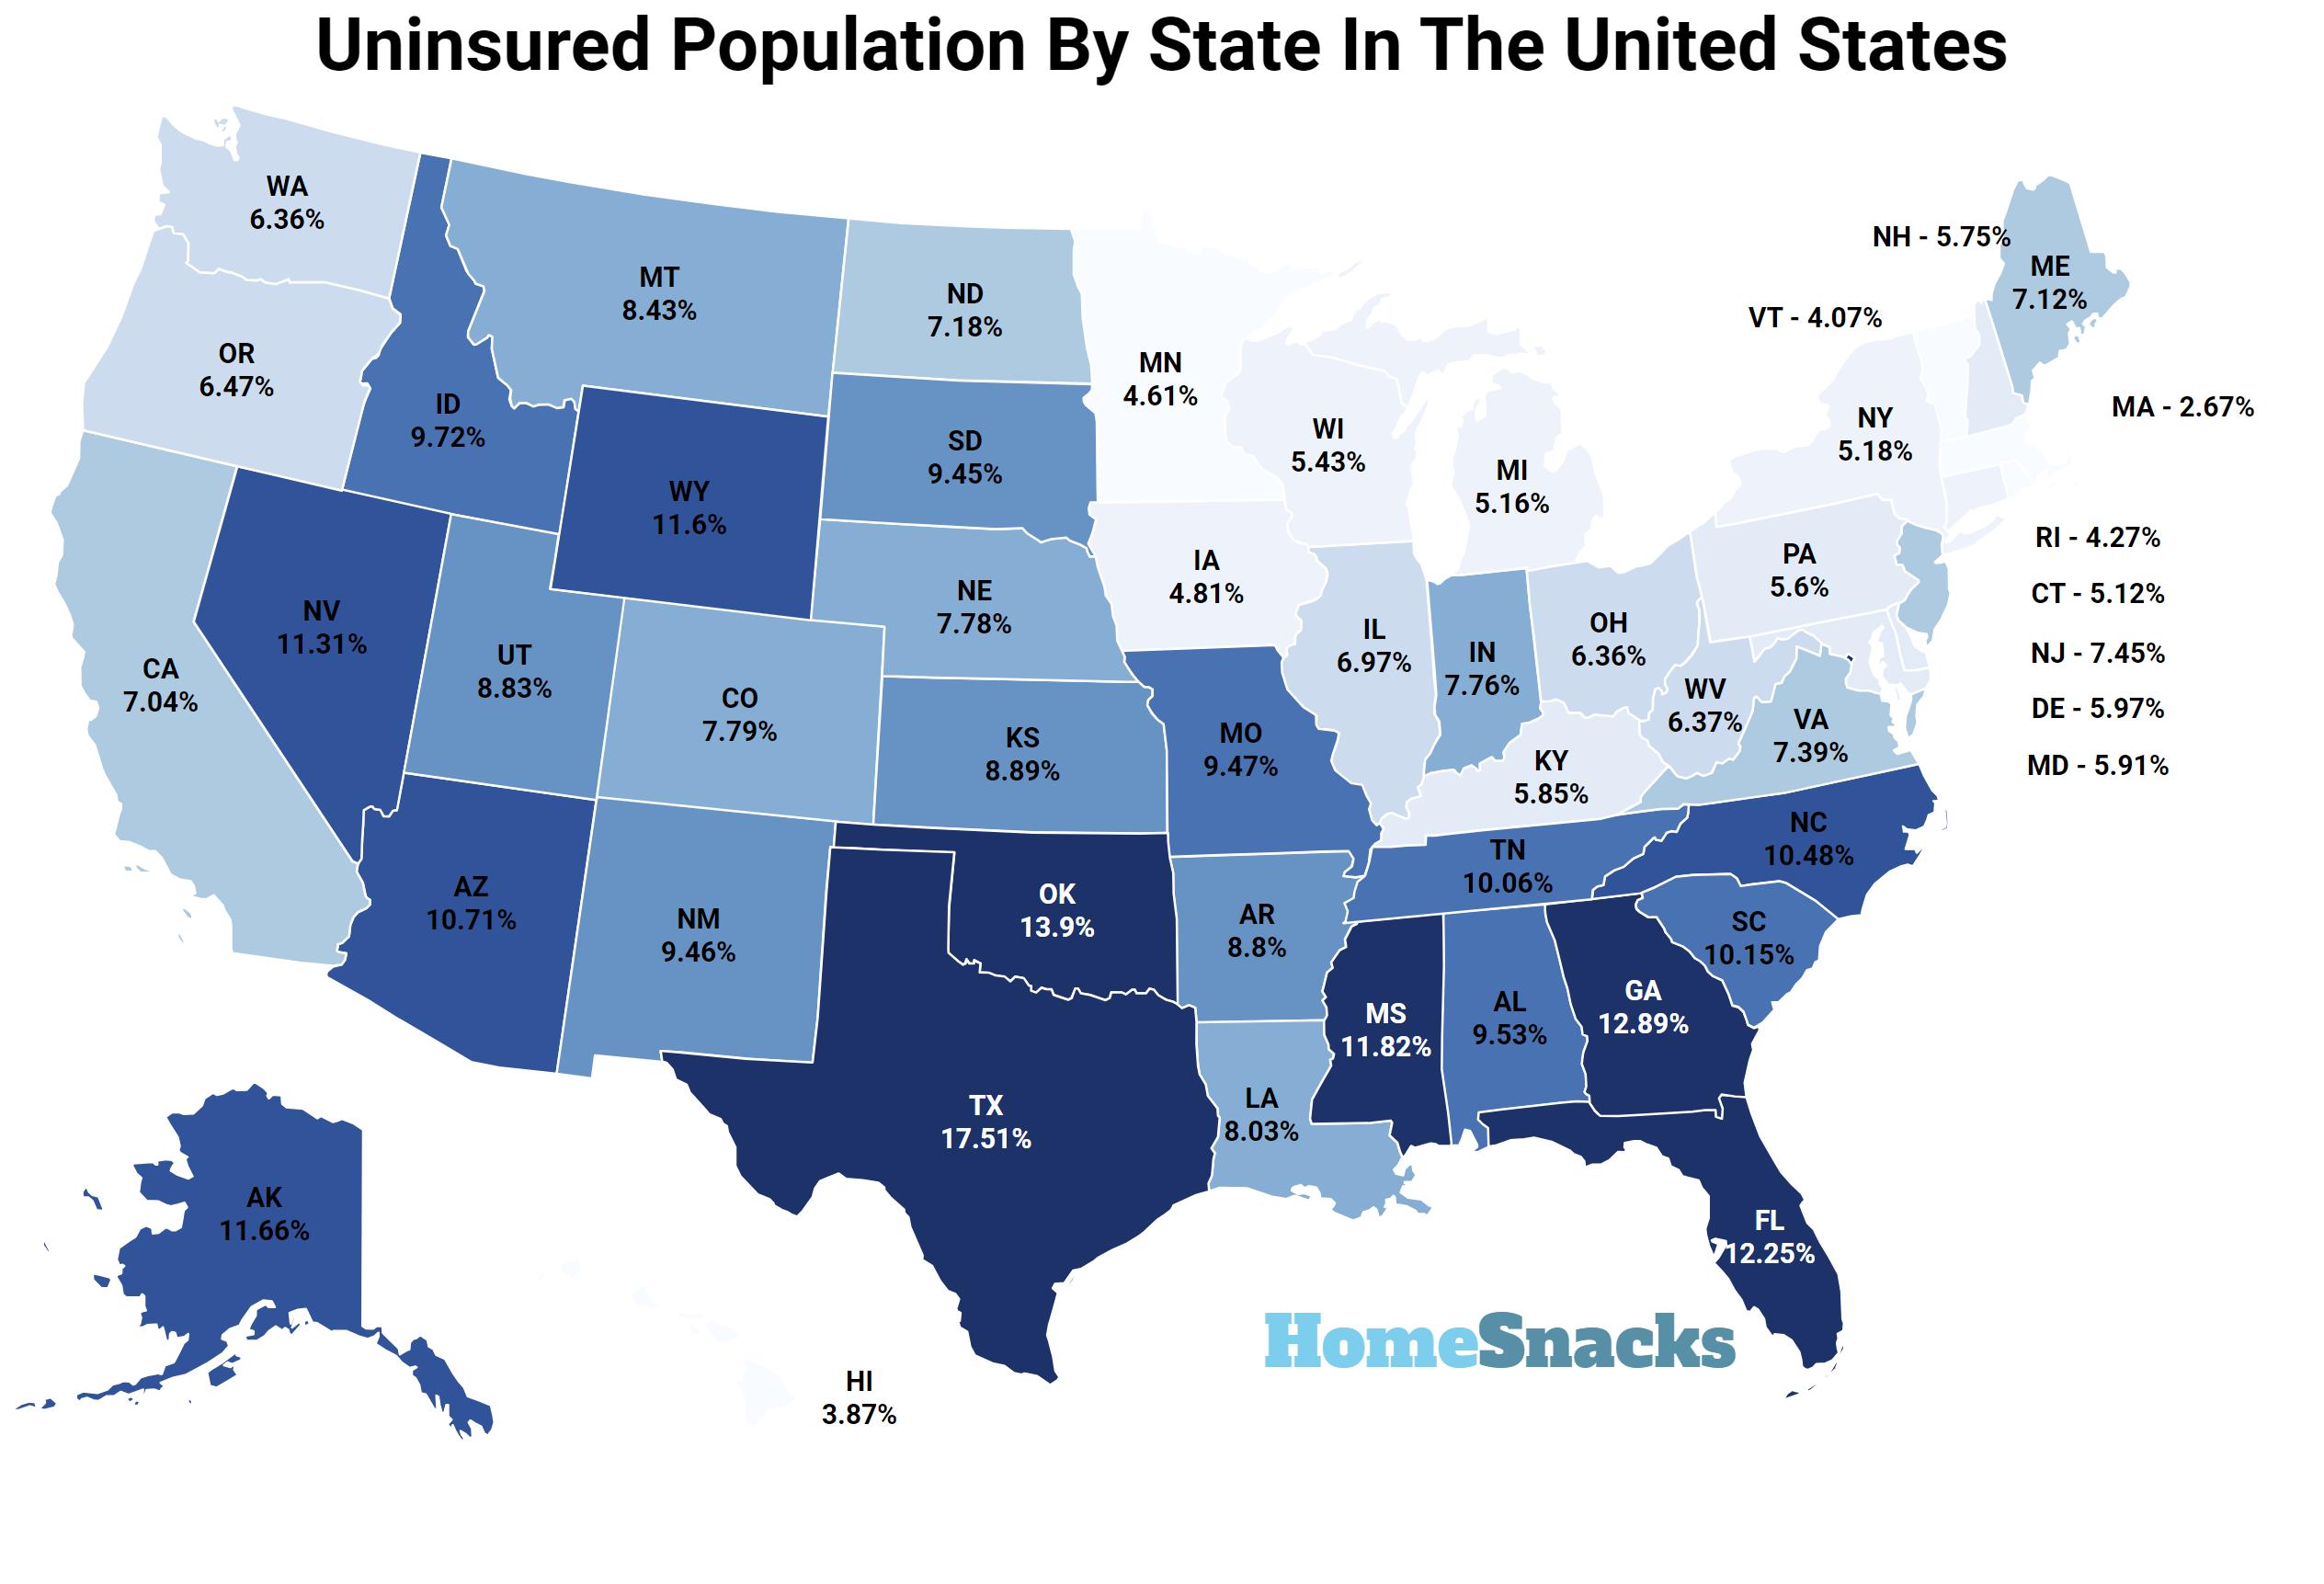
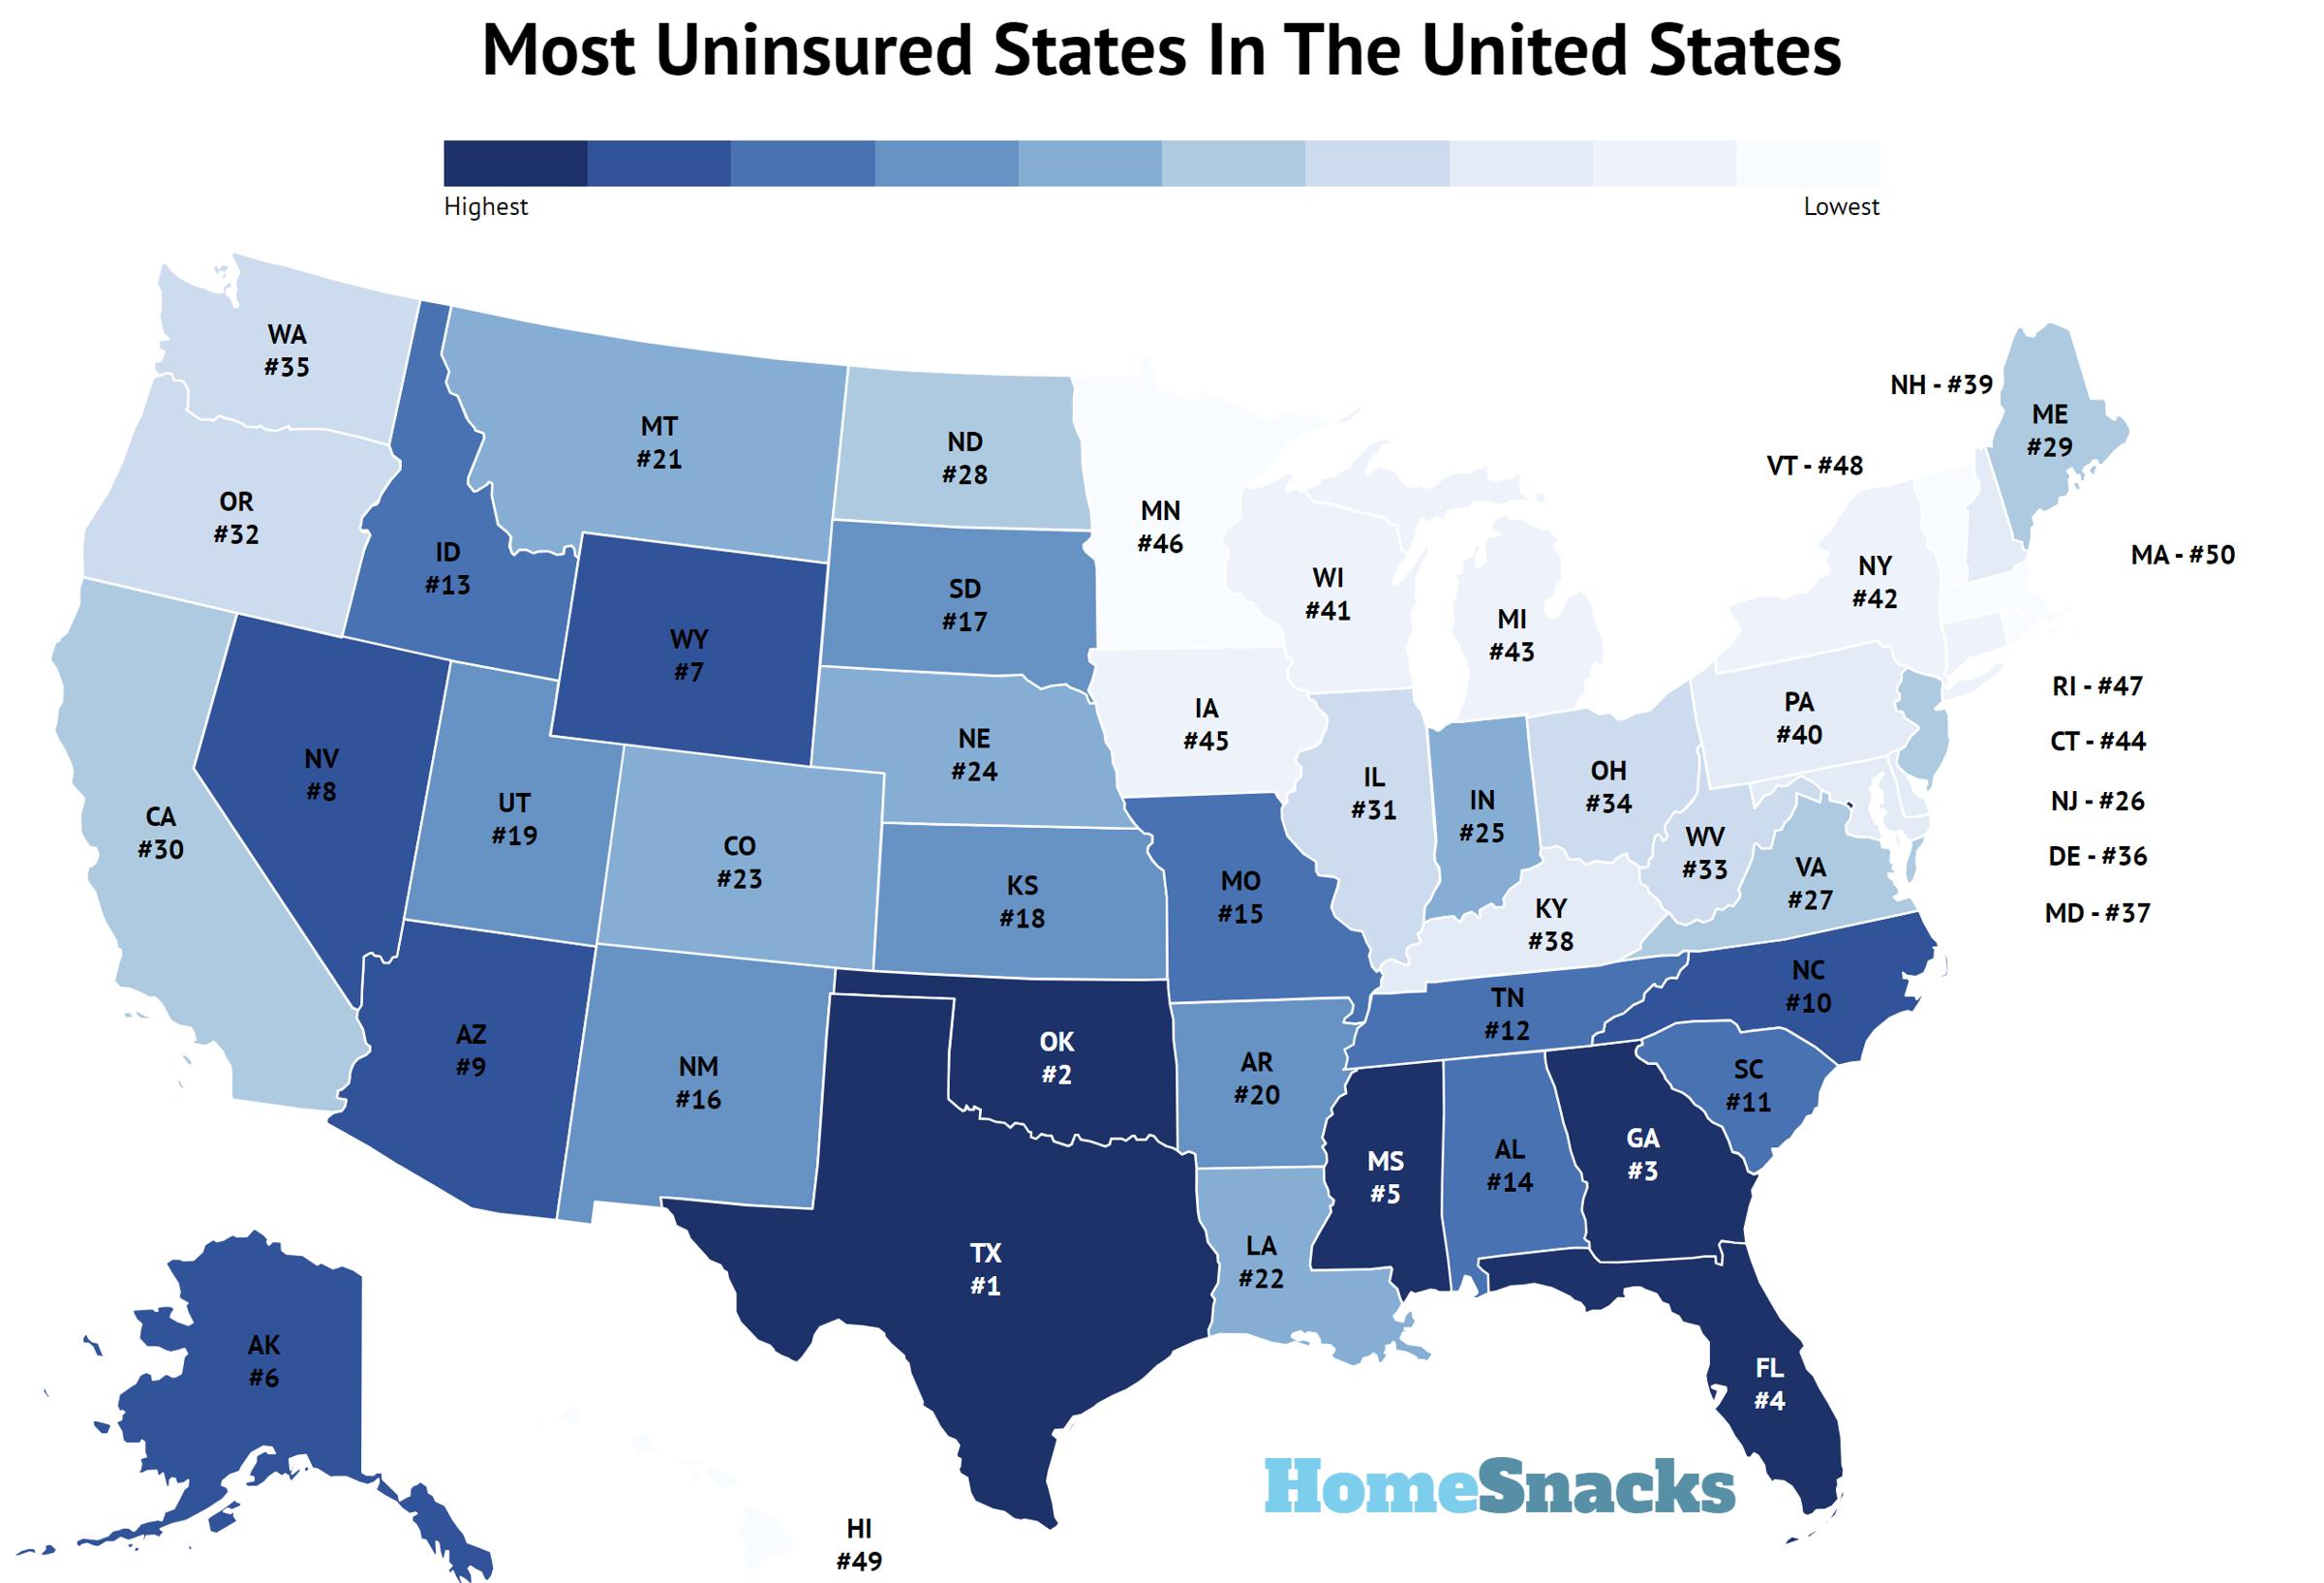
Texas has the highest number of uninsured people at 5,065,007.
-
Texas has the highest percentage of uninsured people at 17.06%.
-
Vermont has the lowest number of uninsured people at 25,035.
-
Massachusetts has the lowest percentage of uninsured people at 2.56%.
Uninsured By State Analysis For 2026
The uninsured population in America has been decreasing over the past decade as states continue to enroll more people in the Affordable Care Act, commonly known as Obamacare. The rate of unisured was over 18% in 2010, pre-Obamacare. That has since dropped to it’s current level of 8.38%. Unfotunately, the percent of uninsured has actually increased in the last several years of data from a low point of 10.4% in 2016.
While the overall population has seen a general decrease in the level of the uninsured, the rate very much depends on certain geographies and demographics. Certain geographies and demographic cohorts continue to see lowerthan average levels of insurance.
Geographiclly, the Northeast has some of the lowest levels of people without insurance led by Massachusetts. The south has continued to see relatively elevated levels of people without insurance with Texas being the state with the highest percentage of uninsured.
Demographically, men, people iving in relative poverty, and people of color continue to see insured rates lower than women, people with higher incomes, and the white population, respectively. Men have uninsurance rates about three percentage points higher than women. People who make under 200% of the federal poverty line have uninsured rates at least twice as high as the overall population. And the Black, Hispanic, and Native American population have rates of uninsured that are 30%+ higher than the white population.
Here’s a breakdown of the uninsured by race as of the most recent data:
| Race | % Uninsured |
|---|---|
| White | 7.8% |
| Black | 11.4% |
| Hispanic | 20% |
| Asian/Native Hawaiian and Pacific Islander | 7.4% |
| American Indian/Alaska Native | 21.7% |
| Multiple Races | 8.2% |
Here’s a breakdown of the uninsured by states with the largest number of uninsured:
- Texas – 5065007 Uninsured
- California – 2541712 Uninsured
- Florida – 2537393 Uninsured
- Georgia – 1325610 Uninsured
- North Carolina – 1034019 Uninsured
- New York – 986480 Uninsured
- Illinois – 853597 Uninsured
- Arizona – 760185 Uninsured
- Ohio – 743187 Uninsured
- Pennsylvania – 718861 Uninsured
Here’s a breakdown of the uninsured by states with the largest percent of uninsured:
- Texas – 17.055755676519738 % Uninsured
- Oklahoma – 12.829838502583684 % Uninsured
- Georgia – 12.335331637020914 % Uninsured
- Florida – 11.491602582360414 % Uninsured
- Nevada – 11.35465587868093 % Uninsured
- Wyoming – 11.281601227948414 % Uninsured
- Mississippi – 11.007338271752204 % Uninsured
- Alaska – 10.994760680969478 % Uninsured
- Arizona – 10.45956826530238 % Uninsured
- Tennessee – 10.004267891611336 % Uninsured
Number And Percent Uninsured By State: Table
| Rank | State | % Uninsured | Uninsured Population |
|---|---|---|---|
| 1 | Texas | 17.1% | 5,065,007 |
| 2 | Oklahoma | 12.8% | 505,606 |
| 3 | Georgia | 12.3% | 1,325,610 |
| 4 | Florida | 11.5% | 2,537,393 |
| 5 | Nevada | 11.4% | 357,242 |
| 6 | Wyoming | 11.3% | 64,532 |
| 7 | Mississippi | 11.0% | 317,412 |
| 8 | Alaska | 11.0% | 77,434 |
| 9 | Arizona | 10.5% | 760,185 |
| 10 | Tennessee | 10.0% | 697,363 |
| 11 | North Carolina | 9.8% | 1,034,019 |
| 12 | South Carolina | 9.6% | 499,846 |
| 13 | New Mexico | 9.6% | 199,069 |
| 14 | Alabama | 9.2% | 458,681 |
| 15 | Idaho | 9.0% | 172,360 |
| 16 | Arkansas | 9.0% | 269,411 |
| 17 | South Dakota | 9.0% | 79,791 |
| 18 | Kansas | 8.7% | 252,340 |
| 19 | Missouri | 8.7% | 532,377 |
| 20 | Montana | 8.5% | 93,969 |
| 21 | Utah | 8.4% | 282,550 |
| 22 | Louisiana | 7.8% | 352,772 |
| 23 | Colorado | 7.7% | 444,820 |
| 24 | New Jersey | 7.4% | 688,326 |
| 25 | Indiana | 7.3% | 495,964 |
| 26 | Nebraska | 7.1% | 139,013 |
| 27 | Virginia | 6.9% | 582,946 |
| 28 | Illinois | 6.8% | 853,597 |
| 29 | California | 6.5% | 2,541,712 |
| 30 | North Dakota | 6.4% | 49,417 |
| 31 | Ohio | 6.4% | 743,187 |
| 32 | Washington | 6.3% | 485,389 |
| 33 | Delaware | 6.3% | 63,247 |
| 34 | Maryland | 6.2% | 379,850 |
| 35 | Maine | 6.2% | 84,438 |
| 36 | Kentucky | 6.0% | 267,075 |
| 37 | West Virginia | 6.0% | 104,553 |
| 38 | Oregon | 5.9% | 246,787 |
| 39 | Pennsylvania | 5.6% | 718,861 |
| 40 | Connecticut | 5.3% | 190,717 |
| 41 | New Hampshire | 5.2% | 72,172 |
| 42 | Wisconsin | 5.2% | 305,635 |
| 43 | New York | 5.0% | 986,480 |
| 44 | Iowa | 5.0% | 157,723 |
| 45 | Michigan | 4.9% | 488,475 |
| 46 | Minnesota | 4.7% | 264,201 |
| 47 | Rhode Island | 4.4% | 47,357 |
| 48 | Vermont | 3.9% | 25,035 |
| 49 | Hawaii | 3.6% | 49,278 |
| 50 | Massachusetts | 2.6% | 178,893 |
Uninsured By State Methodology
To determine the number of uninsured people by state, we used the most recent American Community Survey Table B27010: TYPES OF HEALTH INSURANCE COVERAGE BY AGE. In particular, we looked at the percent of CIVILIAN NONINSTITUTIONALIZED POPULATION without insurance.
Conclusion
The rate of uninsured has decreased over the past five years of data, meaning the number of people with insurance has been increasing.
The states with the highest uninused rate are Texas, Oklahoma, Georgia, Florida, Nevada, Wyoming, Mississippi, Alaska, Arizona, and Tennessee.
The states with the lowest uninused rate are Massachusetts, Hawaii, Vermont, Rhode Island, Minnesota, Michigan, Iowa, New York, Wisconsin, and New Hampshire.
The states in the Northeast have the lowest rate of the uninsured and the states in the midwest and south have the highest levels of uninsured. As, mostly red states, start to embrace expanded medicaid programs under Obamacare, we can expect the number of uninsured to continue to decrease over time.