Belen SnackAbility
Overall SnackAbility
Crime in Belen summary. We use data from the FBI to determine the crime rates in Belen. Key points include:
There were 405 total crimes in Belen in the last reporting year.
The overall crime rate per 100,000 people in Belen is 5,394.2 / 100k people.
The violent crime rate per 100,000 people in Belen is 1,158.8 / 100k people.
The property crime rate per 100,000 people in Belen is 4,235.5 / 100k people.
Overall, crime in Belen is 154.54% above the national average.
Total Crimes
Above National Average
Crime In Belen Comparison Table
| Statistic | Count Raw |
Belen / 100k People |
New Mexico / 100k People |
National / 100k People |
|---|---|---|---|---|
| Total Crimes Per 100K | 405 | 5,394.2 | 3,468.2 | 2,119.2 |
| Violent Crime | 87 | 1,158.8 | 717.1 | 359.0 |
| Murder | 0 | 0.0 | 10.5 | 5.0 |
| Robbery | 1 | 13.3 | 65.3 | 61.0 |
| Aggravated Assault | 85 | 1,132.1 | 587.5 | 256.0 |
| Property Crime | 318 | 4,235.5 | 2,751.1 | 1,760.0 |
| Burglary | 71 | 945.7 | 500.3 | 229.0 |
| Larceny | 198 | 2,637.2 | 1,750.9 | 1,272.0 |
| Car Theft | 49 | 652.6 | 499.9 | 259.0 |
Source: FBI Uniform Crime Reporting (2024)
Cost of living in Belen summary. We use data on the cost of living to determine how expensive it is to live in Belen. Real estate prices drive most of the variance in cost of living around New Mexico. Key points include:
The cost of living in Belen is 87 with 100 being average.
The cost of living in Belen is 0.9x lower than the national average.
The median home value in Belen is $266,791.
The median income in Belen is $42,627.
Belen's Overall Cost Of Living
Lower Than The National Average
Cost Of Living In Belen Comparison Table
| Living Expense | Belen | New Mexico | National Average |
|---|---|---|---|
| Overall | 87 | 93 | 100 |
| Services | 100 | 98 | 100 |
| Groceries | 97 | 96 | 100 |
| Health | 62 | 86 | 100 |
| Housing | 101 | 99 | 100 |
| Transportation | 95 | 95 | 100 |
| Utilities | 91 | 94 | 100 |
Source: Cost of living index, normalized to US average = 100
Belen, NM Weather
The average high in Belen is 74.2° and the average low is 39.5°.
There are 26.3 days of precipitation each year.
Expect an average of 8.9 inches of precipitation each year with 6.0 inches of snow.
| Stat | Belen |
|---|---|
| Average Annual High | 74.2 |
| Average Annual Low | 39.5 |
| Annual Precipitation Days | 26.3 |
| Average Annual Precipitation | 8.9 |
| Average Annual Snowfall | 6.0 |
Average High
Days of Rain
Source: NOAA climate normals (30-year)
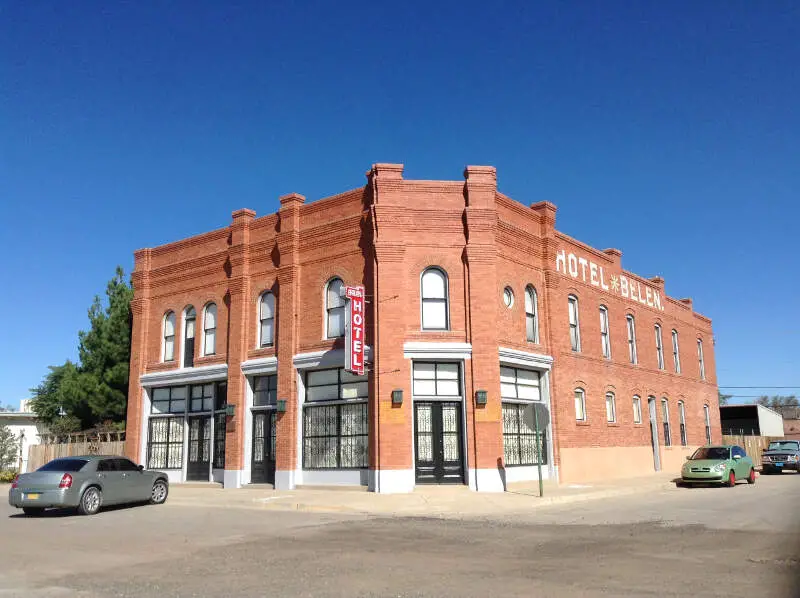
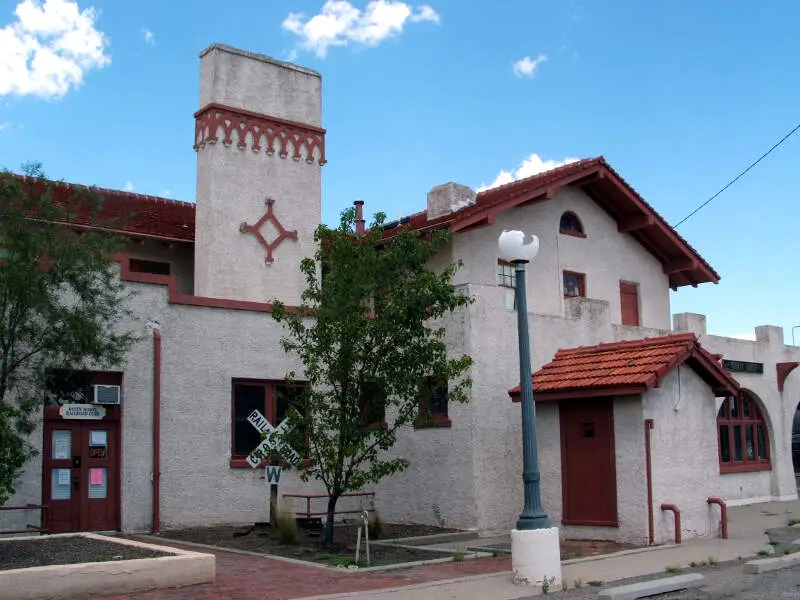
Belen, NM Photos


2 Reviews & Comments About Belen

Belen isnt a bad town.If i had stayed in roswell my kids wouldve been proably in trouble alot. Peer pressure alot there. My kids have there own families and doing great. We lived in belen 12 years great place.
Belen is not a bad place. Try roswell my hometown where lots of crime and shootings. Example a kid shooting in a school- Glad i moved to belen for sake of my kids.
Rankings & Articles For Belen


Locations Around Belen
Map Of Belen, NM
Best Places Around Belen
Bosque Farms, NM
Population 4,071
Peralta, NM
Population 3,404
Los Lunas, NM
Population 18,618
El Cerro Mission, NM
Population 5,323
Belen Demographics And Statistics
Population over time in Belen
The current population in Belen is 7,450. The population has increased 2.7% from 2010.
| Year | Population | % Change |
|---|---|---|
| 2024 | 7,450 | 0.3% |
| 2023 | 7,427 | 0.8% |
| 2022 | 7,367 | -0.1% |
| 2021 | 7,374 | -1.4% |
| 2020 | 7,476 | 1.0% |
| 2019 | 7,403 | 4.2% |
| 2018 | 7,106 | -0.3% |
| 2017 | 7,125 | -0.8% |
| 2016 | 7,184 | -0.3% |
| 2015 | 7,209 | -0.6% |
| 2014 | 7,249 | -0.3% |
| 2013 | 7,269 | 0.0% |
| 2012 | 7,267 | -0.1% |
| 2011 | 7,274 | 0.3% |
| 2010 | 7,255 | - |
Race / Ethnicity in Belen
See the full breakdown
Belen is:
26.1% White with 1,943 White residents.
0.9% African American with 70 African American residents.
0.2% American Indian with 13 American Indian residents.
0.2% Asian with 18 Asian residents.
0.0% Hawaiian with 0 Hawaiian residents.
1.1% Other with 84 Other residents.
3.2% Two Or More with 240 Two Or More residents.
68.2% Hispanic with 5,082 Hispanic residents.
| Race | Belen | NM | USA |
|---|---|---|---|
| White | 26.1% | 36.0% | 57.4% |
| African American | 0.9% | 1.8% | 11.9% |
| American Indian | 0.2% | 8.5% | 0.5% |
| Asian | 0.2% | 1.6% | 5.9% |
| Hawaiian | 0.0% | 0.1% | 0.2% |
| Other | 1.1% | 0.5% | 0.6% |
| Two Or More | 3.2% | 3.1% | 4.3% |
| Hispanic | 68.2% | 48.4% | 19.3% |
Gender in Belen
See the full breakdown
Belen is 53.1% female with 3,959 female residents.
Belen is 46.9% male with 3,490 male residents.
| Gender | Belen | NM | USA |
|---|---|---|---|
| Female | 53.1% | 50.3% | 50.5% |
| Male | 46.9% | 49.7% | 49.5% |
Highest level of educational attainment in Belen for adults over 25
See the full breakdown
12.0% of adults in Belen completed < 9th grade.
13.0% of adults in Belen completed 9-12th grade.
26.0% of adults in Belen completed high school / ged.
23.0% of adults in Belen completed some college.
13.0% of adults in Belen completed associate's degree.
8.0% of adults in Belen completed bachelor's degree.
4.0% of adults in Belen completed master's degree.
0.0% of adults in Belen completed professional degree.
1.0% of adults in Belen completed doctorate degree.
| Education | Belen | NM | USA |
|---|---|---|---|
| < 9th Grade | 12.0% | 5.0% | 4.0% |
| 9-12th Grade | 13.0% | 7.0% | 6.0% |
| High School / GED | 26.0% | 26.0% | 26.0% |
| Some College | 23.0% | 22.0% | 19.0% |
| Associate's Degree | 13.0% | 9.0% | 9.0% |
| Bachelor's Degree | 8.0% | 17.0% | 22.0% |
| Master's Degree | 4.0% | 10.0% | 10.0% |
| Professional Degree | 0.0% | 2.0% | 2.0% |
| Doctorate Degree | 1.0% | 2.0% | 2.0% |
Household Income For Belen, New Mexico
See the full breakdown
12.0% of households in Belen earn Less than $10,000.
10.6% of households in Belen earn $10,000 to $14,999.
5.8% of households in Belen earn $15,000 to $24,999.
15.3% of households in Belen earn $25,000 to $34,999.
14.9% of households in Belen earn $35,000 to $49,999.
12.5% of households in Belen earn $50,000 to $74,999.
14.0% of households in Belen earn $75,000 to $99,999.
9.8% of households in Belen earn $100,000 to $149,999.
4.4% of households in Belen earn $150,000 to $199,999.
0.8% of households in Belen earn $200,000 or more.
| Income | Belen | NM | USA |
|---|---|---|---|
| Less than $10,000 | 12.0% | 6.6% | 5.0% |
| $10,000 to $14,999 | 10.6% | 5.1% | 3.4% |
| $15,000 to $24,999 | 5.8% | 8.5% | 6.3% |
| $25,000 to $34,999 | 15.3% | 8.4% | 6.6% |
| $35,000 to $49,999 | 14.9% | 11.2% | 10.1% |
| $50,000 to $74,999 | 12.5% | 16.9% | 15.5% |
| $75,000 to $99,999 | 14.0% | 12.4% | 12.6% |
| $100,000 to $149,999 | 9.8% | 15.5% | 17.5% |
| $150,000 to $199,999 | 4.4% | 7.6% | 9.6% |
| $200,000 or more | 0.8% | 7.8% | 13.4% |
Source: U.S. Census ACS 5-year estimates (2024)


