Rio Rancho SnackAbility
Overall SnackAbility
Crime in Rio Rancho summary. We use data from the FBI to determine the crime rates in Rio Rancho. Key points include:
There were 1,870 total crimes in Rio Rancho in the last reporting year.
The overall crime rate per 100,000 people in Rio Rancho is 1,657.6 / 100k people.
The violent crime rate per 100,000 people in Rio Rancho is 318.2 / 100k people.
The property crime rate per 100,000 people in Rio Rancho is 1,339.3 / 100k people.
Overall, crime in Rio Rancho is -21.79% below the national average.
Total Crimes
Below National Average
Crime In Rio Rancho Comparison Table
| Statistic | Count Raw |
Rio Rancho / 100k People |
New Mexico / 100k People |
National / 100k People |
|---|---|---|---|---|
| Total Crimes Per 100K | 1,870 | 1,657.6 | 3,468.2 | 2,119.2 |
| Violent Crime | 359 | 318.2 | 717.1 | 359.0 |
| Murder | 8 | 7.1 | 10.5 | 5.0 |
| Robbery | 9 | 8.0 | 65.3 | 61.0 |
| Aggravated Assault | 300 | 265.9 | 587.5 | 256.0 |
| Property Crime | 1,511 | 1,339.3 | 2,751.1 | 1,760.0 |
| Burglary | 213 | 188.8 | 500.3 | 229.0 |
| Larceny | 1,153 | 1,022.0 | 1,750.9 | 1,272.0 |
| Car Theft | 145 | 128.5 | 499.9 | 259.0 |
Source: FBI Uniform Crime Reporting (2024)
Cost of living in Rio Rancho summary. We use data on the cost of living to determine how expensive it is to live in Rio Rancho. Real estate prices drive most of the variance in cost of living around New Mexico. Key points include:
The cost of living in Rio Rancho is 100 with 100 being average.
The cost of living in Rio Rancho is 1.0x lower than the national average.
The median home value in Rio Rancho is $361,856.
The median income in Rio Rancho is $89,596.
Rio Rancho's Overall Cost Of Living
Lower Than The National Average
Cost Of Living In Rio Rancho Comparison Table
| Living Expense | Rio Rancho | New Mexico | National Average |
|---|---|---|---|
| Overall | 100 | 93 | 100 |
| Services | 99 | 98 | 100 |
| Groceries | 100 | 96 | 100 |
| Health | 112 | 86 | 100 |
| Housing | 98 | 99 | 100 |
| Transportation | 98 | 95 | 100 |
| Utilities | 94 | 94 | 100 |
Source: Cost of living index, normalized to US average = 100
Rio Rancho, NM Weather
The average high in Rio Rancho is 69.7° and the average low is 40.1°.
There are 27.6 days of precipitation each year.
Expect an average of 11.0 inches of precipitation each year with 11.3 inches of snow.
| Stat | Rio Rancho |
|---|---|
| Average Annual High | 69.7 |
| Average Annual Low | 40.1 |
| Annual Precipitation Days | 27.6 |
| Average Annual Precipitation | 11.0 |
| Average Annual Snowfall | 11.3 |
Average High
Days of Rain
Source: NOAA climate normals (30-year)
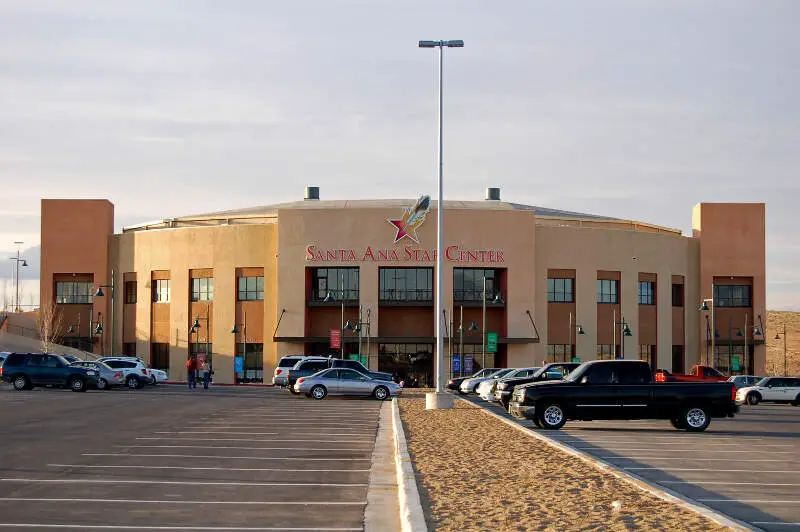
Rio Rancho, NM Photos


2 Reviews & Comments About Rio Rancho

It's not the worst place you could live but it is NO where close to the best. I moved here a year ago and I already want to leave. Of course we are in New Mexico. So we are the best of the worst-! The hype and advertising of the city worked on us. But after being here a few months we saw the true side of this town. The government is a joke. Everyone talks about "community" and that the crime is low....false advertising! The crime is still ridiculous. People here are very rude. There are more "bad" areas of the city than good. Even the neighborhood I live in, that is deemed a "nicer" community, is still riddled with trash. No standards are present. The intelligence level of the majority is lacking to say the least. The list goes on but I am sure you know what direction we are now going.
Nothing stands out. It's a poor town full of people that are either too blind to see the squaller and idiocy they live in or they are in denial. On the only positive note, the view of the mountains are beautiful.
We moved here 2 1/2 yrs. ago. My wife loves it. I feel that living in NM is more like doing time. Why keep building more federal prisons when we have NM- Offenders could be sentenced to live here. And we live in Rio Rancho which is supposed to be one of the best places in the state. If that's the case, I shudder to imagine the worst...
I know, if I don't like it...blah, blah, blah."
Rankings & Articles For Rio Rancho


Locations Around Rio Rancho
Map Of Rio Rancho, NM
Best Places Around Rio Rancho
North Valley, NM
Population 10,455
Albuquerque, NM
Population 562,218
Los Ranchos de Albuquerque, NM
Population 5,857
South Valley, NM
Population 37,120
Bernalillo, NM
Population 9,086
Rio Rancho Demographics And Statistics
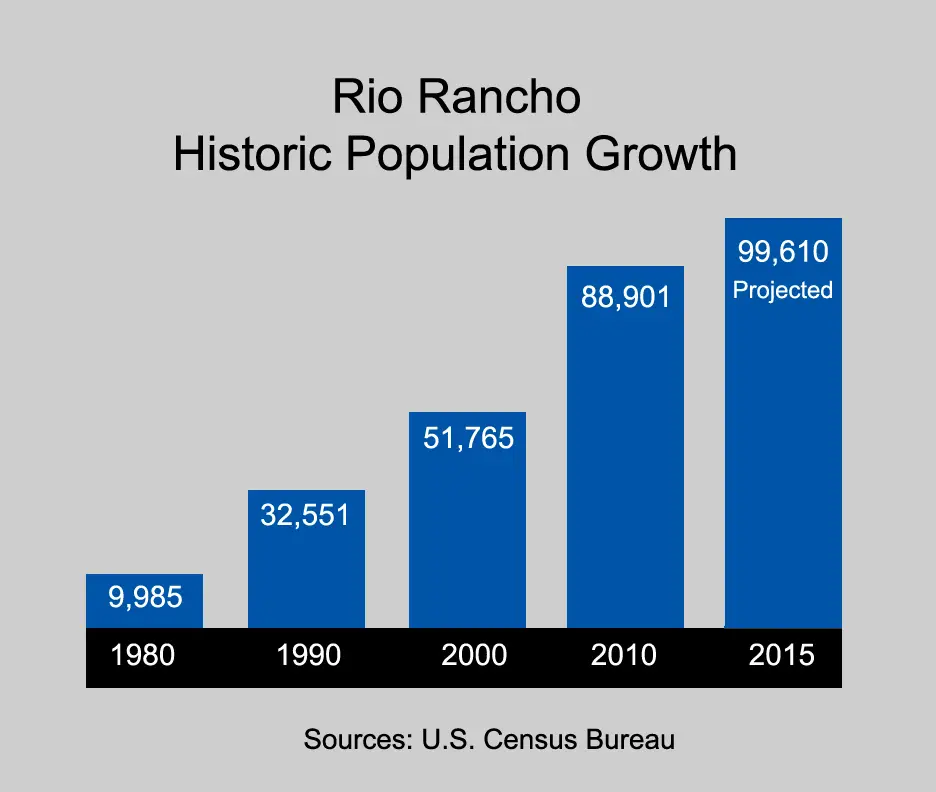
Population over time in Rio Rancho
The current population in Rio Rancho is 108,515. The population has increased 33.9% from 2010.
| Year | Population | % Change |
|---|---|---|
| 2024 | 108,515 | 1.9% |
| 2023 | 106,533 | 2.1% |
| 2022 | 104,351 | 1.9% |
| 2021 | 102,403 | 4.5% |
| 2020 | 97,976 | 1.8% |
| 2019 | 96,210 | 1.5% |
| 2018 | 94,765 | 1.6% |
| 2017 | 93,317 | 0.4% |
| 2016 | 92,966 | 1.3% |
| 2015 | 91,807 | 1.3% |
| 2014 | 90,627 | 1.7% |
| 2013 | 89,098 | 2.3% |
| 2012 | 87,068 | 3.2% |
| 2011 | 84,355 | 4.1% |
| 2010 | 81,056 | - |
Race / Ethnicity in Rio Rancho
See the full breakdown
Rio Rancho is:
44.7% White with 48,484 White residents.
2.8% African American with 3,068 African American residents.
3.5% American Indian with 3,824 American Indian residents.
1.5% Asian with 1,617 Asian residents.
0.1% Hawaiian with 136 Hawaiian residents.
0.7% Other with 769 Other residents.
4.5% Two Or More with 4,928 Two Or More residents.
42.1% Hispanic with 45,689 Hispanic residents.
| Race | Rio Rancho | NM | USA |
|---|---|---|---|
| White | 44.7% | 36.0% | 57.4% |
| African American | 2.8% | 1.8% | 11.9% |
| American Indian | 3.5% | 8.5% | 0.5% |
| Asian | 1.5% | 1.6% | 5.9% |
| Hawaiian | 0.1% | 0.1% | 0.2% |
| Other | 0.7% | 0.5% | 0.6% |
| Two Or More | 4.5% | 3.1% | 4.3% |
| Hispanic | 42.1% | 48.4% | 19.3% |
Gender in Rio Rancho
See the full breakdown
Rio Rancho is 50.4% female with 54,664 female residents.
Rio Rancho is 49.6% male with 53,851 male residents.
| Gender | Rio Rancho | NM | USA |
|---|---|---|---|
| Female | 50.4% | 50.3% | 50.5% |
| Male | 49.6% | 49.7% | 49.5% |
Highest level of educational attainment in Rio Rancho for adults over 25
See the full breakdown
1.0% of adults in Rio Rancho completed < 9th grade.
3.0% of adults in Rio Rancho completed 9-12th grade.
24.0% of adults in Rio Rancho completed high school / ged.
25.0% of adults in Rio Rancho completed some college.
12.0% of adults in Rio Rancho completed associate's degree.
21.0% of adults in Rio Rancho completed bachelor's degree.
10.0% of adults in Rio Rancho completed master's degree.
2.0% of adults in Rio Rancho completed professional degree.
2.0% of adults in Rio Rancho completed doctorate degree.
| Education | Rio Rancho | NM | USA |
|---|---|---|---|
| < 9th Grade | 1.0% | 5.0% | 4.0% |
| 9-12th Grade | 3.0% | 7.0% | 6.0% |
| High School / GED | 24.0% | 26.0% | 26.0% |
| Some College | 25.0% | 22.0% | 19.0% |
| Associate's Degree | 12.0% | 9.0% | 9.0% |
| Bachelor's Degree | 21.0% | 17.0% | 22.0% |
| Master's Degree | 10.0% | 10.0% | 10.0% |
| Professional Degree | 2.0% | 2.0% | 2.0% |
| Doctorate Degree | 2.0% | 2.0% | 2.0% |
Household Income For Rio Rancho, New Mexico
See the full breakdown
2.9% of households in Rio Rancho earn Less than $10,000.
2.5% of households in Rio Rancho earn $10,000 to $14,999.
3.6% of households in Rio Rancho earn $15,000 to $24,999.
5.0% of households in Rio Rancho earn $25,000 to $34,999.
7.9% of households in Rio Rancho earn $35,000 to $49,999.
20.2% of households in Rio Rancho earn $50,000 to $74,999.
14.4% of households in Rio Rancho earn $75,000 to $99,999.
22.7% of households in Rio Rancho earn $100,000 to $149,999.
11.3% of households in Rio Rancho earn $150,000 to $199,999.
9.6% of households in Rio Rancho earn $200,000 or more.
| Income | Rio Rancho | NM | USA |
|---|---|---|---|
| Less than $10,000 | 2.9% | 6.6% | 5.0% |
| $10,000 to $14,999 | 2.5% | 5.1% | 3.4% |
| $15,000 to $24,999 | 3.6% | 8.5% | 6.3% |
| $25,000 to $34,999 | 5.0% | 8.4% | 6.6% |
| $35,000 to $49,999 | 7.9% | 11.2% | 10.1% |
| $50,000 to $74,999 | 20.2% | 16.9% | 15.5% |
| $75,000 to $99,999 | 14.4% | 12.4% | 12.6% |
| $100,000 to $149,999 | 22.7% | 15.5% | 17.5% |
| $150,000 to $199,999 | 11.3% | 7.6% | 9.6% |
| $200,000 or more | 9.6% | 7.8% | 13.4% |
Source: U.S. Census ACS 5-year estimates (2024)


