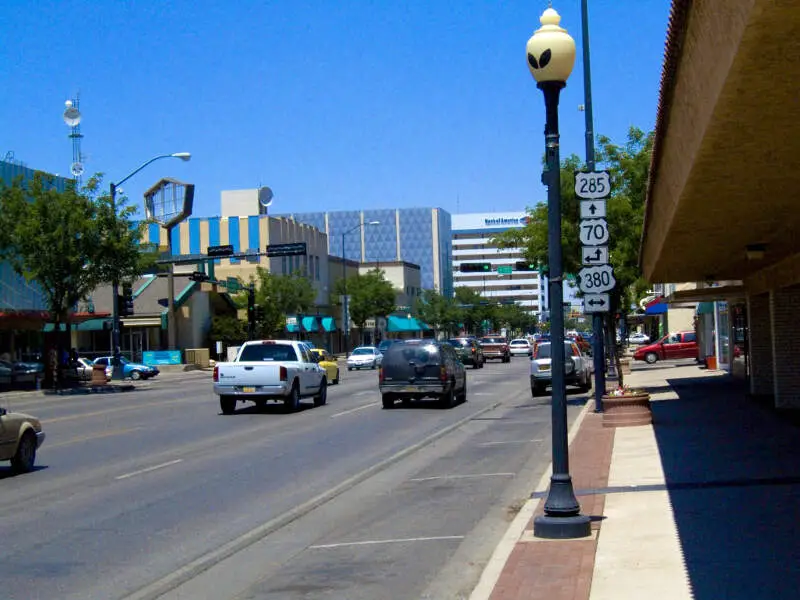
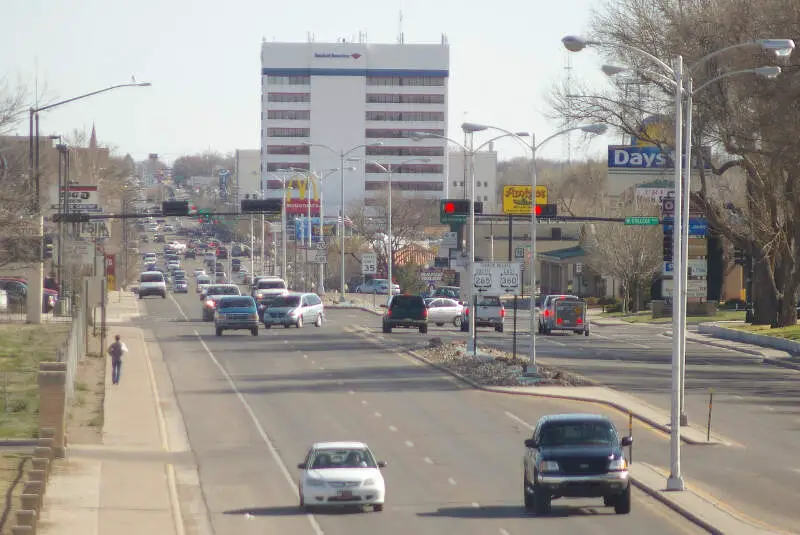
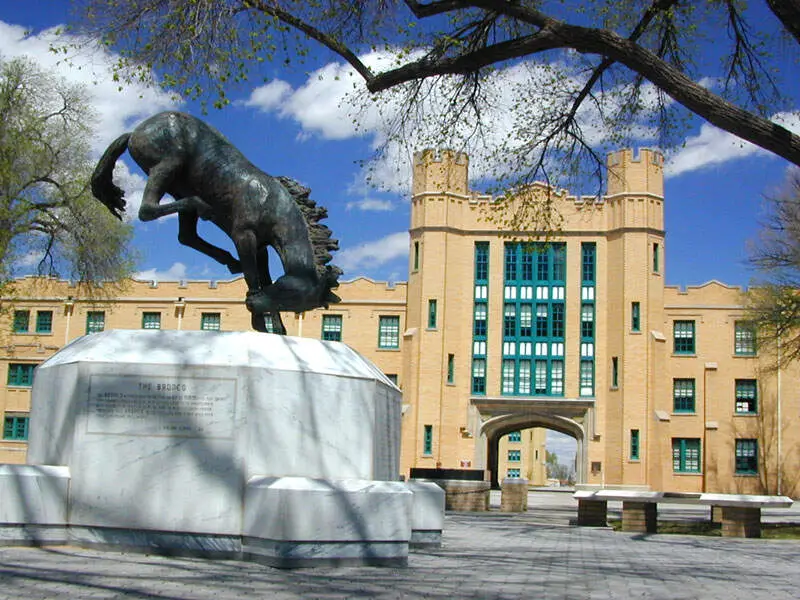
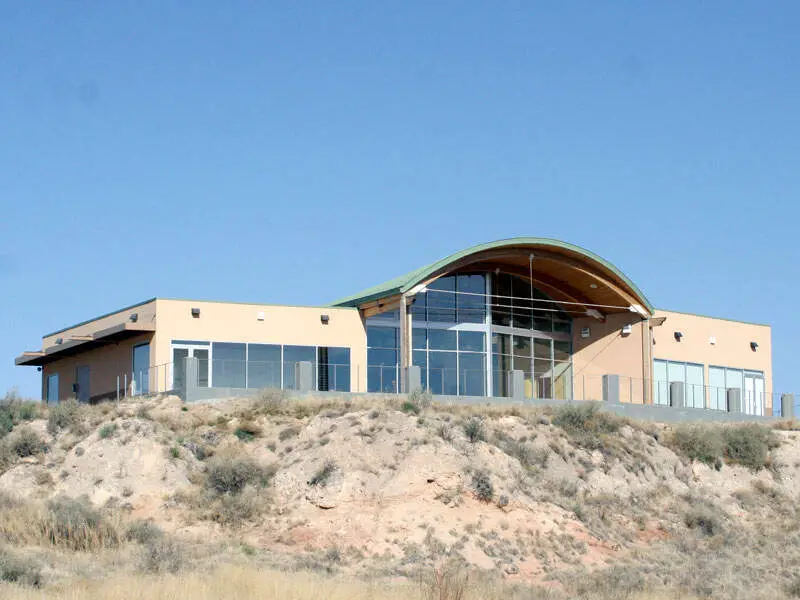
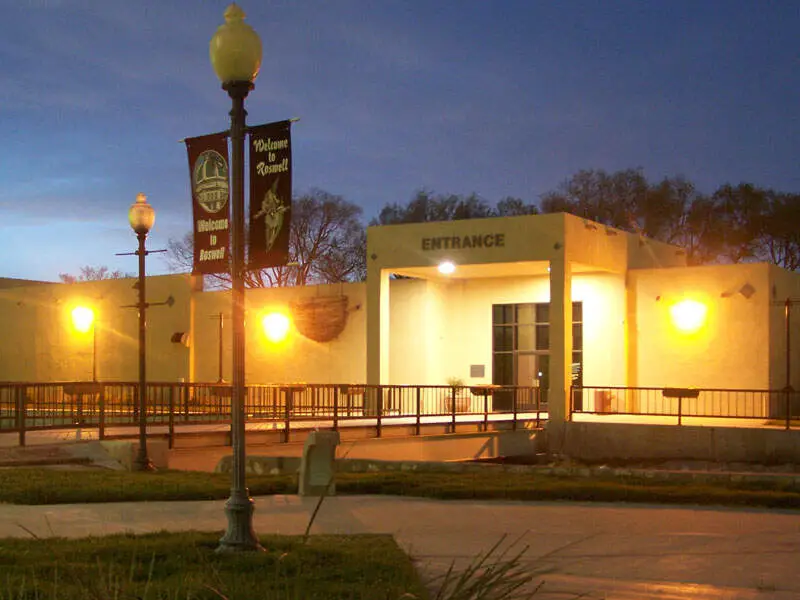
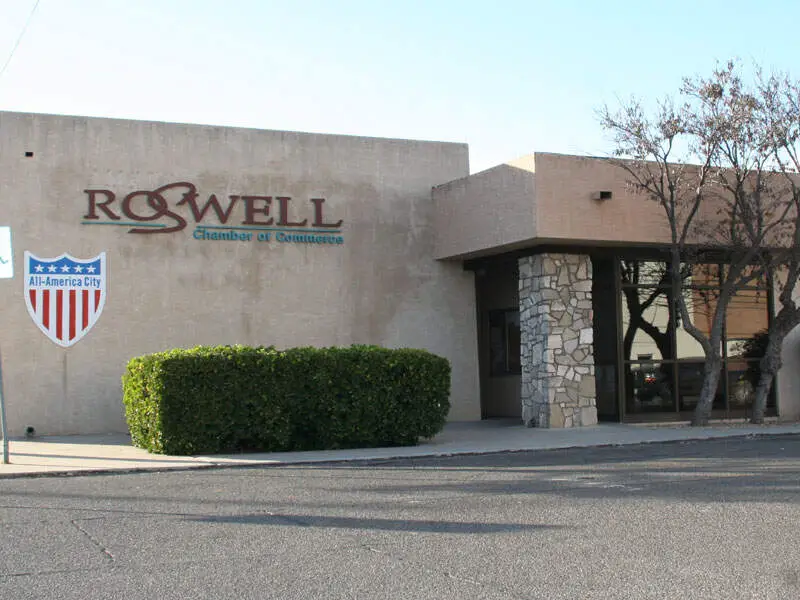
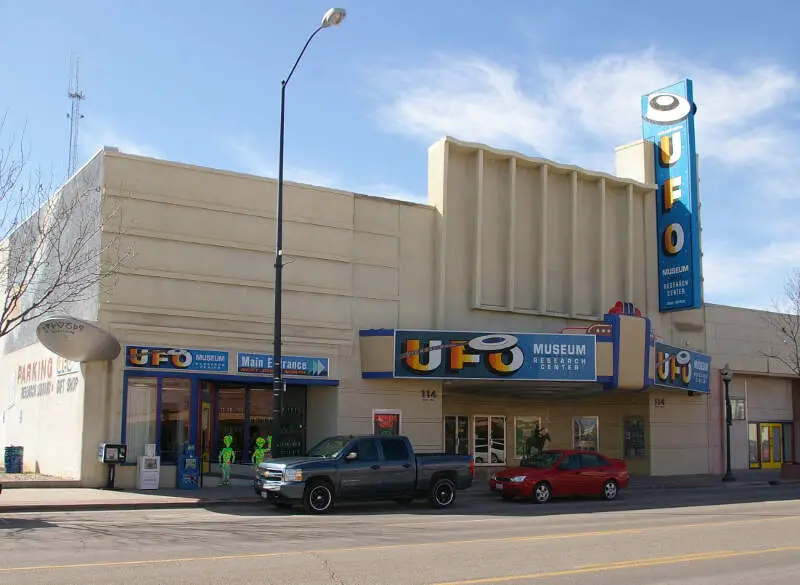
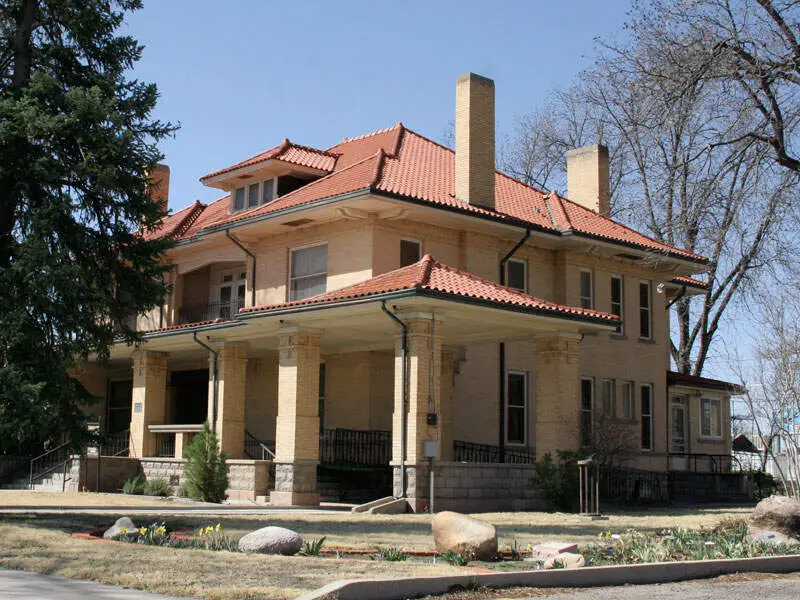
Roswell, NM
Demographics And Statistics
Living In Roswell, New Mexico Summary
Life in Roswell research summary. HomeSnacks has been using Saturday Night Science to research the quality of life in Roswell over the past nine years using Census, FBI, Zillow, and other primary data sources. Based on the most recently available data, we found the following about life in Roswell:
The population in Roswell is 47,823.
The median home value in Roswell is $169,414.
The median income in Roswell is $50,294.
The cost of living in Roswell is 84 which is 0.8x lower than the national average.
The median rent in Roswell is $840.
The unemployment rate in Roswell is 5.9%.
The poverty rate in Roswell is 24.2%.
The average high in Roswell is 76.1° and the average low is 44.3°.
Roswell SnackAbility
Overall SnackAbility
Roswell, NM Crime Report
Crime in Roswell summary. We use data from the FBI to determine the crime rates in Roswell. Key points include:
There were 1,567 total crimes in Roswell in the last reporting year.
The overall crime rate per 100,000 people in Roswell is 3,357.1 / 100k people.
The violent crime rate per 100,000 people in Roswell is 848.4 / 100k people.
The property crime rate per 100,000 people in Roswell is 2,508.7 / 100k people.
Overall, crime in Roswell is 58.41% above the national average.
Total Crimes
Above National Average
Crime In Roswell Comparison Table
| Statistic | Count Raw |
Roswell / 100k People |
New Mexico / 100k People |
National / 100k People |
|---|---|---|---|---|
| Total Crimes Per 100K | 1,567 | 3,357.1 | 3,468.2 | 2,119.2 |
| Violent Crime | 396 | 848.4 | 717.1 | 359.0 |
| Murder | 6 | 12.9 | 10.5 | 5.0 |
| Robbery | 20 | 42.8 | 65.3 | 61.0 |
| Aggravated Assault | 332 | 711.3 | 587.5 | 256.0 |
| Property Crime | 1,171 | 2,508.7 | 2,751.1 | 1,760.0 |
| Burglary | 200 | 428.5 | 500.3 | 229.0 |
| Larceny | 879 | 1,883.2 | 1,750.9 | 1,272.0 |
| Car Theft | 92 | 197.1 | 499.9 | 259.0 |
Roswell, NM Cost Of Living
Cost of living in Roswell summary. We use data on the cost of living to determine how expensive it is to live in Roswell. Real estate prices drive most of the variance in cost of living around New Mexico. Key points include:
The cost of living in Roswell is 84 with 100 being average.
The cost of living in Roswell is 0.8x lower than the national average.
The median home value in Roswell is $169,414.
The median income in Roswell is $50,294.
Roswell's Overall Cost Of Living
Lower Than The National Average
Cost Of Living In Roswell Comparison Table
| Living Expense | Roswell | New Mexico | National Average | |
|---|---|---|---|---|
| Overall | 84 | 95 | 100 | |
| Services | 92 | 96 | 100 | |
| Groceries | 96 | 96 | 100 | |
| Health | 99 | 95 | 100 | |
| Housing | 69 | 87 | 100 | |
| Transportation | 97 | 93 | 100 | |
| Utilities | 80 | 89 | 100 | |
Roswell, NM Weather
The average high in Roswell is 76.1° and the average low is 44.3°.
There are 26.9 days of precipitation each year.
Expect an average of 13.1 inches of precipitation each year with 9.6 inches of snow.
| Stat | Roswell |
|---|---|
| Average Annual High | 76.1 |
| Average Annual Low | 44.3 |
| Annual Precipitation Days | 26.9 |
| Average Annual Precipitation | 13.1 |
| Average Annual Snowfall | 9.6 |
Average High
Days of Rain
Roswell, NM Photos

1 Reviews & Comments About Roswell
/5

HomeSnacks User - 2019-05-18 17:12:51.758602
We love our new home state because houses are affordable and the people are wonderful. I agree what you described is Albuquerque. The mountains here are stunning. The climate is astonishing. NM is enchanting. Sorry you have not seen more of it.
Science abounds here. Space history, solar studies, and the Very Large Array.
Rankings for Roswell in New Mexico


Locations Around Roswell
Map Of Roswell, NM
Best Places Around Roswell
Artesia, NM
Population 12,555
Roswell Demographics And Statistics
Population over time in Roswell
The current population in Roswell is 47,823. The population has increased 0.9% from 2010.
| Year | Population | % Change |
|---|---|---|
| 2023 | 47,823 | -0.4% |
| 2022 | 48,035 | -0.6% |
| 2021 | 48,347 | 1.2% |
| 2020 | 47,751 | -0.4% |
| 2019 | 47,941 | -0.5% |
| 2018 | 48,186 | 0.0% |
| 2017 | 48,163 | -0.5% |
| 2016 | 48,407 | -0.3% |
| 2015 | 48,553 | -0.0% |
| 2014 | 48,568 | 0.3% |
| 2013 | 48,423 | 0.5% |
| 2012 | 48,167 | 0.6% |
| 2011 | 47,881 | 1.0% |
| 2010 | 47,414 | - |
Race / Ethnicity in Roswell
Roswell is:
33.6% White with 16,078 White residents.
1.7% African American with 797 African American residents.
0.4% American Indian with 200 American Indian residents.
1.4% Asian with 693 Asian residents.
0.1% Hawaiian with 49 Hawaiian residents.
0.3% Other with 152 Other residents.
1.4% Two Or More with 652 Two Or More residents.
61.1% Hispanic with 29,202 Hispanic residents.
| Race | Roswell | NM | USA |
|---|---|---|---|
| White | 33.6% | 36.5% | 58.2% |
| African American | 1.7% | 1.8% | 12.0% |
| American Indian | 0.4% | 8.6% | 0.5% |
| Asian | 1.4% | 1.6% | 5.7% |
| Hawaiian | 0.1% | 0.1% | 0.2% |
| Other | 0.3% | 0.4% | 0.5% |
| Two Or More | 1.4% | 2.8% | 3.9% |
| Hispanic | 61.1% | 48.2% | 19.0% |
Gender in Roswell
Roswell is 50.1% female with 23,944 female residents.
Roswell is 49.9% male with 23,879 male residents.
| Gender | Roswell | NM | USA |
|---|---|---|---|
| Female | 50.1% | 50.3% | 50.5% |
| Male | 49.9% | 49.7% | 49.5% |
Highest level of educational attainment in Roswell for adults over 25
9.0% of adults in Roswell completed < 9th grade.
10.0% of adults in Roswell completed 9-12th grade.
27.0% of adults in Roswell completed high school / ged.
25.0% of adults in Roswell completed some college.
9.0% of adults in Roswell completed associate's degree.
12.0% of adults in Roswell completed bachelor's degree.
5.0% of adults in Roswell completed master's degree.
2.0% of adults in Roswell completed professional degree.
1.0% of adults in Roswell completed doctorate degree.
| Education | Roswell | NM | USA |
|---|---|---|---|
| < 9th Grade | 9.0% | 4.0% | 5.0% |
| 9-12th Grade | 10.0% | 7.0% | 6.0% |
| High School / GED | 27.0% | 26.0% | 26.0% |
| Some College | 25.0% | 23.0% | 19.0% |
| Associate's Degree | 9.0% | 9.0% | 9.0% |
| Bachelor's Degree | 12.0% | 17.0% | 21.0% |
| Master's Degree | 5.0% | 10.0% | 10.0% |
| Professional Degree | 2.0% | 2.0% | 2.0% |
| Doctorate Degree | 1.0% | 2.0% | 2.0% |
Household Income For Roswell, New Mexico
6.4% of households in Roswell earn Less than $10,000.
9.2% of households in Roswell earn $10,000 to $14,999.
11.9% of households in Roswell earn $15,000 to $24,999.
9.6% of households in Roswell earn $25,000 to $34,999.
12.6% of households in Roswell earn $35,000 to $49,999.
16.2% of households in Roswell earn $50,000 to $74,999.
12.8% of households in Roswell earn $75,000 to $99,999.
9.1% of households in Roswell earn $100,000 to $149,999.
7.6% of households in Roswell earn $150,000 to $199,999.
4.6% of households in Roswell earn $200,000 or more.
| Income | Roswell | NM | USA |
|---|---|---|---|
| Less than $10,000 | 6.4% | 6.6% | 4.9% |
| $10,000 to $14,999 | 9.2% | 5.2% | 3.6% |
| $15,000 to $24,999 | 11.9% | 9.1% | 6.6% |
| $25,000 to $34,999 | 9.6% | 8.5% | 6.8% |
| $35,000 to $49,999 | 12.6% | 11.7% | 10.4% |
| $50,000 to $74,999 | 16.2% | 17.0% | 15.7% |
| $75,000 to $99,999 | 12.8% | 12.4% | 12.7% |
| $100,000 to $149,999 | 9.1% | 15.1% | 17.4% |
| $150,000 to $199,999 | 7.6% | 7.2% | 9.3% |
| $200,000 or more | 4.6% | 7.1% | 12.6% |


