Haiku-Pauwela SnackAbility
Overall SnackAbility
Cost of living in Haiku-Pauwela summary. We use data on the cost of living to determine how expensive it is to live in Haiku-Pauwela. Real estate prices drive most of the variance in cost of living around Hawaii. Key points include:
The cost of living in Haiku-Pauwela is 203 with 100 being average.
The cost of living in Haiku-Pauwela is 2.0x higher than the national average.
The median home value in Haiku-Pauwela is $1,085,804.
The median income in Haiku-Pauwela is $101,396.
Haiku-Pauwela's Overall Cost Of Living
Higher Than The National Average
Cost Of Living In Haiku-Pauwela Comparison Table
| Living Expense | Haiku-Pauwela | Hawaii | National Average |
|---|---|---|---|
| Overall | 203 | 163 | 100 |
| Services | 129 | 124 | 100 |
| Groceries | 117 | 118 | 100 |
| Health | 393 | 253 | 100 |
| Housing | 121 | 123 | 100 |
| Transportation | 130 | 132 | 100 |
| Utilities | 127 | 128 | 100 |
Source: Cost of living index, normalized to US average = 100
Haiku-Pauwela, HI Weather
The average high in Haiku-Pauwela is 75.1° and the average low is 63.4°.
There are 143.2 days of precipitation each year.
Expect an average of 84.9 inches of precipitation each year with 0.0 inches of snow.
| Stat | Haiku-Pauwela |
|---|---|
| Average Annual High | 75.1 |
| Average Annual Low | 63.4 |
| Annual Precipitation Days | 143.2 |
| Average Annual Precipitation | 84.9 |
| Average Annual Snowfall | 0.0 |
Average High
Days of Rain
Source: NOAA climate normals (30-year)
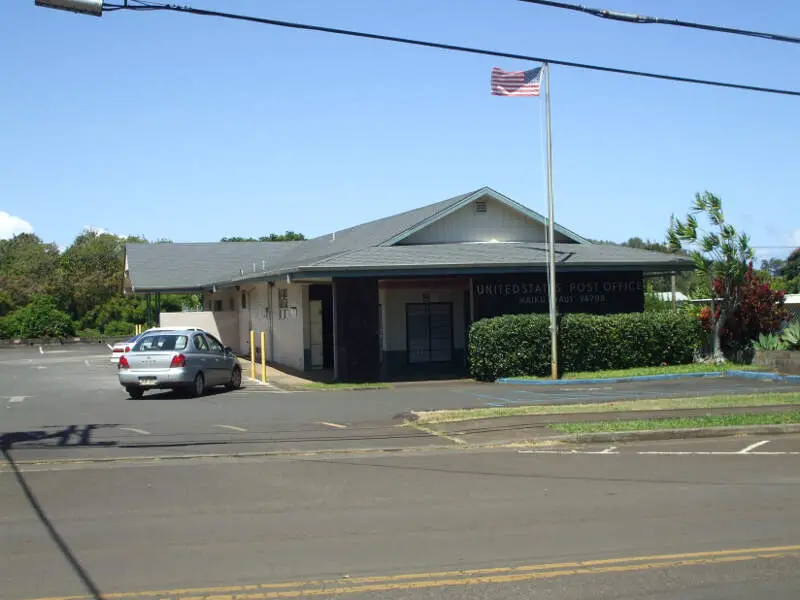
Haiku-Pauwela, HI Photos

Rankings & Articles For Haiku-Pauwela


Locations Around Haiku-Pauwela
Map Of Haiku-Pauwela, HI
Best Places Around Haiku-Pauwela
Waihee-Waiehu, HI
Population 10,988
Kula, HI
Population 6,791
Pukalani, HI
Population 8,679
Wailuku, HI
Population 16,926
Wailea, HI
Population 6,352
Makawao, HI
Population 7,353
Kahului, HI
Population 28,288
Kihei, HI
Population 21,567
Haiku-Pauwela Demographics And Statistics
Population over time in Haiku-Pauwela
The current population in Haiku-Pauwela is 9,178. The population has increased 14.4% from 2010.
| Year | Population | % Change |
|---|---|---|
| 2024 | 9,178 | -1.2% |
| 2023 | 9,290 | 0.5% |
| 2022 | 9,245 | -1.1% |
| 2021 | 9,347 | 2.6% |
| 2020 | 9,107 | 1.3% |
| 2019 | 8,987 | 11.5% |
| 2018 | 8,061 | - |
| 2017 | 0 | -100.0% |
| 2016 | 7,564 | -3.6% |
| 2015 | 7,846 | 2.0% |
| 2014 | 7,689 | -9.0% |
| 2013 | 8,447 | -1.1% |
| 2012 | 8,539 | 5.3% |
| 2011 | 8,113 | 1.1% |
| 2010 | 8,021 | - |
Race / Ethnicity in Haiku-Pauwela
See the full breakdown
Haiku-Pauwela is:
52.5% White with 4,816 White residents.
0.0% African American with 0 African American residents.
0.0% American Indian with 0 American Indian residents.
5.5% Asian with 504 Asian residents.
3.8% Hawaiian with 350 Hawaiian residents.
0.4% Other with 34 Other residents.
22.7% Two Or More with 2,080 Two Or More residents.
15.2% Hispanic with 1,394 Hispanic residents.
| Race | Haiku-Pauwela | HI | USA |
|---|---|---|---|
| White | 52.5% | 20.9% | 57.4% |
| African American | 0.0% | 1.8% | 11.9% |
| American Indian | 0.0% | 0.1% | 0.5% |
| Asian | 5.5% | 36.4% | 5.9% |
| Hawaiian | 3.8% | 9.5% | 0.2% |
| Other | 0.4% | 0.4% | 0.6% |
| Two Or More | 22.7% | 21.0% | 4.3% |
| Hispanic | 15.2% | 9.9% | 19.3% |
Gender in Haiku-Pauwela
See the full breakdown
Haiku-Pauwela is 46.8% female with 4,296 female residents.
Haiku-Pauwela is 53.2% male with 4,882 male residents.
| Gender | Haiku-Pauwela | HI | USA |
|---|---|---|---|
| Female | 46.8% | 49.8% | 50.5% |
| Male | 53.2% | 50.2% | 49.5% |
Highest level of educational attainment in Haiku-Pauwela for adults over 25
See the full breakdown
2.0% of adults in Haiku-Pauwela completed < 9th grade.
7.0% of adults in Haiku-Pauwela completed 9-12th grade.
23.0% of adults in Haiku-Pauwela completed high school / ged.
24.0% of adults in Haiku-Pauwela completed some college.
11.0% of adults in Haiku-Pauwela completed associate's degree.
22.0% of adults in Haiku-Pauwela completed bachelor's degree.
9.0% of adults in Haiku-Pauwela completed master's degree.
1.0% of adults in Haiku-Pauwela completed professional degree.
1.0% of adults in Haiku-Pauwela completed doctorate degree.
| Education | Haiku-Pauwela | HI | USA |
|---|---|---|---|
| < 9th Grade | 2.0% | 1.0% | 4.0% |
| 9-12th Grade | 7.0% | 4.0% | 6.0% |
| High School / GED | 23.0% | 27.0% | 26.0% |
| Some College | 24.0% | 20.0% | 19.0% |
| Associate's Degree | 11.0% | 11.0% | 9.0% |
| Bachelor's Degree | 22.0% | 23.0% | 22.0% |
| Master's Degree | 9.0% | 9.0% | 10.0% |
| Professional Degree | 1.0% | 3.0% | 2.0% |
| Doctorate Degree | 1.0% | 2.0% | 2.0% |
Household Income For Haiku-Pauwela, Hawaii
See the full breakdown
5.4% of households in Haiku-Pauwela earn Less than $10,000.
0.8% of households in Haiku-Pauwela earn $10,000 to $14,999.
3.9% of households in Haiku-Pauwela earn $15,000 to $24,999.
7.4% of households in Haiku-Pauwela earn $25,000 to $34,999.
2.8% of households in Haiku-Pauwela earn $35,000 to $49,999.
11.1% of households in Haiku-Pauwela earn $50,000 to $74,999.
14.6% of households in Haiku-Pauwela earn $75,000 to $99,999.
27.8% of households in Haiku-Pauwela earn $100,000 to $149,999.
12.0% of households in Haiku-Pauwela earn $150,000 to $199,999.
14.1% of households in Haiku-Pauwela earn $200,000 or more.
| Income | Haiku-Pauwela | HI | USA |
|---|---|---|---|
| Less than $10,000 | 5.4% | 4.4% | 5.0% |
| $10,000 to $14,999 | 0.8% | 2.6% | 3.4% |
| $15,000 to $24,999 | 3.9% | 4.5% | 6.3% |
| $25,000 to $34,999 | 7.4% | 4.5% | 6.6% |
| $35,000 to $49,999 | 2.8% | 7.6% | 10.1% |
| $50,000 to $74,999 | 11.1% | 13.8% | 15.5% |
| $75,000 to $99,999 | 14.6% | 12.4% | 12.6% |
| $100,000 to $149,999 | 27.8% | 19.7% | 17.5% |
| $150,000 to $199,999 | 12.0% | 12.1% | 9.6% |
| $200,000 or more | 14.1% | 18.5% | 13.4% |
Source: U.S. Census ACS 5-year estimates (2024)


