Leominster SnackAbility
Overall SnackAbility
Crime in Leominster summary. We use data from the FBI to determine the crime rates in Leominster. Key points include:
There were 799 total crimes in Leominster in the last reporting year.
The overall crime rate per 100,000 people in Leominster is 1,799.3 / 100k people.
The violent crime rate per 100,000 people in Leominster is 484.2 / 100k people.
The property crime rate per 100,000 people in Leominster is 1,315.1 / 100k people.
Overall, crime in Leominster is -15.10% below the national average.
Total Crimes
Below National Average
Crime In Leominster Comparison Table
| Statistic | Count Raw |
Leominster / 100k People |
Massachusetts / 100k People |
National / 100k People |
|---|---|---|---|---|
| Total Crimes Per 100K | 799 | 1,799.3 | 1,426.8 | 2,119.2 |
| Violent Crime | 215 | 484.2 | 314.7 | 359.0 |
| Murder | 2 | 4.5 | 1.8 | 5.0 |
| Robbery | 15 | 33.8 | 36.0 | 61.0 |
| Aggravated Assault | 180 | 405.3 | 249.3 | 256.0 |
| Property Crime | 584 | 1,315.1 | 1,112.1 | 1,760.0 |
| Burglary | 51 | 114.8 | 130.3 | 229.0 |
| Larceny | 480 | 1,080.9 | 876.3 | 1,272.0 |
| Car Theft | 53 | 119.4 | 105.5 | 259.0 |
Source: FBI Uniform Crime Reporting (2024)
Cost of living in Leominster summary. We use data on the cost of living to determine how expensive it is to live in Leominster. Real estate prices drive most of the variance in cost of living around Massachusetts. Key points include:
The cost of living in Leominster is 117 with 100 being average.
The cost of living in Leominster is 1.2x higher than the national average.
The median home value in Leominster is $463,493.
The median income in Leominster is $83,816.
Leominster's Overall Cost Of Living
Higher Than The National Average
Cost Of Living In Leominster Comparison Table
| Living Expense | Leominster | Massachusetts | National Average |
|---|---|---|---|
| Overall | 117 | 130 | 100 |
| Services | 108 | 110 | 100 |
| Groceries | 113 | 115 | 100 |
| Health | 128 | 168 | 100 |
| Housing | 115 | 117 | 100 |
| Transportation | 112 | 115 | 100 |
| Utilities | 113 | 114 | 100 |
Source: Cost of living index, normalized to US average = 100
Leominster, MA Weather
The average high in Leominster is 59.1° and the average low is 37.6°.
There are 90.1 days of precipitation each year.
Expect an average of 46.4 inches of precipitation each year with 76.6 inches of snow.
| Stat | Leominster |
|---|---|
| Average Annual High | 59.1 |
| Average Annual Low | 37.6 |
| Annual Precipitation Days | 90.1 |
| Average Annual Precipitation | 46.4 |
| Average Annual Snowfall | 76.6 |
Average High
Days of Rain
Source: NOAA climate normals (30-year)
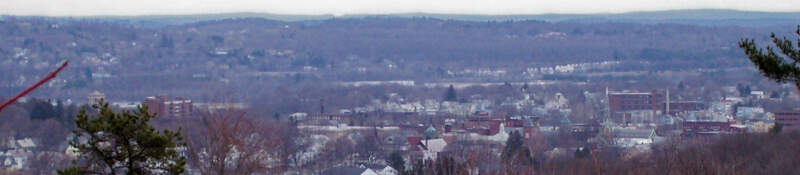
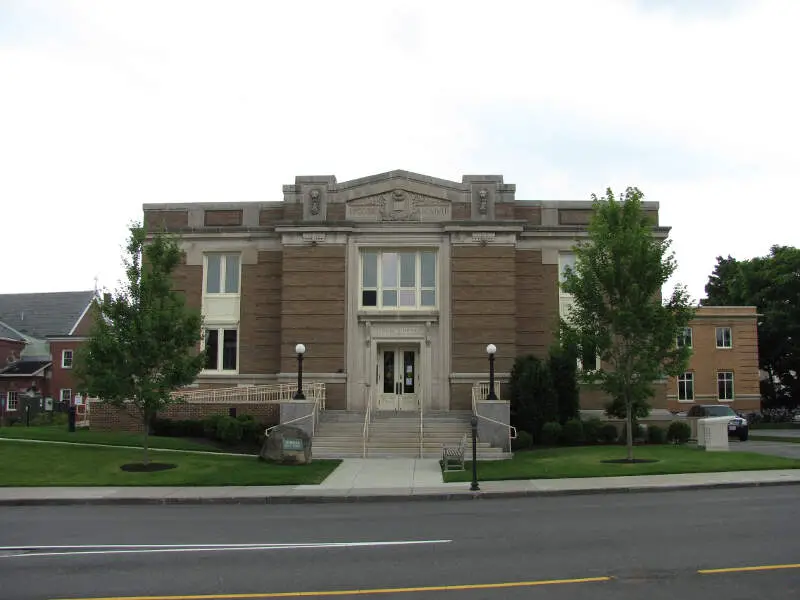
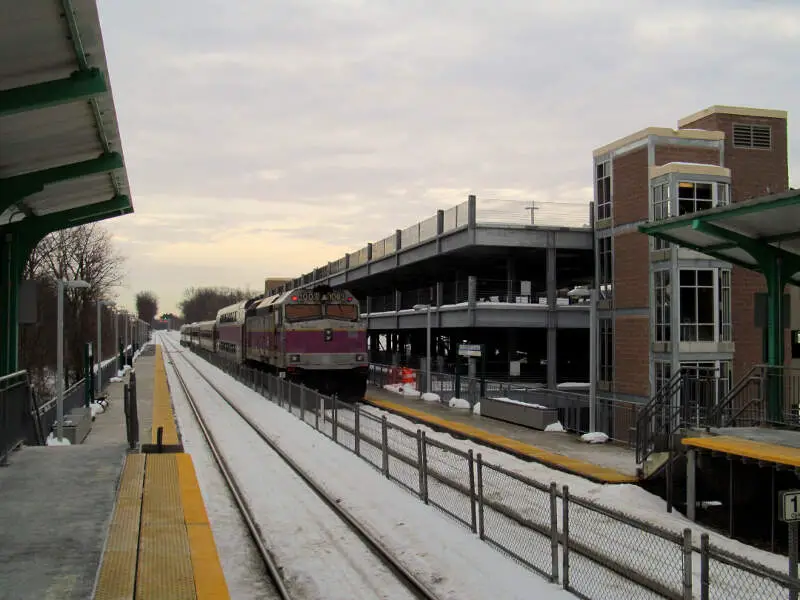
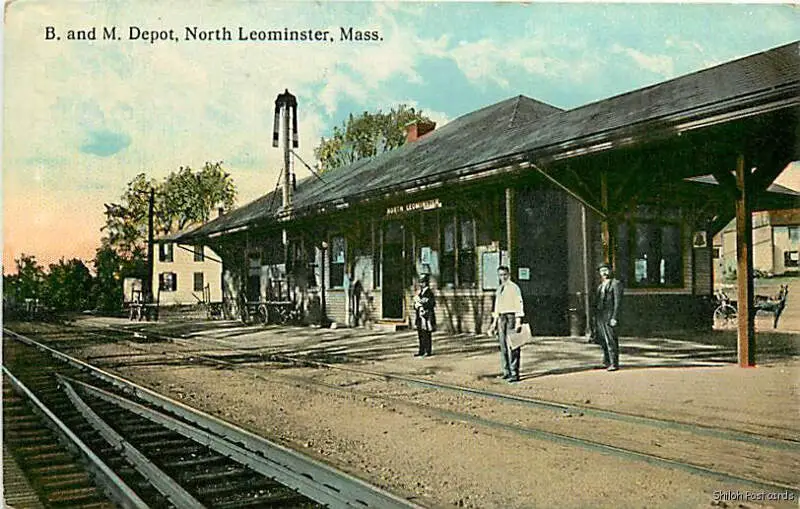
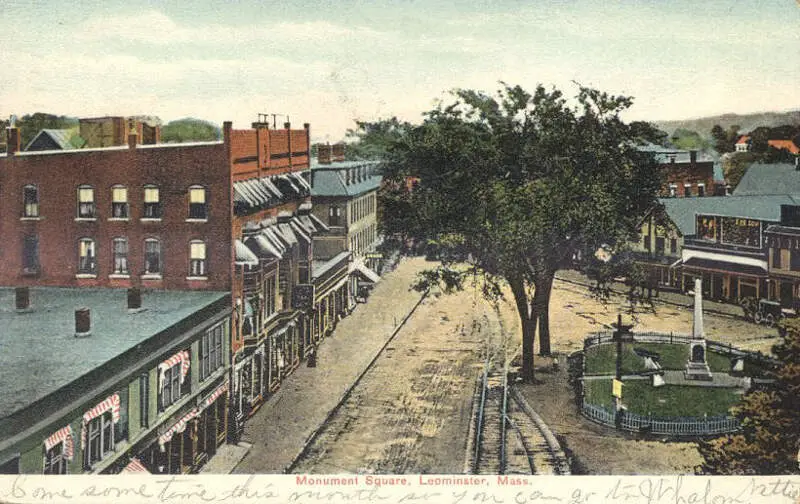
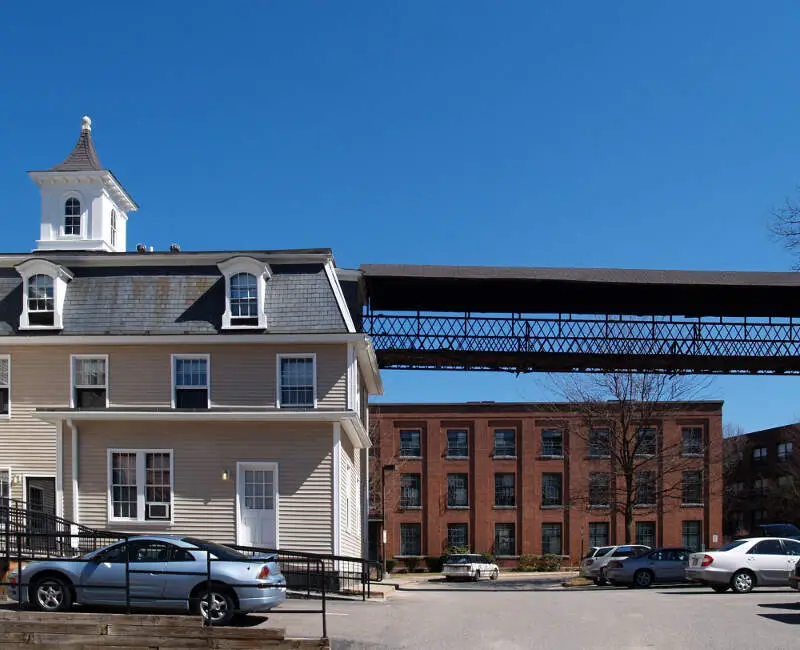
Leominster, MA Photos


Rankings & Articles For Leominster


Locations Around Leominster
Map Of Leominster, MA
Best Places Around Leominster
West Concord, MA
Population 5,876
Northborough, MA
Population 6,392
Maynard, MA
Population 10,712
Hudson, MA
Population 15,719
Marlborough, MA
Population 41,647
Clinton, MA
Population 7,658
Worcester, MA
Population 207,055
Fitchburg, MA
Population 41,798
Gardner, MA
Population 21,148
Leominster Demographics And Statistics
Population over time in Leominster
The current population in Leominster is 43,909. The population has increased 7.2% from 2010.
| Year | Population | % Change |
|---|---|---|
| 2024 | 43,909 | 0.5% |
| 2023 | 43,697 | 0.2% |
| 2022 | 43,620 | 0.3% |
| 2021 | 43,478 | 4.6% |
| 2020 | 41,581 | -0.1% |
| 2019 | 41,606 | 0.1% |
| 2018 | 41,579 | 0.3% |
| 2017 | 41,446 | 0.3% |
| 2016 | 41,304 | 0.3% |
| 2015 | 41,176 | 0.5% |
| 2014 | 40,954 | 0.2% |
| 2013 | 40,867 | -0.0% |
| 2012 | 40,879 | -0.0% |
| 2011 | 40,884 | -0.1% |
| 2010 | 40,941 | - |
Race / Ethnicity in Leominster
See the full breakdown
Leominster is:
68.0% White with 29,867 White residents.
4.9% African American with 2,135 African American residents.
0.0% American Indian with 11 American Indian residents.
3.1% Asian with 1,378 Asian residents.
0.0% Hawaiian with 0 Hawaiian residents.
1.6% Other with 699 Other residents.
6.4% Two Or More with 2,792 Two Or More residents.
16.0% Hispanic with 7,027 Hispanic residents.
| Race | Leominster | MA | USA |
|---|---|---|---|
| White | 68.0% | 66.6% | 57.4% |
| African American | 4.9% | 6.4% | 11.9% |
| American Indian | 0.0% | 0.1% | 0.5% |
| Asian | 3.1% | 7.3% | 5.9% |
| Hawaiian | 0.0% | 0.0% | 0.2% |
| Other | 1.6% | 1.2% | 0.6% |
| Two Or More | 6.4% | 5.1% | 4.3% |
| Hispanic | 16.0% | 13.3% | 19.3% |
Gender in Leominster
See the full breakdown
Leominster is 49.7% female with 21,828 female residents.
Leominster is 50.3% male with 22,081 male residents.
| Gender | Leominster | MA | USA |
|---|---|---|---|
| Female | 49.7% | 51.1% | 50.5% |
| Male | 50.3% | 48.9% | 49.5% |
Highest level of educational attainment in Leominster for adults over 25
See the full breakdown
5.0% of adults in Leominster completed < 9th grade.
5.0% of adults in Leominster completed 9-12th grade.
30.0% of adults in Leominster completed high school / ged.
16.0% of adults in Leominster completed some college.
11.0% of adults in Leominster completed associate's degree.
21.0% of adults in Leominster completed bachelor's degree.
10.0% of adults in Leominster completed master's degree.
1.0% of adults in Leominster completed professional degree.
1.0% of adults in Leominster completed doctorate degree.
| Education | Leominster | MA | USA |
|---|---|---|---|
| < 9th Grade | 5.0% | 6.0% | 4.0% |
| 9-12th Grade | 5.0% | 4.0% | 6.0% |
| High School / GED | 30.0% | 23.0% | 26.0% |
| Some College | 16.0% | 14.0% | 19.0% |
| Associate's Degree | 11.0% | 7.0% | 9.0% |
| Bachelor's Degree | 21.0% | 25.0% | 22.0% |
| Master's Degree | 10.0% | 15.0% | 10.0% |
| Professional Degree | 1.0% | 3.0% | 2.0% |
| Doctorate Degree | 1.0% | 3.0% | 2.0% |
Household Income For Leominster, Massachusetts
See the full breakdown
3.3% of households in Leominster earn Less than $10,000.
2.4% of households in Leominster earn $10,000 to $14,999.
7.0% of households in Leominster earn $15,000 to $24,999.
6.5% of households in Leominster earn $25,000 to $34,999.
10.3% of households in Leominster earn $35,000 to $49,999.
16.4% of households in Leominster earn $50,000 to $74,999.
11.6% of households in Leominster earn $75,000 to $99,999.
17.9% of households in Leominster earn $100,000 to $149,999.
10.8% of households in Leominster earn $150,000 to $199,999.
13.9% of households in Leominster earn $200,000 or more.
| Income | Leominster | MA | USA |
|---|---|---|---|
| Less than $10,000 | 3.3% | 4.4% | 5.0% |
| $10,000 to $14,999 | 2.4% | 3.3% | 3.4% |
| $15,000 to $24,999 | 7.0% | 5.5% | 6.3% |
| $25,000 to $34,999 | 6.5% | 5.0% | 6.6% |
| $35,000 to $49,999 | 10.3% | 7.5% | 10.1% |
| $50,000 to $74,999 | 16.4% | 12.0% | 15.5% |
| $75,000 to $99,999 | 11.6% | 10.7% | 12.6% |
| $100,000 to $149,999 | 17.9% | 17.5% | 17.5% |
| $150,000 to $199,999 | 10.8% | 11.9% | 9.6% |
| $200,000 or more | 13.9% | 22.3% | 13.4% |
Source: U.S. Census ACS 5-year estimates (2024)


