North Adams SnackAbility
Overall SnackAbility
Crime in North Adams summary. We use data from the FBI to determine the crime rates in North Adams. Key points include:
There were 465 total crimes in North Adams in the last reporting year.
The overall crime rate per 100,000 people in North Adams is 3,751.5 / 100k people.
The violent crime rate per 100,000 people in North Adams is 1,194.0 / 100k people.
The property crime rate per 100,000 people in North Adams is 2,557.5 / 100k people.
Overall, crime in North Adams is 77.02% above the national average.
Total Crimes
Above National Average
Crime In North Adams Comparison Table
| Statistic | Count Raw |
North Adams / 100k People |
Massachusetts / 100k People |
National / 100k People |
|---|---|---|---|---|
| Total Crimes Per 100K | 465 | 3,751.5 | 1,426.8 | 2,119.2 |
| Violent Crime | 148 | 1,194.0 | 314.7 | 359.0 |
| Murder | 0 | 0.0 | 1.8 | 5.0 |
| Robbery | 9 | 72.6 | 36.0 | 61.0 |
| Aggravated Assault | 132 | 1,064.9 | 249.3 | 256.0 |
| Property Crime | 317 | 2,557.5 | 1,112.1 | 1,760.0 |
| Burglary | 41 | 330.8 | 130.3 | 229.0 |
| Larceny | 271 | 2,186.4 | 876.3 | 1,272.0 |
| Car Theft | 5 | 40.3 | 105.5 | 259.0 |
Source: FBI Uniform Crime Reporting (2024)
Cost of living in North Adams summary. We use data on the cost of living to determine how expensive it is to live in North Adams. Real estate prices drive most of the variance in cost of living around Massachusetts. Key points include:
The cost of living in North Adams is 104 with 100 being average.
The cost of living in North Adams is 1.0x higher than the national average.
The median home value in North Adams is $252,588.
The median income in North Adams is $47,500.
North Adams's Overall Cost Of Living
Higher Than The National Average
Cost Of Living In North Adams Comparison Table
| Living Expense | North Adams | Massachusetts | National Average |
|---|---|---|---|
| Overall | 104 | 130 | 100 |
| Services | 107 | 110 | 100 |
| Groceries | 113 | 115 | 100 |
| Health | 84 | 168 | 100 |
| Housing | 113 | 117 | 100 |
| Transportation | 113 | 115 | 100 |
| Utilities | 111 | 114 | 100 |
Source: Cost of living index, normalized to US average = 100
North Adams, MA Weather
The average high in North Adams is 56.3° and the average low is 35.3°.
There are 89.8 days of precipitation each year.
Expect an average of 45.4 inches of precipitation each year with 71.0 inches of snow.
| Stat | North Adams |
|---|---|
| Average Annual High | 56.3 |
| Average Annual Low | 35.3 |
| Annual Precipitation Days | 89.8 |
| Average Annual Precipitation | 45.4 |
| Average Annual Snowfall | 71.0 |
Average High
Days of Rain
Source: NOAA climate normals (30-year)
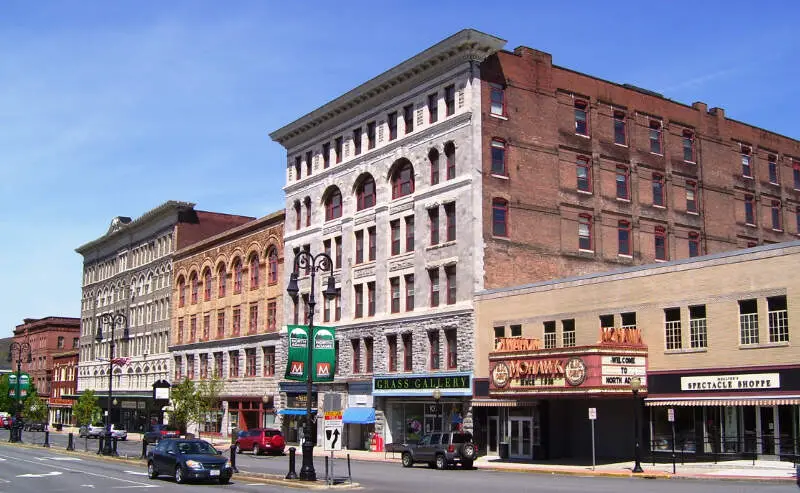
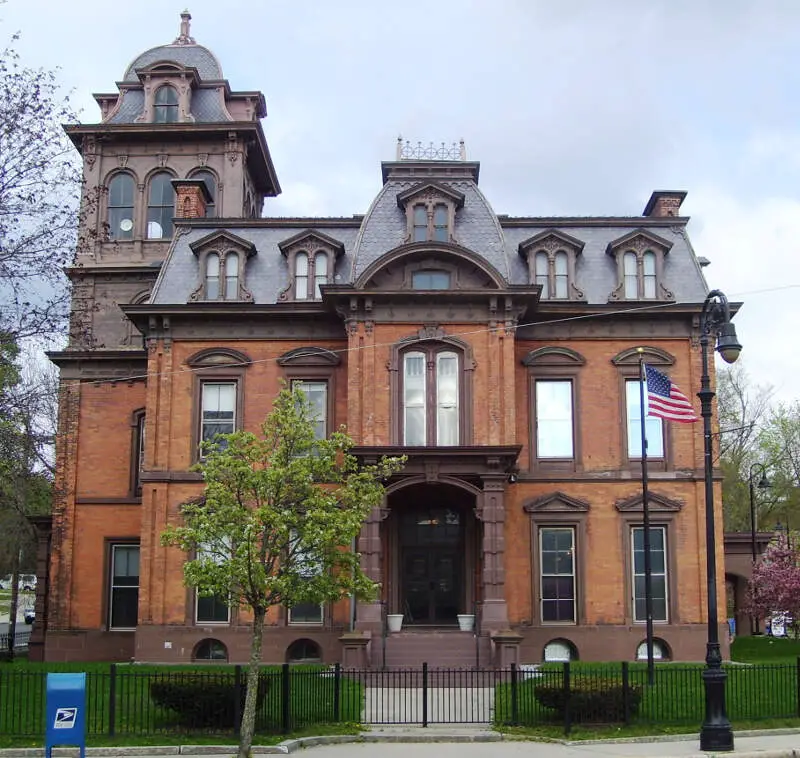
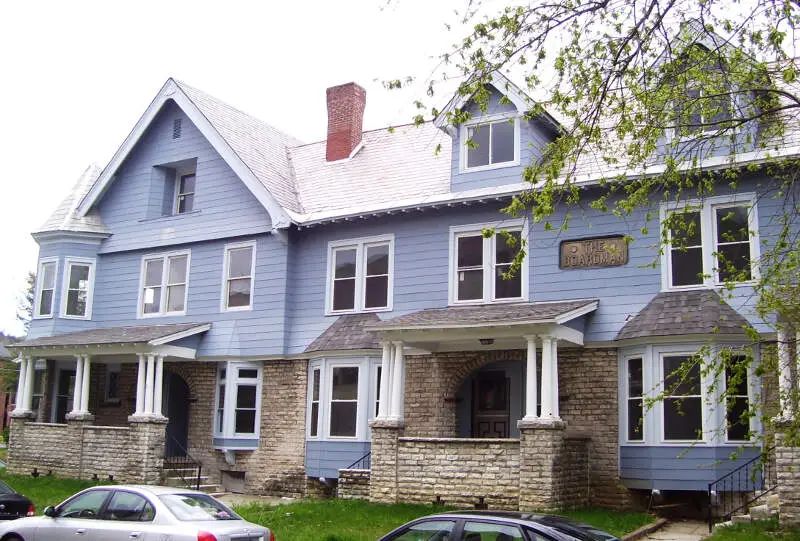
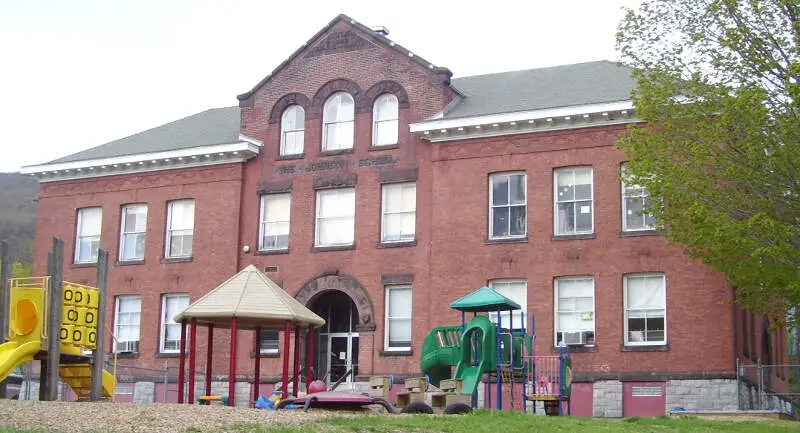
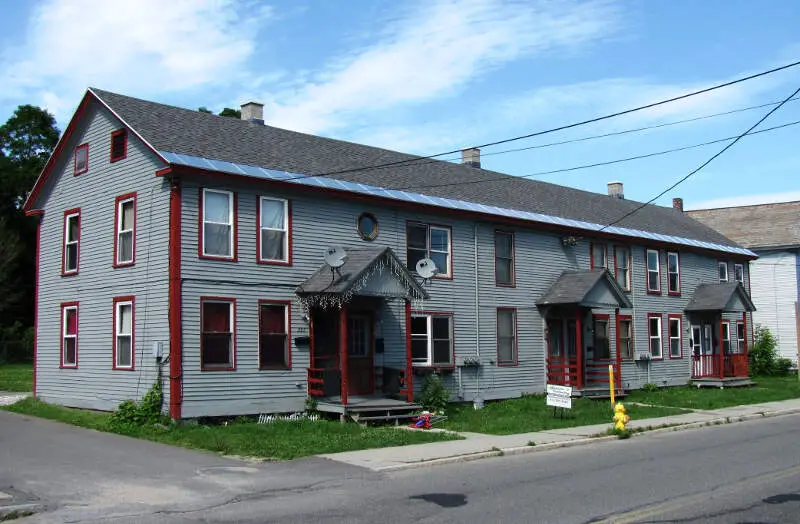
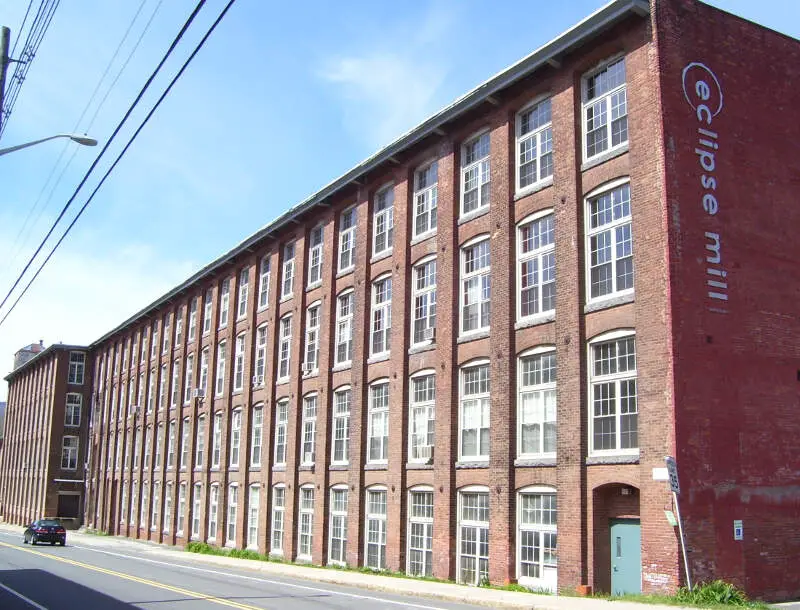
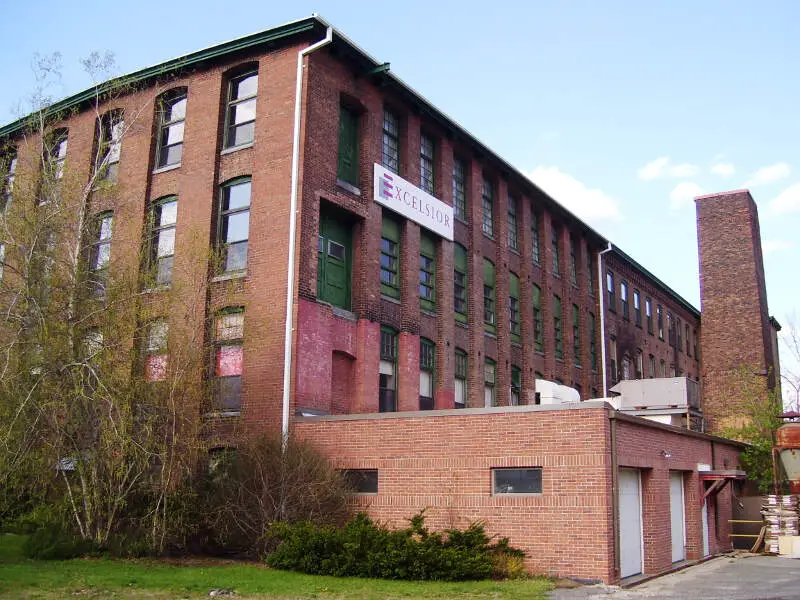
North Adams, MA Photos
1 Reviews & Comments About North Adams

The economy of North Adams is based on drug trafficking, abetted by proudly corrupt city administrators and a few bad apples among the State Police commanders of Berkshire County. At least half the people walking the streets are junkies, and most of the North Adams police officers above patrol rank are in the business of protecting organized crime.
Soon after a multiagency bust in November 2015 disrupted the Latin Kings leadership around Springfield, MA, hordes of Latin Kings from Springfield began pouring into North Adams to establish a lucrative new base for their narcotics trade. Around the same time, the police director issued a taxi license to two business partners who had been previously convicted of operating a taxi service to distribute narcotics in the Philadelphia area. This taxi service - whose employees range from shady to scary - keeps busy 24/7 ferrying customers, dealers, and bag men to and from drug houses all over the city, with no fear of police intervention.
Meanwhile, the NAPD and Berkshire Narcotics Task Force make headlines for their drug busts - chiefly targeting the UNPROTECTED players in the local drug scene who dare compete with the Latin Kings. This serves the purpose of making local law enforcement look proactive against narcotics even while protecting a major faction of criminals.
The Latin Kings have a history of corrupting public officials in several states, and even of infiltrating police departments. Presto, in late 2017 the North Adams police director was bold enough to appoint a full-time police officer whose shoddy personal history would disqualify him even from civilian duties with any police department upholding minimal standards. This person's pattern of bad driving, failing to pay bills, defaulting on court appearances, falsifying job applications, obtaining Taser training under false pretenses, and being dismissed from previous part-time police positions, makes a mockery of every respectable police officer on the force.
Woe to any citizens who complain about this state of affairs. If you don't like the network of Latin Kings drug operators colonizing entire apartment buildings near your home, or the noise and menace emanating from one of their crack dens, forget about seeking assistance from the police. They will ignore all demands for investigation or intervention. If the thugs start to burglarize and vandalize your home in retaliation, the police will ignore it, all the while denying the existence of any crimes, failing to take reports even of felonies, and filing false reports to support their crooked agenda. If you complain too persistently, the police may target you, trying to silence you with name-calling and threats, gaslighting you as crazy, and even encouraging the criminals to lay siege to your home.
Don't expect help from the mayor, either. Although the City Charter mandates oversight of the police department as one of his duties, Thomas Bernard has no intention of changing the status quo of corruption and abuse. His concerns don't include crime victims, or the more abstract notion of justice as a crucial underpinning of civilized society. As a petty bureaucrat, his instinct is not to lead, but to dodge responsibility while groveling to appease his masters higher up in the Berkshire County political food chain. Which brings us to the former mayor Richard Alcombright, the former district attorney David Capeless. and the recently retired police director Michael Cozzaglio. It was on their watch that the Latin Kings swarmed into North Adams,and it was those crooked officials who stood by for years, refusing to intervene as an 86-year-old woman and her middle-aged daughter suffered hundreds of crimes ranging from prowling to felony burglaries, home invasions, and relentless vandalism of their home.
Per the City Charter, the City Council's role is to represent the people of North Adams in matters concerning the municipality. In reality, most of the councilors ignore their constituents and care little about many serious problems in the city. During my 6+ years here, I have observed that they take their cues from the mayor to ignore major criminal problems and marginalize people whom Alcombright and Cozzaglio wanted to silence.
All the city councilors have enough intelligence to do their job, but they are self-serving and complacent, displaying no curiosity about matters outside their own areas of concern. As long as they feel safe and comfortable, they see no problem with fellow North Adams residents being victimized to the point of ruin. They refuse to hold the mayor accountable for the quality of the police department or to stand up for vulnerable people who are being victimized. The mayor, in his turn, lacks the integrity and brainpower to do his job. Despite an elite academic pedigree and an advanced degree in public administration, he appears unfamiliar with a concept most 12-year-olds encounter in middle school civics class: that ensuring that a justice system that fails to serve everyone fairly ends up serving nobody at all. Here in North Adams, the vacuum of civic leadership has resulted in the police department subverted to serve organized crime, at the expense of all the rest of us.
What stands out in North Adams- Drugs, drugs, and more drugs! The mayor who refuses to do his job of overseeing the police department, and the city councilors who turn their backs on crime victims, can't wait to bring legalized marijuana into town. Farms! Retail stores! Accessories! Edibles! POT POT POT! Medical! Recreational! Warehouses full of it!
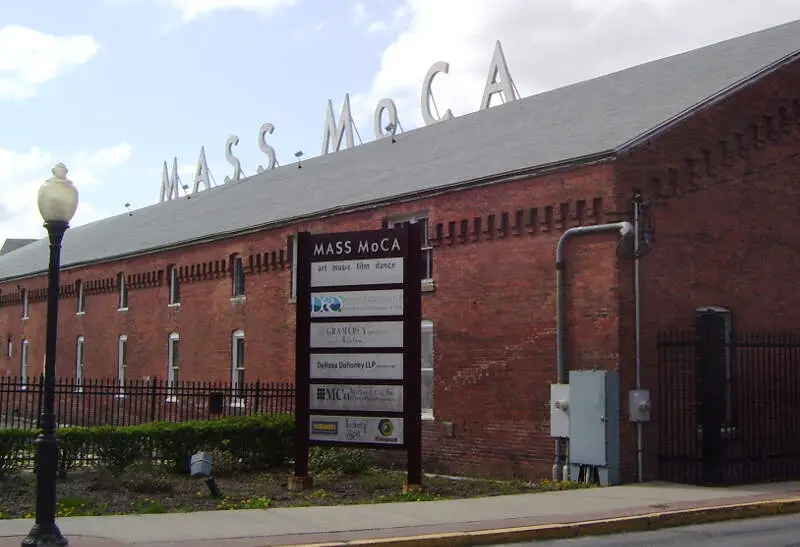
Note also: The Porches, an upscale hotel catering to the needs of MassMOCA, is located square in the middle of a major corridor of police-sanctioned Latin Kings activity, with unsavory characters strollingbiking past the hotel day and night. It seems likely that the officials who welcome Springfield gangsters to the neighborhood have worked out some agreement that the criminals are to refrain from menacing The Porches' guests. However, the Porches itself apparently doesn't bother to conduct even rudimentary background checks of its employees. Several young women on the housekeeping staff and at the front desk are local junkies/dealers who work closely with the Latin Kings. They are criminals, with criminal boyfriends who may specialize in home invasions, cat burglaries, identity theft, etc. These are the people who handle your credit card and driver's license when you check in. Then you must trust them to clean your room, with your luggage and expensive possessions sitting there unguarded when you go out to lunch.
Rankings & Articles For North Adams


Locations Around North Adams
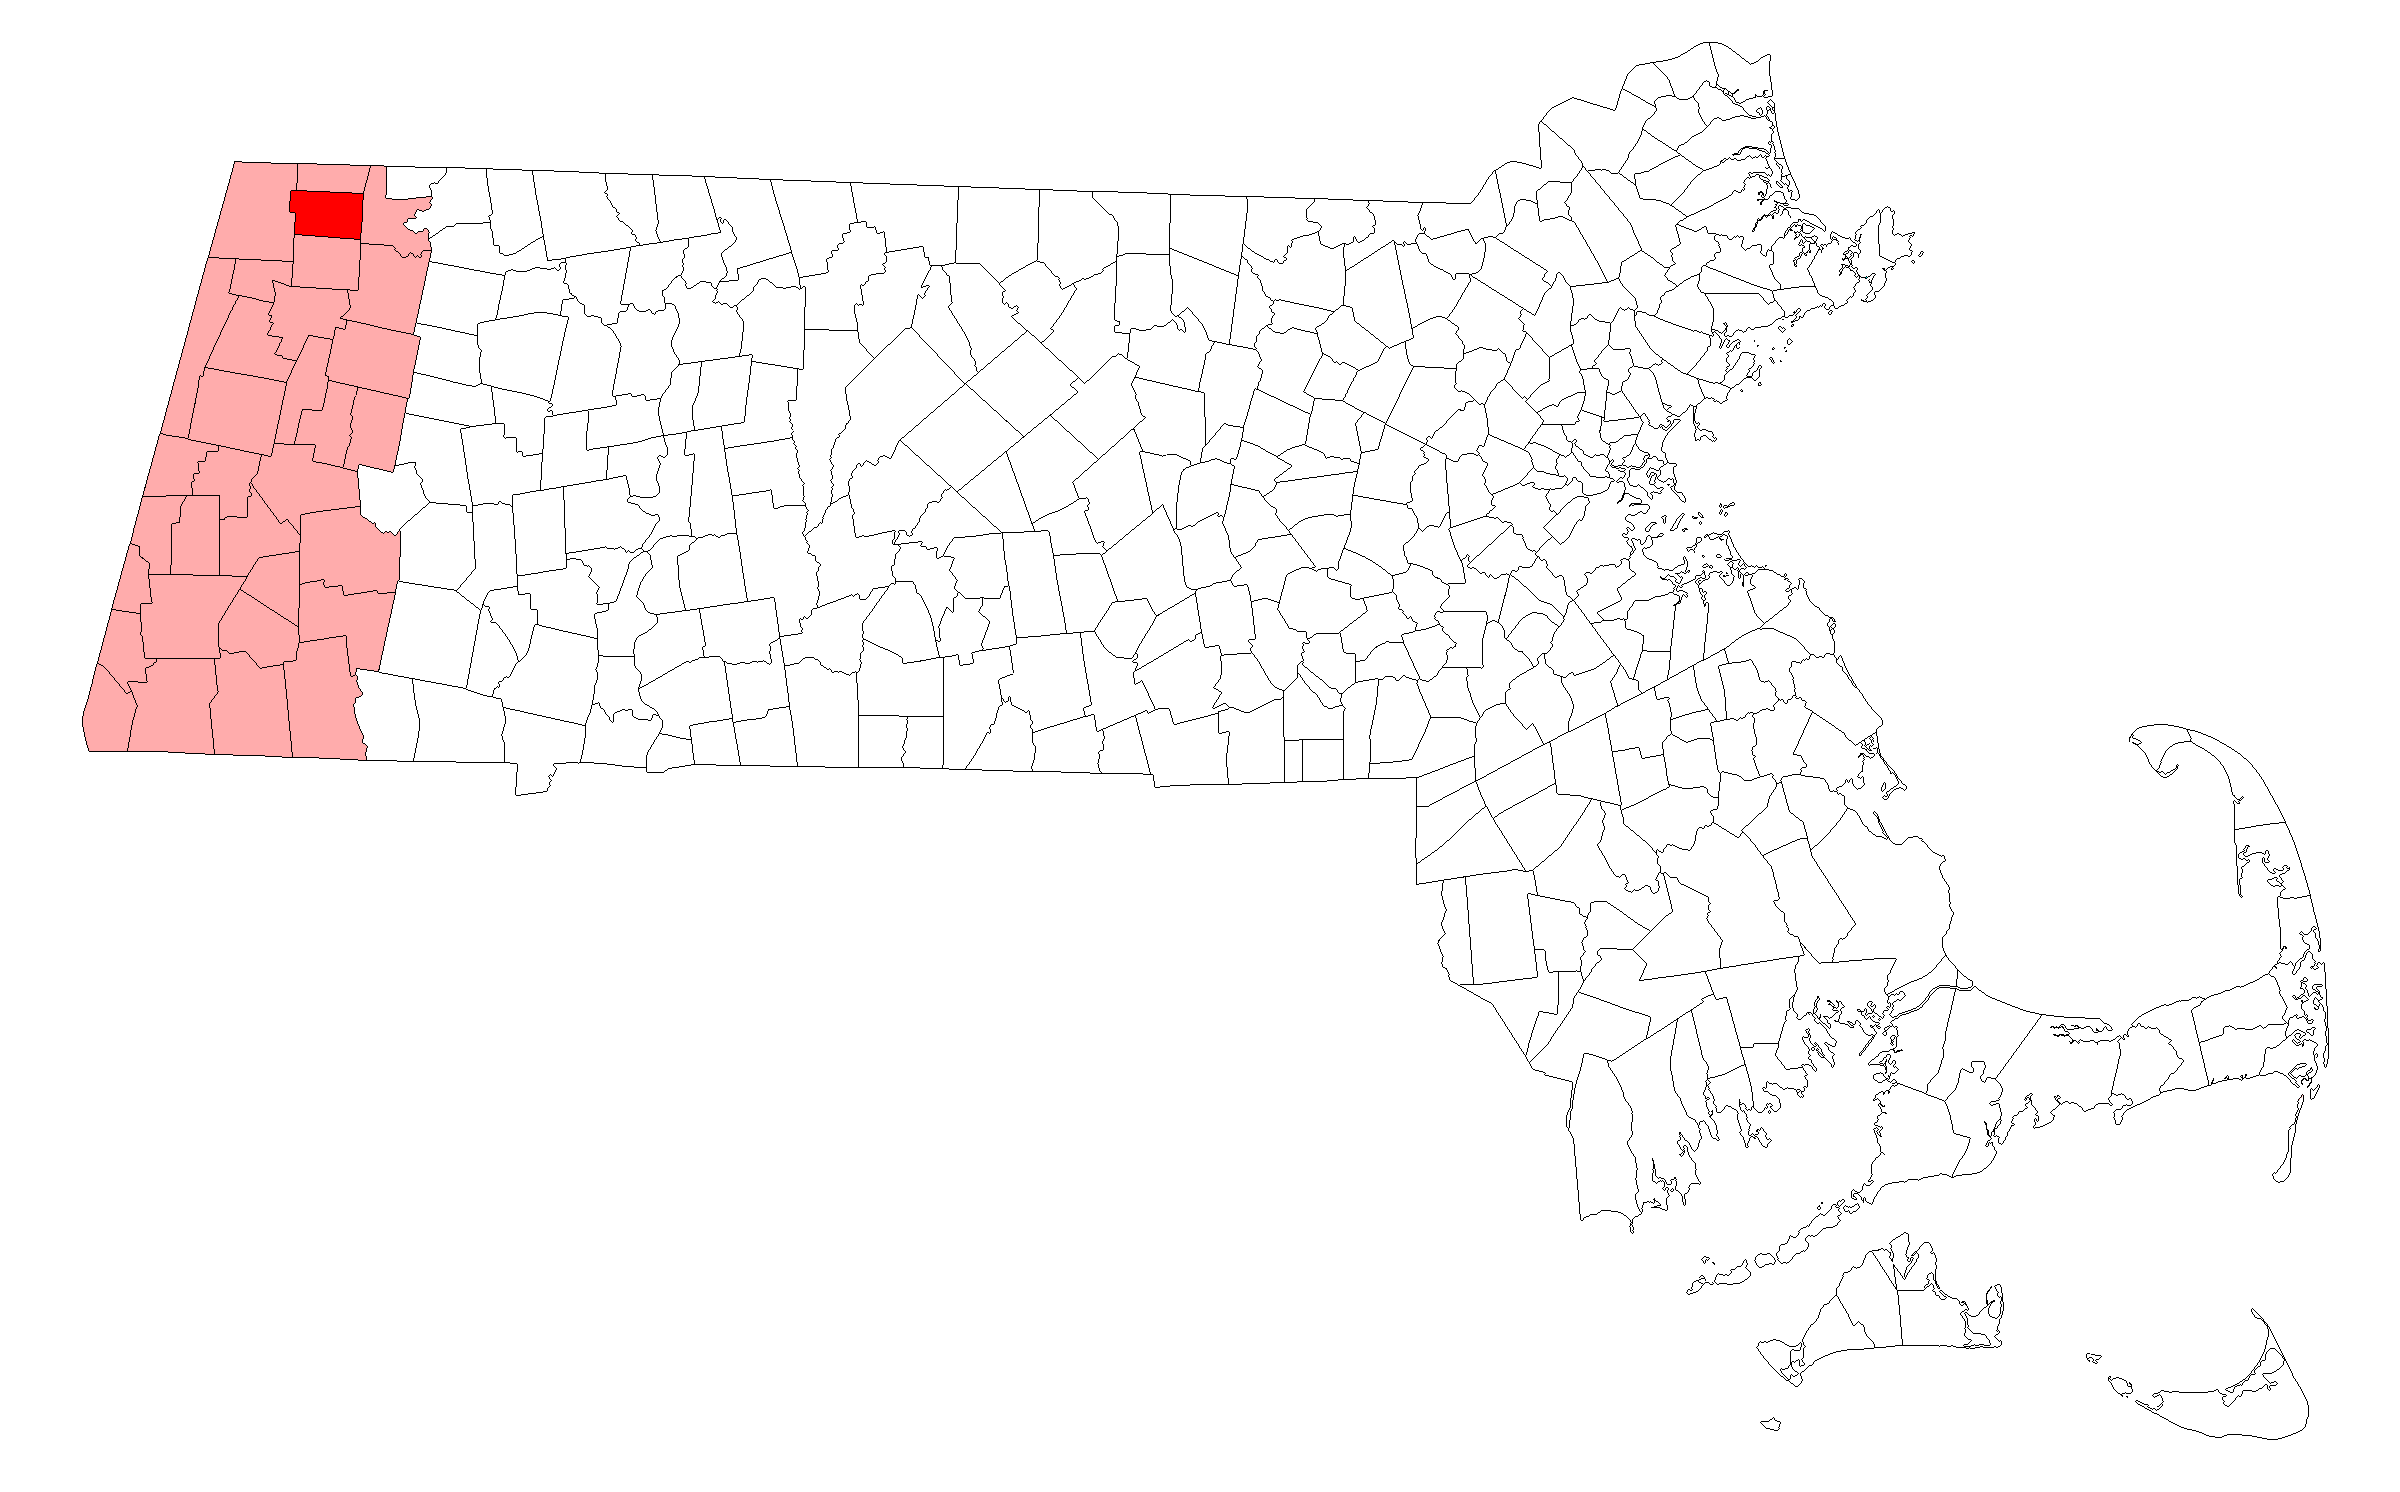
Map Of North Adams, MA
Best Places Around North Adams
Colonie, NY
Population 7,702
Niskayuna, NY
Population 21,227
Westmere, NY
Population 8,334
Cohoes, NY
Population 18,159
Greenville, OH
Population 12,741
Saratoga Springs, NY
Population 28,631
Rensselaer, NY
Population 9,287
Mechanicville, NY
Population 5,124
Scotia, NY
Population 7,264
North Adams Demographics And Statistics
Population over time in North Adams
The current population in North Adams is 12,606. The population has decreased 9.0% from 2010.
| Year | Population | % Change |
|---|---|---|
| 2024 | 12,606 | -0.4% |
| 2023 | 12,660 | -2.1% |
| 2022 | 12,937 | -0.7% |
| 2021 | 13,024 | 1.0% |
| 2020 | 12,897 | -0.5% |
| 2019 | 12,959 | -1.0% |
| 2018 | 13,089 | -0.9% |
| 2017 | 13,211 | -0.9% |
| 2016 | 13,326 | -1.0% |
| 2015 | 13,459 | -0.8% |
| 2014 | 13,563 | -0.7% |
| 2013 | 13,657 | -0.5% |
| 2012 | 13,725 | -0.3% |
| 2011 | 13,763 | -0.6% |
| 2010 | 13,851 | - |
Race / Ethnicity in North Adams
See the full breakdown
North Adams is:
86.0% White with 10,844 White residents.
1.5% African American with 190 African American residents.
0.6% American Indian with 75 American Indian residents.
4.0% Asian with 500 Asian residents.
0.0% Hawaiian with 0 Hawaiian residents.
0.5% Other with 58 Other residents.
1.6% Two Or More with 199 Two Or More residents.
5.9% Hispanic with 740 Hispanic residents.
| Race | North Adams | MA | USA |
|---|---|---|---|
| White | 86.0% | 66.6% | 57.4% |
| African American | 1.5% | 6.4% | 11.9% |
| American Indian | 0.6% | 0.1% | 0.5% |
| Asian | 4.0% | 7.3% | 5.9% |
| Hawaiian | 0.0% | 0.0% | 0.2% |
| Other | 0.5% | 1.2% | 0.6% |
| Two Or More | 1.6% | 5.1% | 4.3% |
| Hispanic | 5.9% | 13.3% | 19.3% |
Gender in North Adams
See the full breakdown
North Adams is 47.3% female with 5,960 female residents.
North Adams is 52.7% male with 6,645 male residents.
| Gender | North Adams | MA | USA |
|---|---|---|---|
| Female | 47.3% | 51.1% | 50.5% |
| Male | 52.7% | 48.9% | 49.5% |
Highest level of educational attainment in North Adams for adults over 25
See the full breakdown
1.0% of adults in North Adams completed < 9th grade.
7.0% of adults in North Adams completed 9-12th grade.
40.0% of adults in North Adams completed high school / ged.
17.0% of adults in North Adams completed some college.
6.0% of adults in North Adams completed associate's degree.
17.0% of adults in North Adams completed bachelor's degree.
9.0% of adults in North Adams completed master's degree.
1.0% of adults in North Adams completed professional degree.
2.0% of adults in North Adams completed doctorate degree.
| Education | North Adams | MA | USA |
|---|---|---|---|
| < 9th Grade | 1.0% | 6.0% | 4.0% |
| 9-12th Grade | 7.0% | 4.0% | 6.0% |
| High School / GED | 40.0% | 23.0% | 26.0% |
| Some College | 17.0% | 14.0% | 19.0% |
| Associate's Degree | 6.0% | 7.0% | 9.0% |
| Bachelor's Degree | 17.0% | 25.0% | 22.0% |
| Master's Degree | 9.0% | 15.0% | 10.0% |
| Professional Degree | 1.0% | 3.0% | 2.0% |
| Doctorate Degree | 2.0% | 3.0% | 2.0% |
Household Income For North Adams, Massachusetts
See the full breakdown
6.1% of households in North Adams earn Less than $10,000.
11.1% of households in North Adams earn $10,000 to $14,999.
9.5% of households in North Adams earn $15,000 to $24,999.
10.4% of households in North Adams earn $25,000 to $34,999.
14.7% of households in North Adams earn $35,000 to $49,999.
15.8% of households in North Adams earn $50,000 to $74,999.
11.8% of households in North Adams earn $75,000 to $99,999.
10.1% of households in North Adams earn $100,000 to $149,999.
4.0% of households in North Adams earn $150,000 to $199,999.
6.4% of households in North Adams earn $200,000 or more.
| Income | North Adams | MA | USA |
|---|---|---|---|
| Less than $10,000 | 6.1% | 4.4% | 5.0% |
| $10,000 to $14,999 | 11.1% | 3.3% | 3.4% |
| $15,000 to $24,999 | 9.5% | 5.5% | 6.3% |
| $25,000 to $34,999 | 10.4% | 5.0% | 6.6% |
| $35,000 to $49,999 | 14.7% | 7.5% | 10.1% |
| $50,000 to $74,999 | 15.8% | 12.0% | 15.5% |
| $75,000 to $99,999 | 11.8% | 10.7% | 12.6% |
| $100,000 to $149,999 | 10.1% | 17.5% | 17.5% |
| $150,000 to $199,999 | 4.0% | 11.9% | 9.6% |
| $200,000 or more | 6.4% | 22.3% | 13.4% |
Source: U.S. Census ACS 5-year estimates (2024)


