Salem SnackAbility
Overall SnackAbility
Crime in Salem summary. We use data from the FBI to determine the crime rates in Salem. Key points include:
There were 784 total crimes in Salem in the last reporting year.
The overall crime rate per 100,000 people in Salem is 1,706.0 / 100k people.
The violent crime rate per 100,000 people in Salem is 152.3 / 100k people.
The property crime rate per 100,000 people in Salem is 1,553.7 / 100k people.
Overall, crime in Salem is -19.50% below the national average.
Total Crimes
Below National Average
Crime In Salem Comparison Table
| Statistic | Count Raw |
Salem / 100k People |
Massachusetts / 100k People |
National / 100k People |
|---|---|---|---|---|
| Total Crimes Per 100K | 784 | 1,706.0 | 1,426.8 | 2,119.2 |
| Violent Crime | 70 | 152.3 | 314.7 | 359.0 |
| Murder | 0 | 0.0 | 1.8 | 5.0 |
| Robbery | 16 | 34.8 | 36.0 | 61.0 |
| Aggravated Assault | 48 | 104.5 | 249.3 | 256.0 |
| Property Crime | 714 | 1,553.7 | 1,112.1 | 1,760.0 |
| Burglary | 49 | 106.6 | 130.3 | 229.0 |
| Larceny | 619 | 1,347.0 | 876.3 | 1,272.0 |
| Car Theft | 46 | 100.1 | 105.5 | 259.0 |
Source: FBI Uniform Crime Reporting (2024)
Cost of living in Salem summary. We use data on the cost of living to determine how expensive it is to live in Salem. Real estate prices drive most of the variance in cost of living around Massachusetts. Key points include:
The cost of living in Salem is 135 with 100 being average.
The cost of living in Salem is 1.4x higher than the national average.
The median home value in Salem is $606,558.
The median income in Salem is $85,153.
Salem's Overall Cost Of Living
Higher Than The National Average
Cost Of Living In Salem Comparison Table
| Living Expense | Salem | Massachusetts | National Average |
|---|---|---|---|
| Overall | 135 | 130 | 100 |
| Services | 108 | 110 | 100 |
| Groceries | 114 | 115 | 100 |
| Health | 186 | 168 | 100 |
| Housing | 115 | 117 | 100 |
| Transportation | 113 | 115 | 100 |
| Utilities | 115 | 114 | 100 |
Source: Cost of living index, normalized to US average = 100
Salem, MA Weather
The average high in Salem is 58.0° and the average low is 41.3°.
There are 83.7 days of precipitation each year.
Expect an average of 46.5 inches of precipitation each year with 41.2 inches of snow.
| Stat | Salem |
|---|---|
| Average Annual High | 58.0 |
| Average Annual Low | 41.3 |
| Annual Precipitation Days | 83.7 |
| Average Annual Precipitation | 46.5 |
| Average Annual Snowfall | 41.2 |
Average High
Days of Rain
Source: NOAA climate normals (30-year)
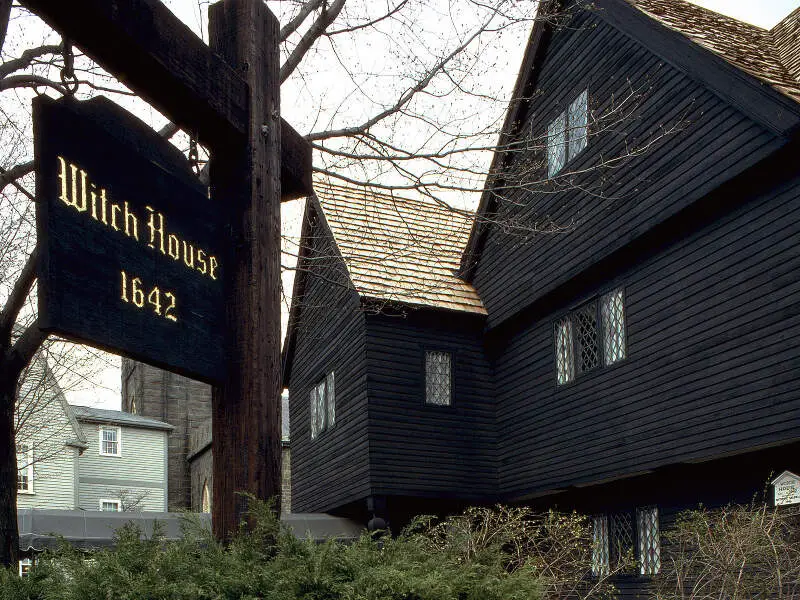
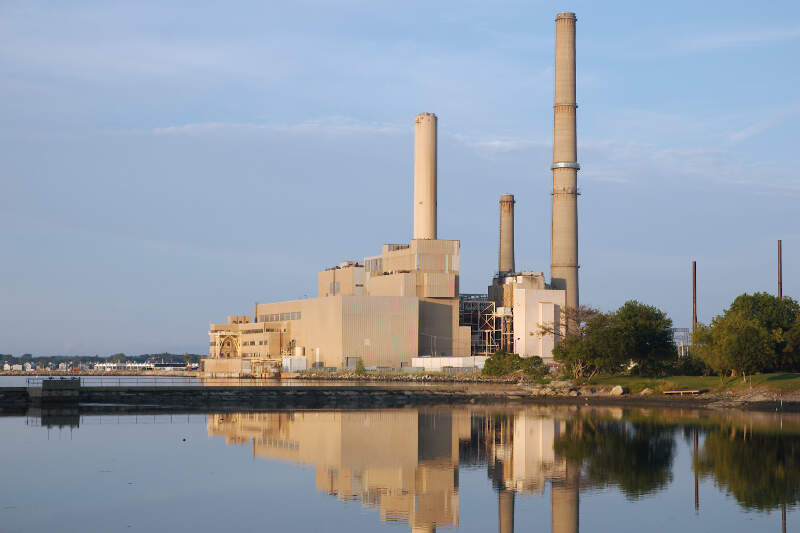
Salem, MA Photos


Rankings & Articles For Salem


Locations Around Salem
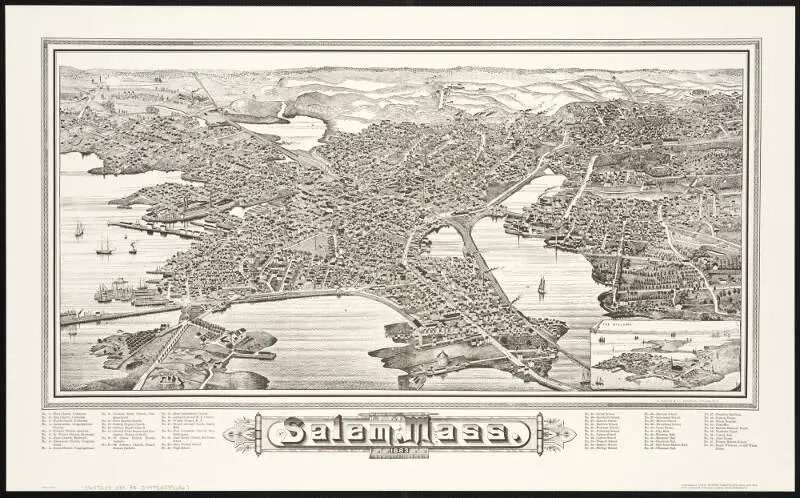
Map Of Salem, MA
Best Places Around Salem
Lexington, MA
Population 34,295
Marblehead, MA
Population 20,413
Newton, MA
Population 89,044
Winchester, MA
Population 23,406
Reading, MA
Population 25,612
Brookline, MA
Population 63,266
Pinehurst, MA
Population 6,845
Arlington, MA
Population 46,350
Belmont, MA
Population 27,175
Melrose, MA
Population 29,650
Salem Demographics And Statistics
Population over time in Salem
The current population in Salem is 44,795. The population has increased 9.4% from 2010.
| Year | Population | % Change |
|---|---|---|
| 2024 | 44,795 | 1.3% |
| 2023 | 44,241 | -0.7% |
| 2022 | 44,541 | 0.2% |
| 2021 | 44,452 | 2.5% |
| 2020 | 43,350 | 0.2% |
| 2019 | 43,252 | -0.1% |
| 2018 | 43,302 | 0.4% |
| 2017 | 43,146 | 0.8% |
| 2016 | 42,804 | 0.7% |
| 2015 | 42,499 | 0.4% |
| 2014 | 42,321 | 0.9% |
| 2013 | 41,926 | 0.7% |
| 2012 | 41,641 | 1.2% |
| 2011 | 41,163 | 0.5% |
| 2010 | 40,964 | - |
Race / Ethnicity in Salem
See the full breakdown
Salem is:
66.4% White with 29,764 White residents.
4.6% African American with 2,050 African American residents.
0.1% American Indian with 23 American Indian residents.
3.4% Asian with 1,502 Asian residents.
0.1% Hawaiian with 36 Hawaiian residents.
1.0% Other with 460 Other residents.
3.7% Two Or More with 1,668 Two Or More residents.
20.7% Hispanic with 9,292 Hispanic residents.
| Race | Salem | MA | USA |
|---|---|---|---|
| White | 66.4% | 66.6% | 57.4% |
| African American | 4.6% | 6.4% | 11.9% |
| American Indian | 0.1% | 0.1% | 0.5% |
| Asian | 3.4% | 7.3% | 5.9% |
| Hawaiian | 0.1% | 0.0% | 0.2% |
| Other | 1.0% | 1.2% | 0.6% |
| Two Or More | 3.7% | 5.1% | 4.3% |
| Hispanic | 20.7% | 13.3% | 19.3% |
Gender in Salem
See the full breakdown
Salem is 54.5% female with 24,427 female residents.
Salem is 45.5% male with 20,368 male residents.
| Gender | Salem | MA | USA |
|---|---|---|---|
| Female | 54.5% | 51.1% | 50.5% |
| Male | 45.5% | 48.9% | 49.5% |
Highest level of educational attainment in Salem for adults over 25
See the full breakdown
5.0% of adults in Salem completed < 9th grade.
4.0% of adults in Salem completed 9-12th grade.
22.0% of adults in Salem completed high school / ged.
15.0% of adults in Salem completed some college.
7.0% of adults in Salem completed associate's degree.
27.0% of adults in Salem completed bachelor's degree.
16.0% of adults in Salem completed master's degree.
2.0% of adults in Salem completed professional degree.
2.0% of adults in Salem completed doctorate degree.
| Education | Salem | MA | USA |
|---|---|---|---|
| < 9th Grade | 5.0% | 6.0% | 4.0% |
| 9-12th Grade | 4.0% | 4.0% | 6.0% |
| High School / GED | 22.0% | 23.0% | 26.0% |
| Some College | 15.0% | 14.0% | 19.0% |
| Associate's Degree | 7.0% | 7.0% | 9.0% |
| Bachelor's Degree | 27.0% | 25.0% | 22.0% |
| Master's Degree | 16.0% | 15.0% | 10.0% |
| Professional Degree | 2.0% | 3.0% | 2.0% |
| Doctorate Degree | 2.0% | 3.0% | 2.0% |
Household Income For Salem, Massachusetts
See the full breakdown
4.3% of households in Salem earn Less than $10,000.
4.5% of households in Salem earn $10,000 to $14,999.
8.0% of households in Salem earn $15,000 to $24,999.
5.9% of households in Salem earn $25,000 to $34,999.
8.0% of households in Salem earn $35,000 to $49,999.
13.9% of households in Salem earn $50,000 to $74,999.
11.6% of households in Salem earn $75,000 to $99,999.
18.3% of households in Salem earn $100,000 to $149,999.
12.3% of households in Salem earn $150,000 to $199,999.
13.1% of households in Salem earn $200,000 or more.
| Income | Salem | MA | USA |
|---|---|---|---|
| Less than $10,000 | 4.3% | 4.4% | 5.0% |
| $10,000 to $14,999 | 4.5% | 3.3% | 3.4% |
| $15,000 to $24,999 | 8.0% | 5.5% | 6.3% |
| $25,000 to $34,999 | 5.9% | 5.0% | 6.6% |
| $35,000 to $49,999 | 8.0% | 7.5% | 10.1% |
| $50,000 to $74,999 | 13.9% | 12.0% | 15.5% |
| $75,000 to $99,999 | 11.6% | 10.7% | 12.6% |
| $100,000 to $149,999 | 18.3% | 17.5% | 17.5% |
| $150,000 to $199,999 | 12.3% | 11.9% | 9.6% |
| $200,000 or more | 13.1% | 22.3% | 13.4% |
Source: U.S. Census ACS 5-year estimates (2024)


