Springfield SnackAbility
Overall SnackAbility
Crime in Springfield summary. We use data from the FBI to determine the crime rates in Springfield. Key points include:
There were 5,795 total crimes in Springfield in the last reporting year.
The overall crime rate per 100,000 people in Springfield is 3,726.9 / 100k people.
The violent crime rate per 100,000 people in Springfield is 891.4 / 100k people.
The property crime rate per 100,000 people in Springfield is 2,835.5 / 100k people.
Overall, crime in Springfield is 75.86% above the national average.
Total Crimes
Above National Average
Crime In Springfield Comparison Table
| Statistic | Count Raw |
Springfield / 100k People |
Massachusetts / 100k People |
National / 100k People |
|---|---|---|---|---|
| Total Crimes Per 100K | 5,795 | 3,726.9 | 1,426.8 | 2,119.2 |
| Violent Crime | 1,386 | 891.4 | 314.7 | 359.0 |
| Murder | 17 | 10.9 | 1.8 | 5.0 |
| Robbery | 325 | 209.0 | 36.0 | 61.0 |
| Aggravated Assault | 971 | 624.5 | 249.3 | 256.0 |
| Property Crime | 4,409 | 2,835.5 | 1,112.1 | 1,760.0 |
| Burglary | 488 | 313.8 | 130.3 | 229.0 |
| Larceny | 2,887 | 1,856.7 | 876.3 | 1,272.0 |
| Car Theft | 1,034 | 665.0 | 105.5 | 259.0 |
Source: FBI Uniform Crime Reporting (2024)
Cost of living in Springfield summary. We use data on the cost of living to determine how expensive it is to live in Springfield. Real estate prices drive most of the variance in cost of living around Massachusetts. Key points include:
The cost of living in Springfield is 111 with 100 being average.
The cost of living in Springfield is 1.1x higher than the national average.
The median home value in Springfield is $294,613.
The median income in Springfield is $52,656.
Springfield's Overall Cost Of Living
Higher Than The National Average
Cost Of Living In Springfield Comparison Table
| Living Expense | Springfield | Massachusetts | National Average |
|---|---|---|---|
| Overall | 111 | 130 | 100 |
| Services | 114 | 110 | 100 |
| Groceries | 121 | 115 | 100 |
| Health | 94 | 168 | 100 |
| Housing | 113 | 117 | 100 |
| Transportation | 117 | 115 | 100 |
| Utilities | 121 | 114 | 100 |
Source: Cost of living index, normalized to US average = 100
Springfield, MA Weather
The average high in Springfield is 60.1° and the average low is 39.3°.
There are 70.8 days of precipitation each year.
Expect an average of 45.7 inches of precipitation each year with 41.6 inches of snow.
| Stat | Springfield |
|---|---|
| Average Annual High | 60.1 |
| Average Annual Low | 39.3 |
| Annual Precipitation Days | 70.8 |
| Average Annual Precipitation | 45.7 |
| Average Annual Snowfall | 41.6 |
Average High
Days of Rain
Source: NOAA climate normals (30-year)
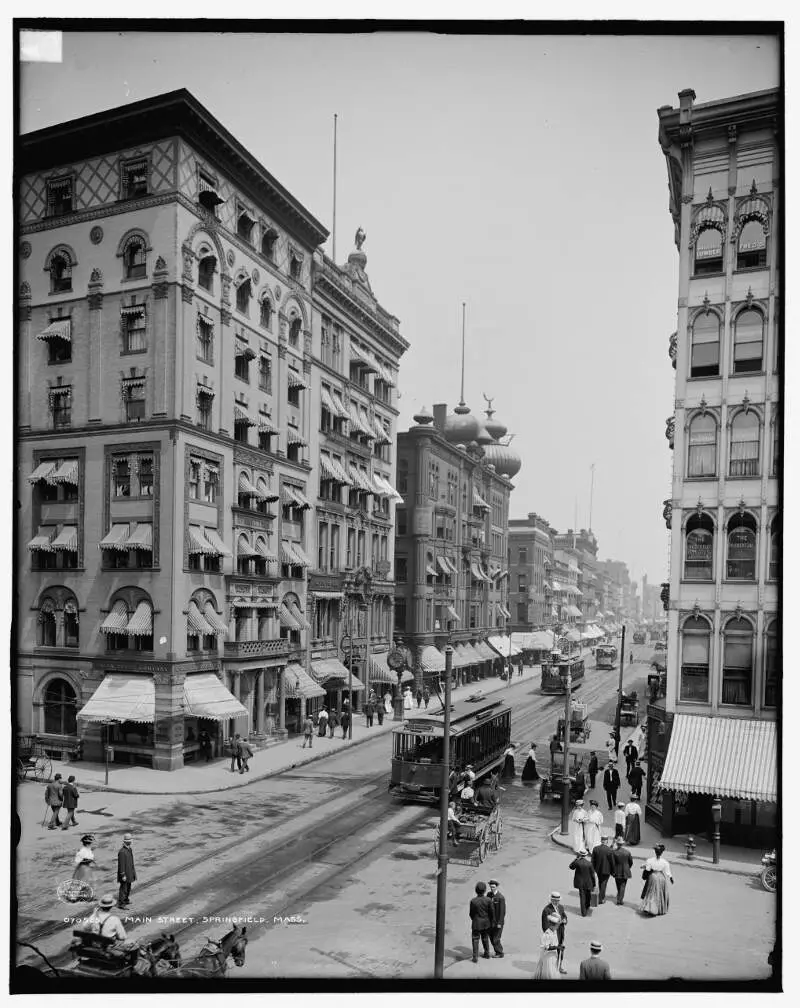
Springfield, MA Photos


1 Reviews & Comments About Springfield

It was a fun experience, with some great local colleges as well. The city had a lot of life and was fun for me on the whole.
The city will welcome most people and represents a great slice of life for the North East area of the United States.
Rankings & Articles For Springfield


Locations Around Springfield
Map Of Springfield, MA
Best Places Around Springfield
Sherwood Manor, CT
Population 5,706
Southwood Acres, CT
Population 8,115
Windsor Locks, CT
Population 12,579
Hazardville, CT
Population 6,022
Longmeadow, MA
Population 15,696
West Springfield, VA
Population 22,532
Springfield Demographics And Statistics
Population over time in Springfield
The current population in Springfield is 154,749. The population has increased 1.2% from 2010.
| Year | Population | % Change |
|---|---|---|
| 2024 | 154,749 | -0.0% |
| 2023 | 154,751 | -0.4% |
| 2022 | 155,305 | -0.3% |
| 2021 | 155,770 | 1.4% |
| 2020 | 153,677 | -0.3% |
| 2019 | 154,139 | -0.3% |
| 2018 | 154,596 | -0.0% |
| 2017 | 154,613 | 0.4% |
| 2016 | 153,991 | 0.0% |
| 2015 | 153,947 | 0.1% |
| 2014 | 153,836 | 0.3% |
| 2013 | 153,428 | 0.1% |
| 2012 | 153,278 | 0.2% |
| 2011 | 152,992 | 0.1% |
| 2010 | 152,906 | - |
Race / Ethnicity in Springfield
See the full breakdown
Springfield is:
27.8% White with 43,089 White residents.
17.5% African American with 27,100 African American residents.
0.1% American Indian with 107 American Indian residents.
2.7% Asian with 4,103 Asian residents.
0.0% Hawaiian with 1 Hawaiian residents.
0.3% Other with 409 Other residents.
3.1% Two Or More with 4,750 Two Or More residents.
48.6% Hispanic with 75,190 Hispanic residents.
| Race | Springfield | MA | USA |
|---|---|---|---|
| White | 27.8% | 66.6% | 57.4% |
| African American | 17.5% | 6.4% | 11.9% |
| American Indian | 0.1% | 0.1% | 0.5% |
| Asian | 2.7% | 7.3% | 5.9% |
| Hawaiian | 0.0% | 0.0% | 0.2% |
| Other | 0.3% | 1.2% | 0.6% |
| Two Or More | 3.1% | 5.1% | 4.3% |
| Hispanic | 48.6% | 13.3% | 19.3% |
Gender in Springfield
See the full breakdown
Springfield is 51.8% female with 80,093 female residents.
Springfield is 48.2% male with 74,656 male residents.
| Gender | Springfield | MA | USA |
|---|---|---|---|
| Female | 51.8% | 51.1% | 50.5% |
| Male | 48.2% | 48.9% | 49.5% |
Highest level of educational attainment in Springfield for adults over 25
See the full breakdown
10.0% of adults in Springfield completed < 9th grade.
11.0% of adults in Springfield completed 9-12th grade.
33.0% of adults in Springfield completed high school / ged.
18.0% of adults in Springfield completed some college.
8.0% of adults in Springfield completed associate's degree.
12.0% of adults in Springfield completed bachelor's degree.
6.0% of adults in Springfield completed master's degree.
1.0% of adults in Springfield completed professional degree.
1.0% of adults in Springfield completed doctorate degree.
| Education | Springfield | MA | USA |
|---|---|---|---|
| < 9th Grade | 10.0% | 6.0% | 4.0% |
| 9-12th Grade | 11.0% | 4.0% | 6.0% |
| High School / GED | 33.0% | 23.0% | 26.0% |
| Some College | 18.0% | 14.0% | 19.0% |
| Associate's Degree | 8.0% | 7.0% | 9.0% |
| Bachelor's Degree | 12.0% | 25.0% | 22.0% |
| Master's Degree | 6.0% | 15.0% | 10.0% |
| Professional Degree | 1.0% | 3.0% | 2.0% |
| Doctorate Degree | 1.0% | 3.0% | 2.0% |
Household Income For Springfield, Massachusetts
See the full breakdown
8.1% of households in Springfield earn Less than $10,000.
9.7% of households in Springfield earn $10,000 to $14,999.
9.6% of households in Springfield earn $15,000 to $24,999.
8.2% of households in Springfield earn $25,000 to $34,999.
12.7% of households in Springfield earn $35,000 to $49,999.
16.0% of households in Springfield earn $50,000 to $74,999.
10.7% of households in Springfield earn $75,000 to $99,999.
14.2% of households in Springfield earn $100,000 to $149,999.
5.5% of households in Springfield earn $150,000 to $199,999.
5.3% of households in Springfield earn $200,000 or more.
| Income | Springfield | MA | USA |
|---|---|---|---|
| Less than $10,000 | 8.1% | 4.4% | 5.0% |
| $10,000 to $14,999 | 9.7% | 3.3% | 3.4% |
| $15,000 to $24,999 | 9.6% | 5.5% | 6.3% |
| $25,000 to $34,999 | 8.2% | 5.0% | 6.6% |
| $35,000 to $49,999 | 12.7% | 7.5% | 10.1% |
| $50,000 to $74,999 | 16.0% | 12.0% | 15.5% |
| $75,000 to $99,999 | 10.7% | 10.7% | 12.6% |
| $100,000 to $149,999 | 14.2% | 17.5% | 17.5% |
| $150,000 to $199,999 | 5.5% | 11.9% | 9.6% |
| $200,000 or more | 5.3% | 22.3% | 13.4% |
Source: U.S. Census ACS 5-year estimates (2024)


