Worcester SnackAbility
Overall SnackAbility
Crime in Worcester summary. We use data from the FBI to determine the crime rates in Worcester. Key points include:
There were 35 total crimes in Worcester in the last reporting year.
The overall crime rate per 100,000 people in Worcester is 16.5 / 100k people.
The violent crime rate per 100,000 people in Worcester is 16.5 / 100k people.
The property crime rate per 100,000 people in Worcester is 0.0 / 100k people.
Overall, crime in Worcester is -99.22% below the national average.
Total Crimes
Below National Average
Crime In Worcester Comparison Table
| Statistic | Count Raw |
Worcester / 100k People |
Massachusetts / 100k People |
National / 100k People |
|---|---|---|---|---|
| Total Crimes Per 100K | 35 | 16.5 | 1,426.8 | 2,119.2 |
| Violent Crime | 35 | 16.5 | 314.7 | 359.0 |
| Murder | 16 | 7.5 | 1.8 | 5.0 |
| Robbery | 2 | 0.9 | 36.0 | 61.0 |
| Aggravated Assault | 17 | 8.0 | 249.3 | 256.0 |
| Property Crime | 0 | 0.0 | 1,112.1 | 1,760.0 |
| Burglary | 0 | 0.0 | 130.3 | 229.0 |
| Larceny | 0 | 0.0 | 876.3 | 1,272.0 |
| Car Theft | 0 | 0.0 | 105.5 | 259.0 |
Source: FBI Uniform Crime Reporting (2024)
Cost of living in Worcester summary. We use data on the cost of living to determine how expensive it is to live in Worcester. Real estate prices drive most of the variance in cost of living around Massachusetts. Key points include:
The cost of living in Worcester is 119 with 100 being average.
The cost of living in Worcester is 1.2x higher than the national average.
The median home value in Worcester is $430,111.
The median income in Worcester is $70,102.
Worcester's Overall Cost Of Living
Higher Than The National Average
Cost Of Living In Worcester Comparison Table
| Living Expense | Worcester | Massachusetts | National Average |
|---|---|---|---|
| Overall | 119 | 130 | 100 |
| Services | 112 | 110 | 100 |
| Groceries | 120 | 115 | 100 |
| Health | 127 | 168 | 100 |
| Housing | 120 | 117 | 100 |
| Transportation | 118 | 115 | 100 |
| Utilities | 111 | 114 | 100 |
Source: Cost of living index, normalized to US average = 100
Worcester, MA Weather
The average high in Worcester is 58.4° and the average low is 38.0°.
There are 82.9 days of precipitation each year.
Expect an average of 47.7 inches of precipitation each year with 55.1 inches of snow.
| Stat | Worcester |
|---|---|
| Average Annual High | 58.4 |
| Average Annual Low | 38.0 |
| Annual Precipitation Days | 82.9 |
| Average Annual Precipitation | 47.7 |
| Average Annual Snowfall | 55.1 |
Average High
Days of Rain
Source: NOAA climate normals (30-year)
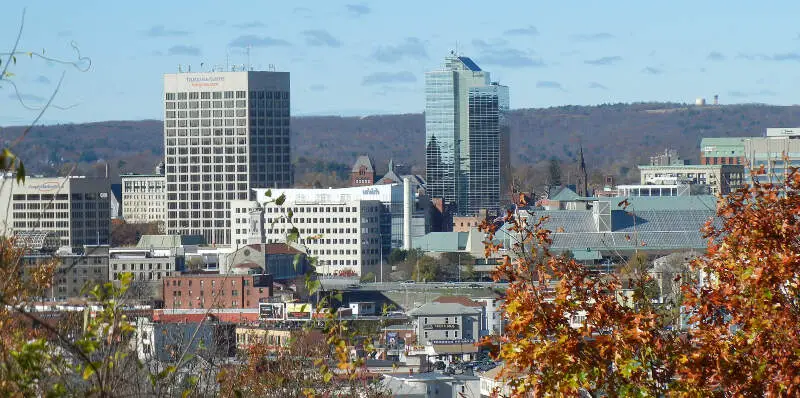
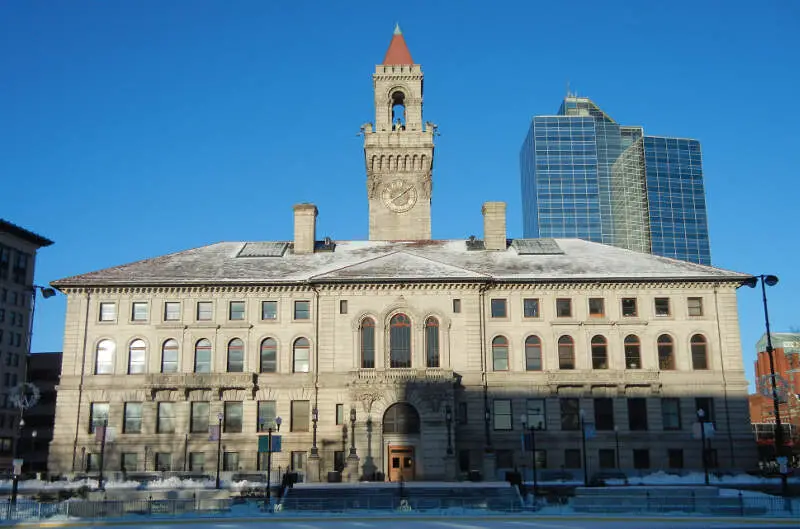
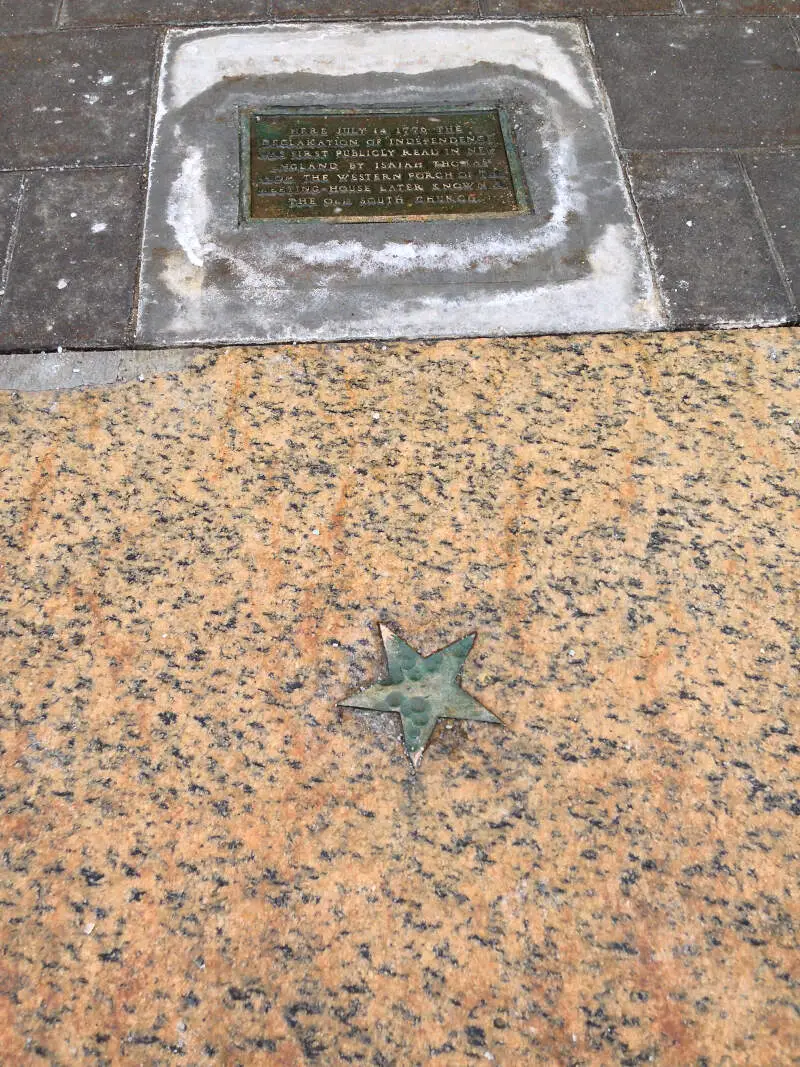
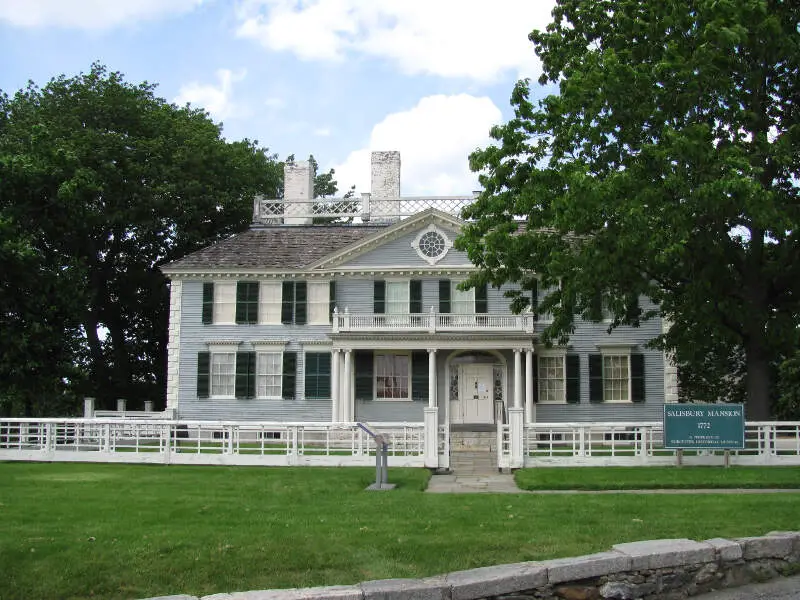
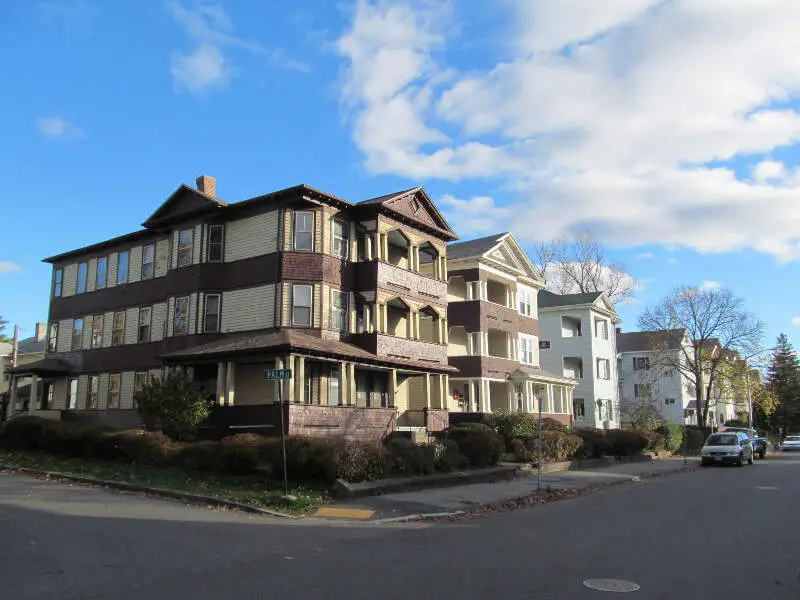
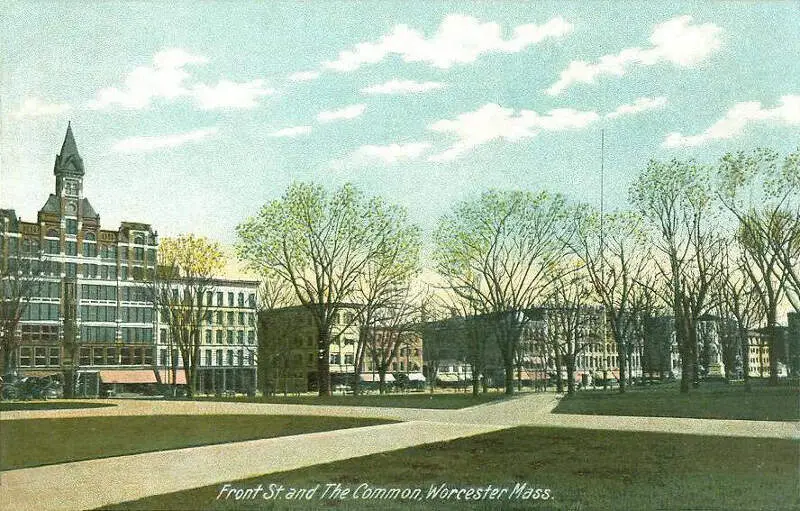
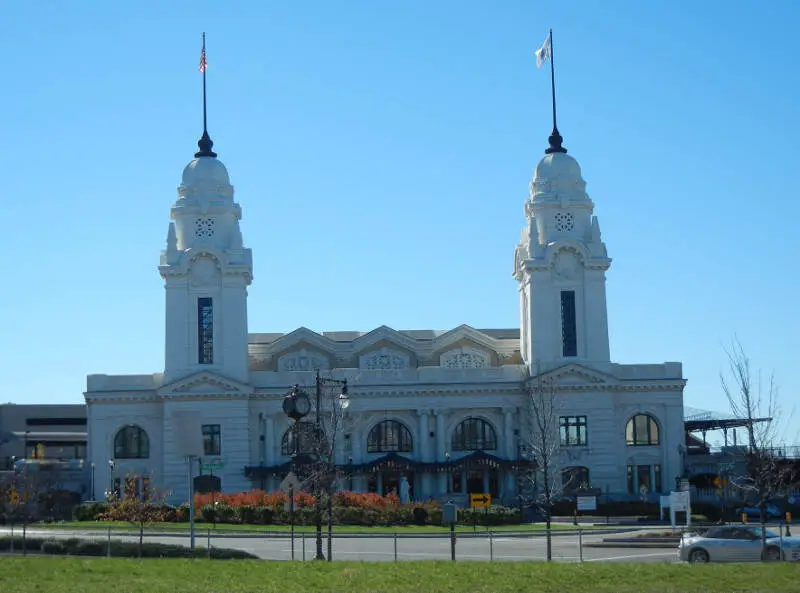
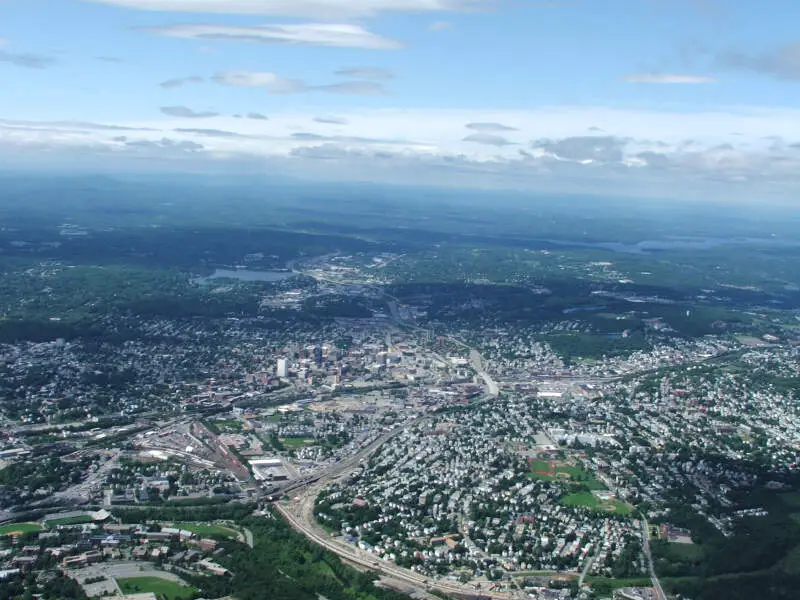
Worcester, MA Photos
1 Reviews & Comments About Worcester

Depending on where you live in Worcester, there's not a lot of crime. Compared to other cities bigger or the same size as Worcester, the murder rate is pretty low based on published data. As any other city that is surrounded by a major city, Worcester is pretty much swallowed up by Boston. To have a great time out, one needs to step out of Worcester. Most of the schools in worcester are bad with a couple good ones in the best areas of Worcester.
Rent and housing prices are not too high compared to Boston and Cambridge.
Rankings & Articles For Worcester


Locations Around Worcester
Map Of Worcester, MA
Best Places Around Worcester
Northborough, MA
Population 6,392
Hudson, MA
Population 15,719
Marlborough, MA
Population 41,647
Clinton, MA
Population 7,658
Milford, MA
Population 27,731
Oxford, MA
Population 5,671
Whitinsville, MA
Population 7,115
Worcester Demographics And Statistics
Population over time in Worcester
The current population in Worcester is 207,055. The population has increased 15.0% from 2010.
| Year | Population | % Change |
|---|---|---|
| 2024 | 207,055 | 0.8% |
| 2023 | 205,501 | 0.6% |
| 2022 | 204,191 | 0.2% |
| 2021 | 203,867 | 10.1% |
| 2020 | 185,186 | 0.0% |
| 2019 | 185,143 | -0.0% |
| 2018 | 185,195 | 0.2% |
| 2017 | 184,743 | 0.6% |
| 2016 | 183,677 | 0.2% |
| 2015 | 183,382 | 0.5% |
| 2014 | 182,511 | 0.3% |
| 2013 | 181,901 | 0.2% |
| 2012 | 181,473 | 0.5% |
| 2011 | 180,519 | 0.3% |
| 2010 | 179,994 | - |
Race / Ethnicity in Worcester
See the full breakdown
Worcester is:
48.6% White with 100,716 White residents.
12.1% African American with 24,994 African American residents.
0.1% American Indian with 184 American Indian residents.
7.2% Asian with 14,815 Asian residents.
0.0% Hawaiian with 65 Hawaiian residents.
1.3% Other with 2,743 Other residents.
5.4% Two Or More with 11,245 Two Or More residents.
25.3% Hispanic with 52,293 Hispanic residents.
| Race | Worcester | MA | USA |
|---|---|---|---|
| White | 48.6% | 66.6% | 57.4% |
| African American | 12.1% | 6.4% | 11.9% |
| American Indian | 0.1% | 0.1% | 0.5% |
| Asian | 7.2% | 7.3% | 5.9% |
| Hawaiian | 0.0% | 0.0% | 0.2% |
| Other | 1.3% | 1.2% | 0.6% |
| Two Or More | 5.4% | 5.1% | 4.3% |
| Hispanic | 25.3% | 13.3% | 19.3% |
Gender in Worcester
See the full breakdown
Worcester is 50.4% female with 104,337 female residents.
Worcester is 49.6% male with 102,717 male residents.
| Gender | Worcester | MA | USA |
|---|---|---|---|
| Female | 50.4% | 51.1% | 50.5% |
| Male | 49.6% | 48.9% | 49.5% |
Highest level of educational attainment in Worcester for adults over 25
See the full breakdown
8.0% of adults in Worcester completed < 9th grade.
7.0% of adults in Worcester completed 9-12th grade.
27.0% of adults in Worcester completed high school / ged.
16.0% of adults in Worcester completed some college.
8.0% of adults in Worcester completed associate's degree.
20.0% of adults in Worcester completed bachelor's degree.
10.0% of adults in Worcester completed master's degree.
2.0% of adults in Worcester completed professional degree.
2.0% of adults in Worcester completed doctorate degree.
| Education | Worcester | MA | USA |
|---|---|---|---|
| < 9th Grade | 8.0% | 6.0% | 4.0% |
| 9-12th Grade | 7.0% | 4.0% | 6.0% |
| High School / GED | 27.0% | 23.0% | 26.0% |
| Some College | 16.0% | 14.0% | 19.0% |
| Associate's Degree | 8.0% | 7.0% | 9.0% |
| Bachelor's Degree | 20.0% | 25.0% | 22.0% |
| Master's Degree | 10.0% | 15.0% | 10.0% |
| Professional Degree | 2.0% | 3.0% | 2.0% |
| Doctorate Degree | 2.0% | 3.0% | 2.0% |
Household Income For Worcester, Massachusetts
See the full breakdown
6.4% of households in Worcester earn Less than $10,000.
6.0% of households in Worcester earn $10,000 to $14,999.
8.1% of households in Worcester earn $15,000 to $24,999.
6.6% of households in Worcester earn $25,000 to $34,999.
10.7% of households in Worcester earn $35,000 to $49,999.
15.4% of households in Worcester earn $50,000 to $74,999.
12.3% of households in Worcester earn $75,000 to $99,999.
16.6% of households in Worcester earn $100,000 to $149,999.
8.6% of households in Worcester earn $150,000 to $199,999.
9.3% of households in Worcester earn $200,000 or more.
| Income | Worcester | MA | USA |
|---|---|---|---|
| Less than $10,000 | 6.4% | 4.4% | 5.0% |
| $10,000 to $14,999 | 6.0% | 3.3% | 3.4% |
| $15,000 to $24,999 | 8.1% | 5.5% | 6.3% |
| $25,000 to $34,999 | 6.6% | 5.0% | 6.6% |
| $35,000 to $49,999 | 10.7% | 7.5% | 10.1% |
| $50,000 to $74,999 | 15.4% | 12.0% | 15.5% |
| $75,000 to $99,999 | 12.3% | 10.7% | 12.6% |
| $100,000 to $149,999 | 16.6% | 17.5% | 17.5% |
| $150,000 to $199,999 | 8.6% | 11.9% | 9.6% |
| $200,000 or more | 9.3% | 22.3% | 13.4% |
Source: U.S. Census ACS 5-year estimates (2024)


