Most Native American places in Vermont research summary. We used Saturday Night Science to research the Vermont cities with the highest percentage of Native American residents for 2026. The data comes from the American Community Survey 2020-2024 vintage, which breaks down race by origin.
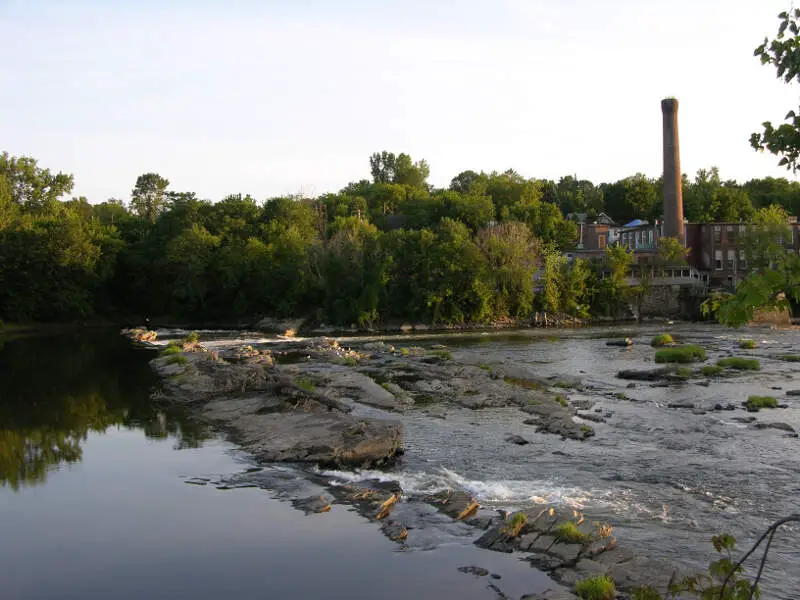
The city with the highest percentage of Native Americans is Newport. 1.73% of people in Newport are Native Americans.
The city with the lowest percentage of Native Americans is Barre. 0.00% of people in Barre are Native American.
The city with the most Native Americans is South Burlington. 82 people in South Burlington are Native American.
The city with the fewest Native Americans is Barre. 0 people in Barre are Native American.
The United States has 1,698,432 Native Americans and is 0.51% Native American.
Which city in Vermont had the largest Native American population? The place with the largest Native American population in Vermont for 2026 is Newport. 1.73% of Newport identify as Native American.
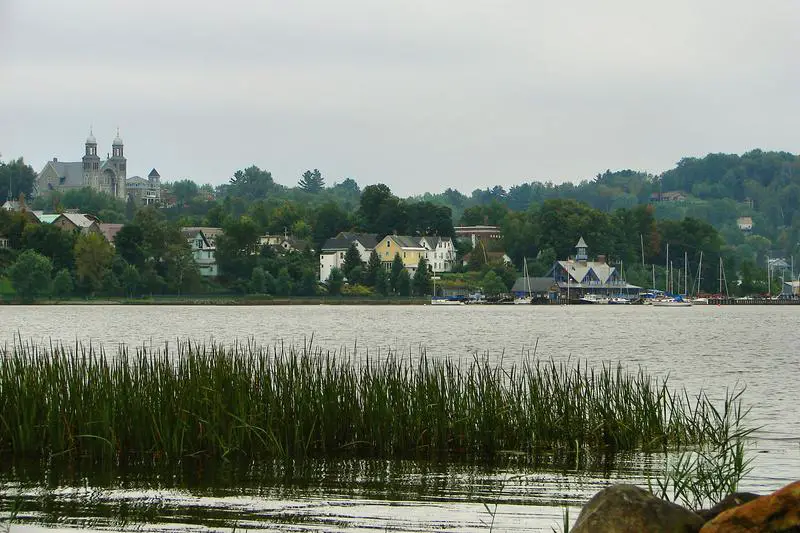
1.7% Native American · 76 Native American residents
Data | Crime | Cost of living | Movers
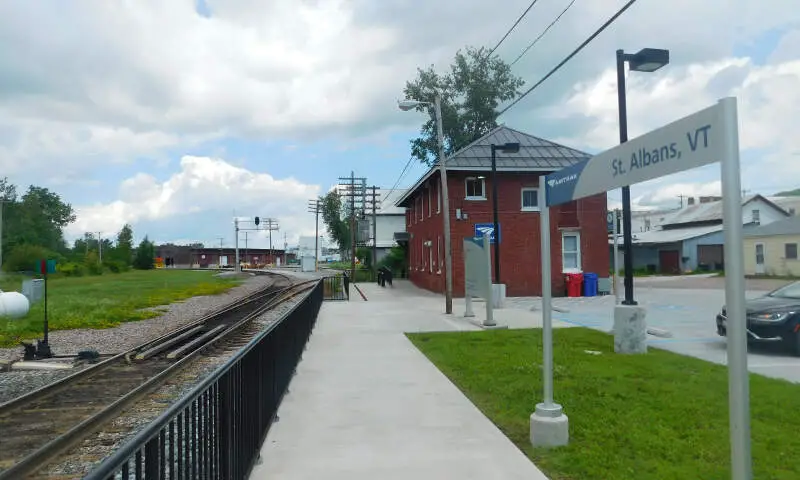
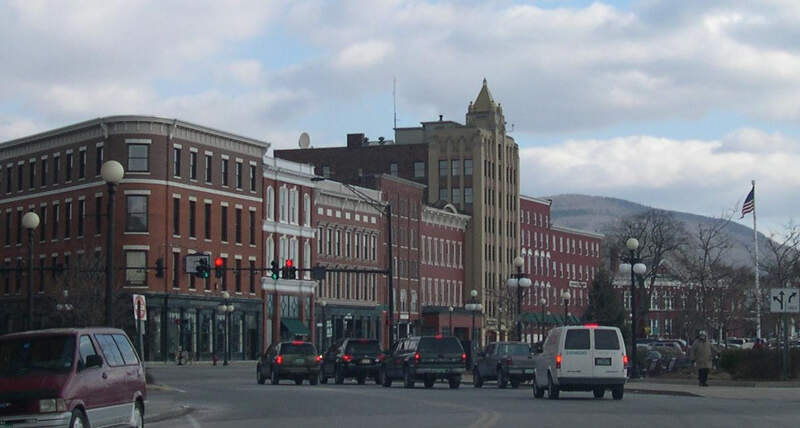
0.8% Native American · 56 Native American residents
Data | Crime | Cost of living | Movers
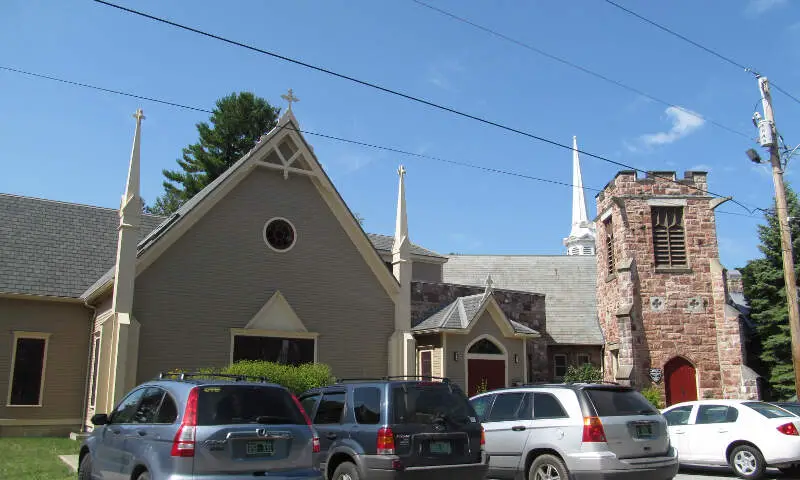
0.4% Native American · 11 Native American residents
Data | Crime | Cost of living | Movers
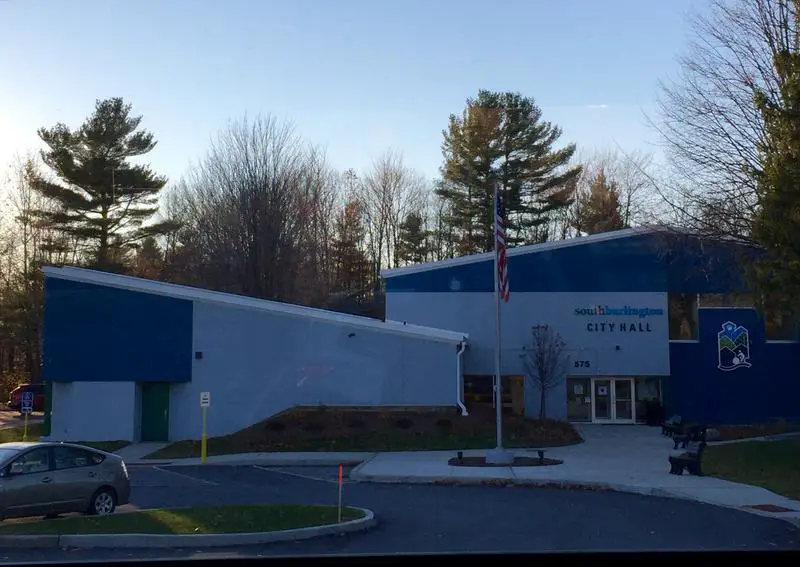
0.4% Native American · 82 Native American residents
South Burlington is a city in Chittenden County, Vermont, United States. It is the second largest city in the U.S. state of Vermont and home to the headquarters of Ben & Jerry’s and Vermont’s largest mall, the University Mall. It is also one in the principal municipalities of the Burlington, Vermont metropolitan area.
Data | Crime | Cost of living | Movers
0.4% Native American · 10 Native American residents
0.3% Native American · 15 Native American residents
St. Johnsbury is the shire town of Caledonia County, Vermont, United States. The population was 7,603 at the 2010 census. St. Johnsbury is located approximately 10 miles northwest of the Connecticut River and 48 miles south of the Canada-U.S. border.
0.1% Native American · 7 Native American residents
Winooski is a city in Chittenden County, Vermont, United States. Located on the Winooski River, as of the 2010 U.S. Census the municipal population was 7,267. The city is the most densely populated municipality in northern New England, an area comprising the states of Maine, New Hampshire, and Vermont. It is the smallest in area of Vermont’s nine incorporated cities. As part of the Burlington, Vermont metropolitan area, it is bordered by Burlington, Colchester, and South Burlington.
Data | Crime | Cost of living | Movers
0.0% Native American · 4 Native American residents
Data | Crime | Cost of living | Movers
0.0% Native American · 9 Native American residents
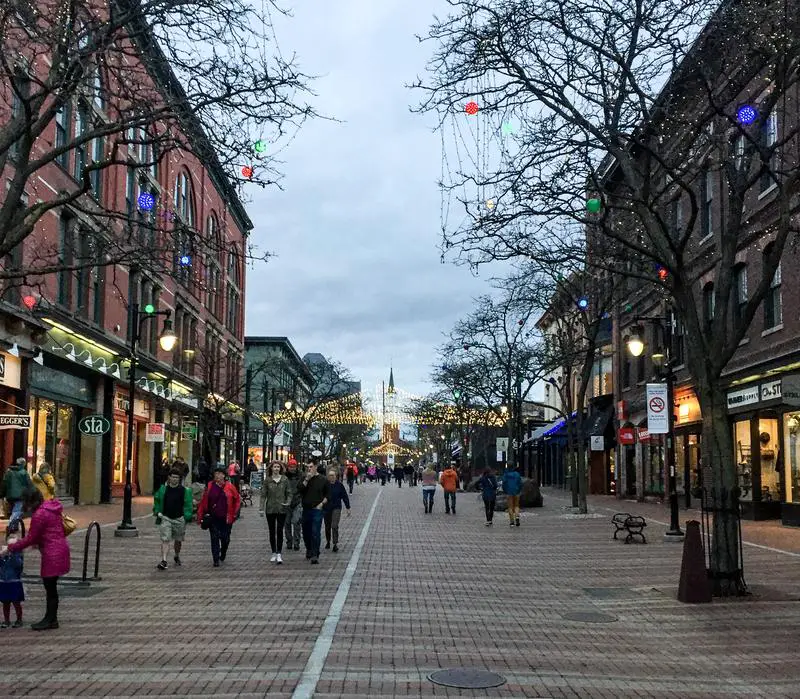
Burlington is the most populous city in the U.S. state of Vermont and the seat of Chittenden County. It is located 45 miles south of the Canada-United States border and 94 miles south of Canada’s second most populous municipality, Montreal. The city’s population was 42,452 according to a 2015 U.S. census estimate. It is the least populous municipality in the United States to be the most populous incorporated area in a state.
Data | Crime | Cost of living | Movers
0.0% Native American · 0 Native American residents
The receipts
Compare the top ten
Pick a metric. The bars rescale. The red line is Vermont’s statewide median.
On the map
Where Vermont’s Native American population is concentrated
Saturday Night Science
Methodology: How We Determined The Cities In Vermont With The Largest Native American Population For 2026
We still believe in the accuracy of data — especially from the Census. So that’s where we went to get the race breakdown across Vermont.
We used Saturday Night Science to analyze the Census’s most recently available data, the 2020-2024 American Community Survey data.
Specifically, we looked at table B03002: Hispanic OR LATINO ORIGIN BY RACE. Here are the category names as defined by the Census:
- Hispanic or Latino
- White alone
- Black or African American alone
- American Indian and Alaska Native alone
- Asian alone
- Native Hawaiian and Other Pacific Islander alone
- Some other race alone
- Two or more races
Our particular column of interest here was the number of people identifying as American Indian and Alaska Native alone.
We limited our analysis to places with a population greater than 2,000 people. That left us with 23 cities.
We then calculated the percentage of residents that are American Indian and Alaska Native. The percentages ranked from 1.73 to 0.00.
Finally, we ranked each city based on the percentage of the American Indian and Alaska Native population, with a higher score being more American Indian and Alaska Native than a lower score. Newport took the distinction of being the most American Indian and Alaska Native, while Barre was the least Native American city.
We updated this article for 2026. This article is our eleventh time ranking the cities in Vermont with the largest Native American population.
The full plate
Most Native American Places In Vermont
Click any column to sort. Search by city name.
| Rank | City | Population | Native American Population | % Native American |
|---|---|---|---|---|
| 1 | Newport | 4,394 | 76 | 1.7% |
| 2 | St. Albans | 6,954 | 56 | 0.8% |
| 3 | Swanton | 2,670 | 11 | 0.4% |
| 4 | South Burlington | 20,756 | 82 | 0.4% |
| 5 | Fair Haven | 2,537 | 10 | 0.4% |
| 6 | St. Johnsbury | 5,859 | 15 | 0.3% |
| 7 | Winooski | 8,293 | 7 | 0.1% |
| 8 | Rutland | 15,712 | 4 | 0.0% |
| 9 | Burlington | 44,675 | 9 | 0.0% |
| 16 | White River Junction | 3,364 | 0 | 0.0% |
| 16 | West Rutland | 2,125 | 0 | 0.0% |
| 16 | West Brattleboro | 2,749 | 0 | 0.0% |
| 16 | Vergennes | 2,565 | 0 | 0.0% |
| 16 | Bennington | 9,245 | 0 | 0.0% |
| 16 | Brattleboro | 7,657 | 0 | 0.0% |
| 16 | Middlebury | 7,220 | 0 | 0.0% |
| 16 | Manchester Center | 2,037 | 0 | 0.0% |
| 16 | Bellows Falls | 2,891 | 0 | 0.0% |
| 16 | Windsor | 2,060 | 0 | 0.0% |
| 16 | Morrisville | 2,664 | 0 | 0.0% |
| 16 | Montpelier | 8,014 | 0 | 0.0% |
| 16 | Springfield | 4,237 | 0 | 0.0% |
| 16 | Barre | 8,412 | 0 | 0.0% |
Source: U.S. Census ACS 2020-2024, table B03002. 23 Vermont cities with more than 2,000 residents.
Summary
Summary: Native American Populations Across Vermont
If you’re looking for a breakdown of Native American populations across Vermont according to the most recent data, this is an accurate list.
The most Native American cities in Vermont are Newport, St. Albans, Swanton, South Burlington, Fair Haven, St. Johnsbury, Winooski, Rutland, Burlington, and White River Junction.


