Burlington SnackAbility
Overall SnackAbility
Crime in Burlington summary. We use data from the FBI to determine the crime rates in Burlington. Key points include:
There were 2,120 total crimes in Burlington in the last reporting year.
The overall crime rate per 100,000 people in Burlington is 4,768.8 / 100k people.
The violent crime rate per 100,000 people in Burlington is 479.1 / 100k people.
The property crime rate per 100,000 people in Burlington is 4,289.6 / 100k people.
Overall, crime in Burlington is 125.02% above the national average.
Total Crimes
Above National Average
Crime In Burlington Comparison Table
| Statistic | Count Raw |
Burlington / 100k People |
Vermont / 100k People |
National / 100k People |
|---|---|---|---|---|
| Total Crimes Per 100K | 2,120 | 4,768.8 | 1,846.6 | 2,119.2 |
| Violent Crime | 213 | 479.1 | 219.1 | 359.0 |
| Murder | 1 | 2.2 | 3.4 | 5.0 |
| Robbery | 24 | 54.0 | 14.2 | 61.0 |
| Aggravated Assault | 179 | 402.6 | 166.8 | 256.0 |
| Property Crime | 1,907 | 4,289.6 | 1,627.5 | 1,760.0 |
| Burglary | 171 | 384.6 | 130.6 | 229.0 |
| Larceny | 1,652 | 3,716.0 | 1,433.3 | 1,272.0 |
| Car Theft | 84 | 189.0 | 63.5 | 259.0 |
Source: FBI Uniform Crime Reporting (2024)
Cost of living in Burlington summary. We use data on the cost of living to determine how expensive it is to live in Burlington. Real estate prices drive most of the variance in cost of living around Vermont. Key points include:
The cost of living in Burlington is 121 with 100 being average.
The cost of living in Burlington is 1.2x higher than the national average.
The median home value in Burlington is $506,784.
The median income in Burlington is $71,109.
Burlington's Overall Cost Of Living
Higher Than The National Average
Cost Of Living In Burlington Comparison Table
| Living Expense | Burlington | Vermont | National Average |
|---|---|---|---|
| Overall | 121 | 110 | 100 |
| Services | 108 | 105 | 100 |
| Groceries | 107 | 103 | 100 |
| Health | 156 | 114 | 100 |
| Housing | 105 | 106 | 100 |
| Transportation | 107 | 106 | 100 |
| Utilities | 104 | 103 | 100 |
Source: Cost of living index, normalized to US average = 100
Burlington, VT Weather
The average high in Burlington is 54.9° and the average low is 36.2°.
There are 81.5 days of precipitation each year.
Expect an average of 36.4 inches of precipitation each year with 75.2 inches of snow.
| Stat | Burlington |
|---|---|
| Average Annual High | 54.9 |
| Average Annual Low | 36.2 |
| Annual Precipitation Days | 81.5 |
| Average Annual Precipitation | 36.4 |
| Average Annual Snowfall | 75.2 |
Average High
Days of Rain
Source: NOAA climate normals (30-year)
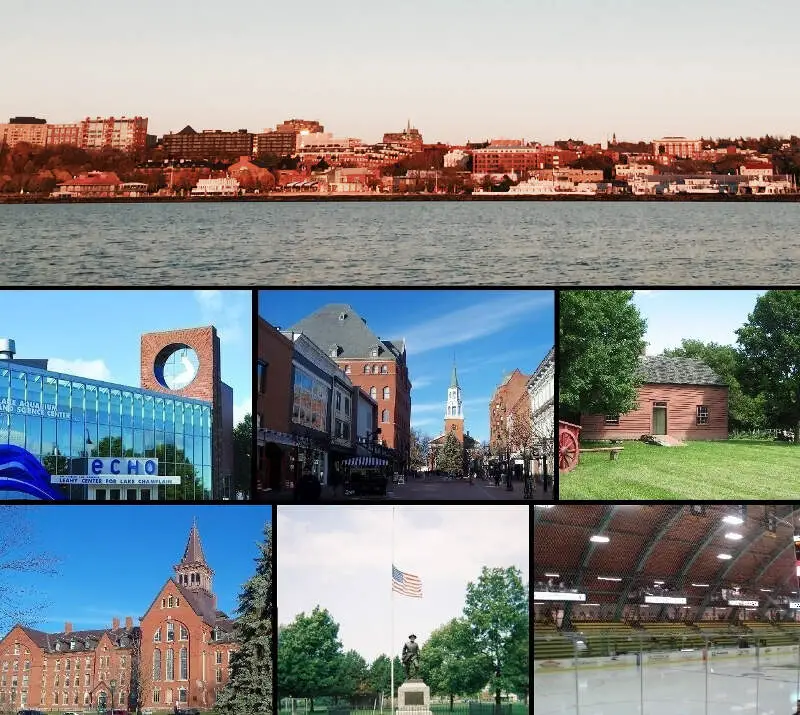
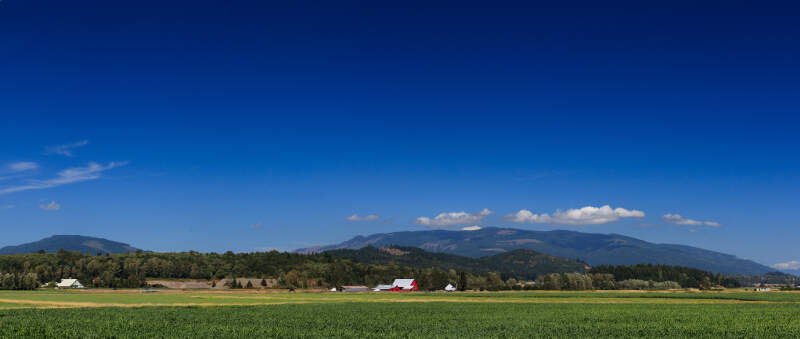
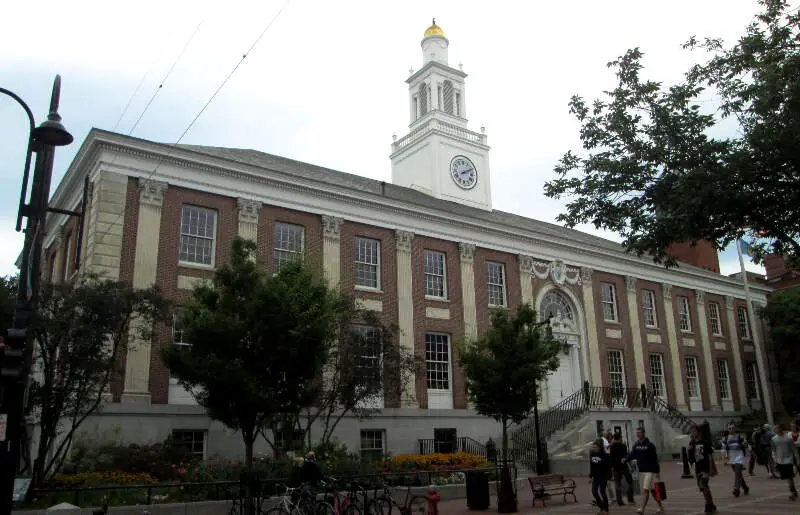
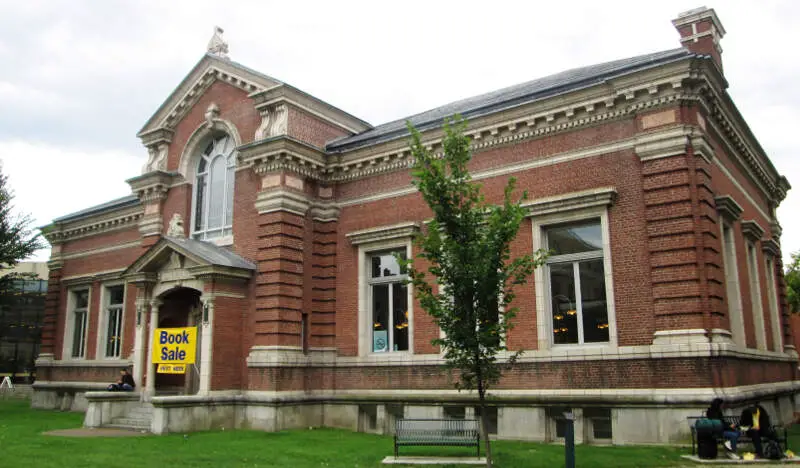
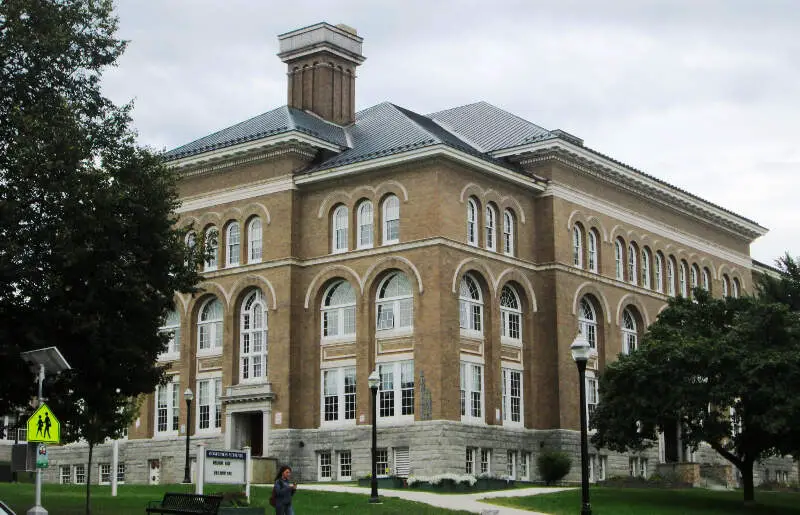
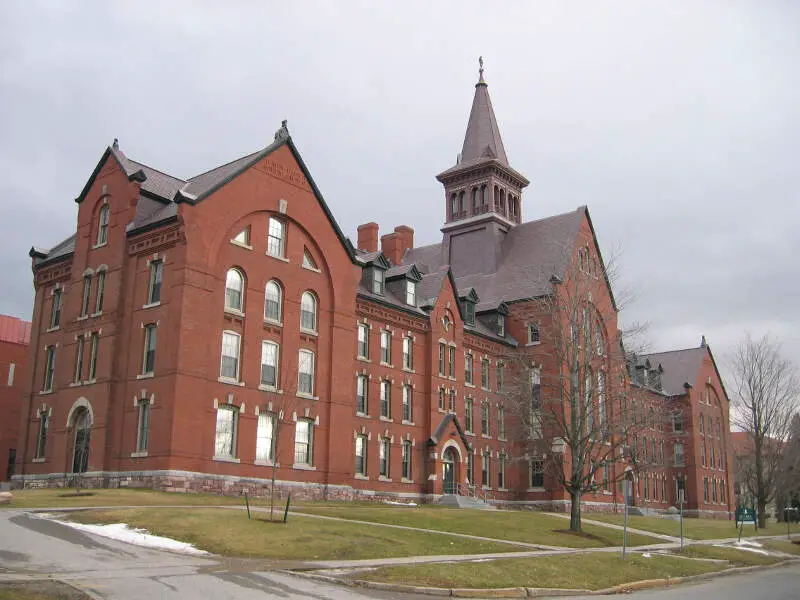
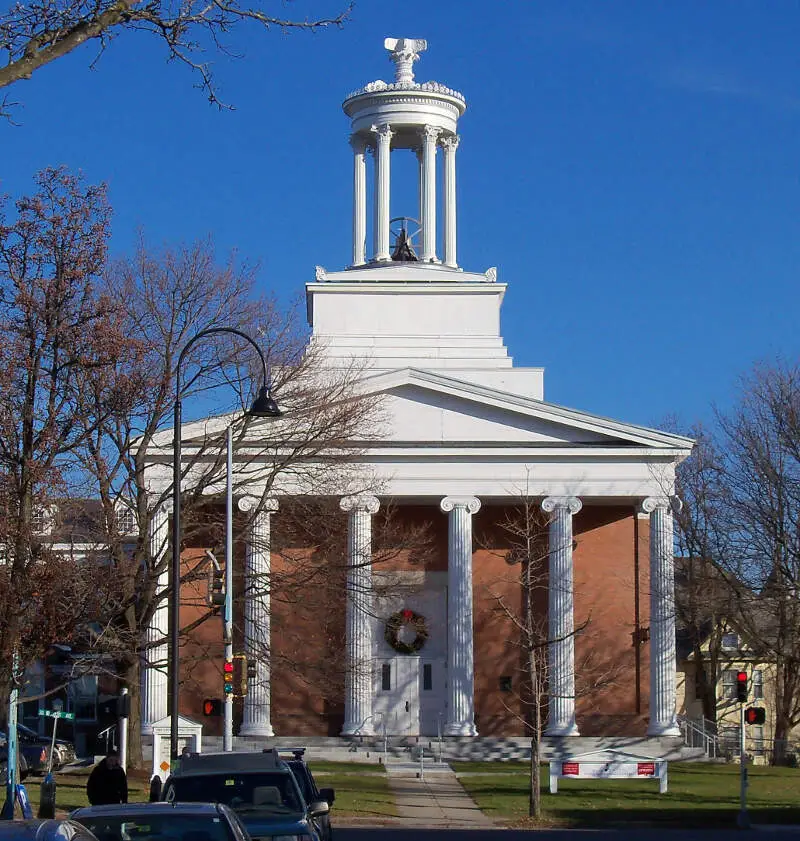
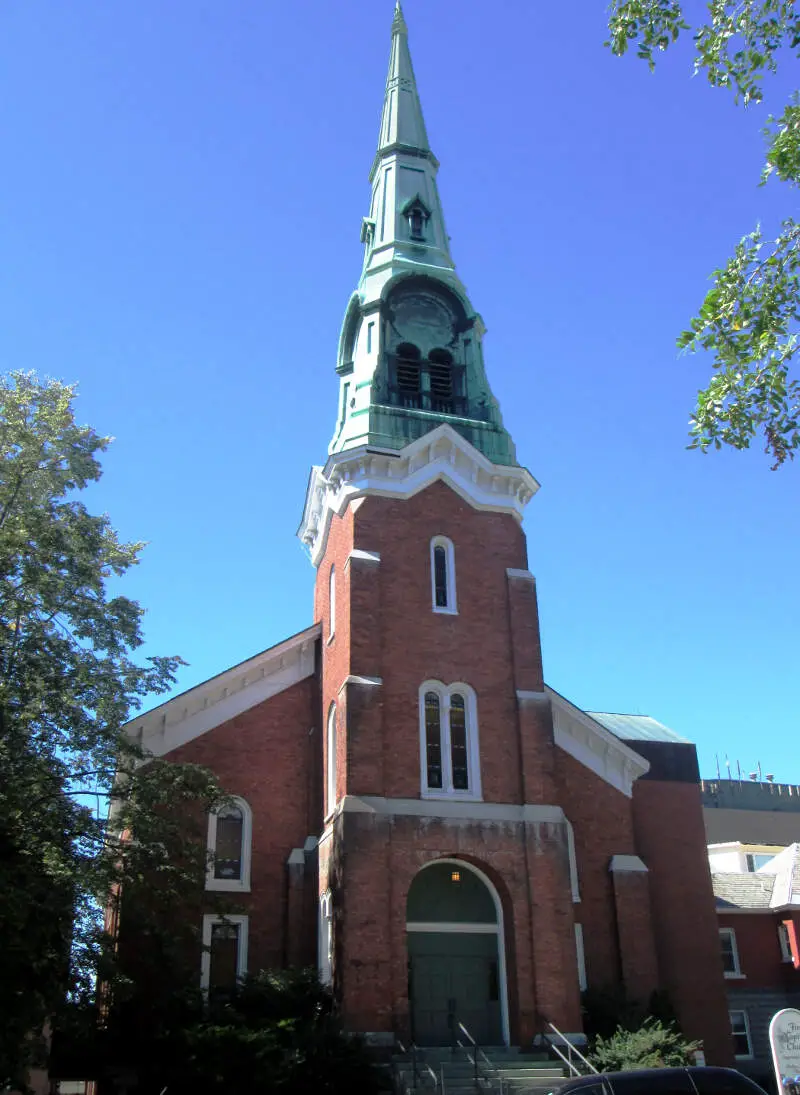
Burlington, VT Photos
1 Reviews & Comments About Burlington

Burlington Vermont is a nice small city on the coast of Lake Champlain. Nature is beautiful, great food scene and countless craft breweries to taste. Other than those things the city is missing more things to do, plus it is in need of updating everything. It is very dark at night so at intersections double check before driving through. Parks say they are smoke-free, but no one enforces that rule. The bike path is a cool thing but it needs to be modernized.
Skinny Pancake is a great restaurant located on the waterfront.
Rankings & Articles For Burlington


Locations Around Burlington
Map Of Burlington, VT
Best Places Around Burlington
Plattsburgh, NY
Population 19,830
Shelburne, VT
Population 6,499
South Burlington, VT
Population 20,756
Winooski, VT
Population 8,293
Burlington Demographics And Statistics
Population over time in Burlington
The current population in Burlington is 44,675. The population has increased 6.5% from 2010.
| Year | Population | % Change |
|---|---|---|
| 2024 | 44,675 | 0.1% |
| 2023 | 44,649 | 0.0% |
| 2022 | 44,646 | -0.1% |
| 2021 | 44,703 | 4.8% |
| 2020 | 42,645 | 0.2% |
| 2019 | 42,545 | 0.1% |
| 2018 | 42,513 | 0.1% |
| 2017 | 42,453 | -0.2% |
| 2016 | 42,556 | -0.0% |
| 2015 | 42,570 | 0.5% |
| 2014 | 42,342 | 0.0% |
| 2013 | 42,331 | 0.2% |
| 2012 | 42,259 | 0.2% |
| 2011 | 42,192 | 0.6% |
| 2010 | 41,935 | - |
Race / Ethnicity in Burlington
See the full breakdown
Burlington is:
84.1% White with 37,560 White residents.
2.9% African American with 1,298 African American residents.
0.0% American Indian with 9 American Indian residents.
4.2% Asian with 1,868 Asian residents.
0.0% Hawaiian with 0 Hawaiian residents.
0.2% Other with 93 Other residents.
5.8% Two Or More with 2,594 Two Or More residents.
2.8% Hispanic with 1,253 Hispanic residents.
| Race | Burlington | VT | USA |
|---|---|---|---|
| White | 84.1% | 89.9% | 57.4% |
| African American | 2.9% | 1.1% | 11.9% |
| American Indian | 0.0% | 0.1% | 0.5% |
| Asian | 4.2% | 1.8% | 5.9% |
| Hawaiian | 0.0% | 0.0% | 0.2% |
| Other | 0.2% | 0.4% | 0.6% |
| Two Or More | 5.8% | 4.1% | 4.3% |
| Hispanic | 2.8% | 2.6% | 19.3% |
Gender in Burlington
See the full breakdown
Burlington is 53.3% female with 23,796 female residents.
Burlington is 46.7% male with 20,878 male residents.
| Gender | Burlington | VT | USA |
|---|---|---|---|
| Female | 53.3% | 50.4% | 50.5% |
| Male | 46.7% | 49.6% | 49.5% |
Highest level of educational attainment in Burlington for adults over 25
See the full breakdown
2.0% of adults in Burlington completed < 9th grade.
3.0% of adults in Burlington completed 9-12th grade.
17.0% of adults in Burlington completed high school / ged.
12.0% of adults in Burlington completed some college.
6.0% of adults in Burlington completed associate's degree.
32.0% of adults in Burlington completed bachelor's degree.
19.0% of adults in Burlington completed master's degree.
5.0% of adults in Burlington completed professional degree.
4.0% of adults in Burlington completed doctorate degree.
| Education | Burlington | VT | USA |
|---|---|---|---|
| < 9th Grade | 2.0% | 2.0% | 4.0% |
| 9-12th Grade | 3.0% | 3.0% | 6.0% |
| High School / GED | 17.0% | 27.0% | 26.0% |
| Some College | 12.0% | 16.0% | 19.0% |
| Associate's Degree | 6.0% | 9.0% | 9.0% |
| Bachelor's Degree | 32.0% | 25.0% | 22.0% |
| Master's Degree | 19.0% | 13.0% | 10.0% |
| Professional Degree | 5.0% | 3.0% | 2.0% |
| Doctorate Degree | 4.0% | 2.0% | 2.0% |
Household Income For Burlington, Vermont
See the full breakdown
7.5% of households in Burlington earn Less than $10,000.
3.4% of households in Burlington earn $10,000 to $14,999.
8.5% of households in Burlington earn $15,000 to $24,999.
6.8% of households in Burlington earn $25,000 to $34,999.
10.8% of households in Burlington earn $35,000 to $49,999.
15.9% of households in Burlington earn $50,000 to $74,999.
11.6% of households in Burlington earn $75,000 to $99,999.
15.5% of households in Burlington earn $100,000 to $149,999.
9.1% of households in Burlington earn $150,000 to $199,999.
10.9% of households in Burlington earn $200,000 or more.
| Income | Burlington | VT | USA |
|---|---|---|---|
| Less than $10,000 | 7.5% | 3.7% | 5.0% |
| $10,000 to $14,999 | 3.4% | 3.2% | 3.4% |
| $15,000 to $24,999 | 8.5% | 6.6% | 6.3% |
| $25,000 to $34,999 | 6.8% | 6.6% | 6.6% |
| $35,000 to $49,999 | 10.8% | 10.1% | 10.1% |
| $50,000 to $74,999 | 15.9% | 16.3% | 15.5% |
| $75,000 to $99,999 | 11.6% | 12.9% | 12.6% |
| $100,000 to $149,999 | 15.5% | 19.0% | 17.5% |
| $150,000 to $199,999 | 9.1% | 10.4% | 9.6% |
| $200,000 or more | 10.9% | 11.1% | 13.4% |
Source: U.S. Census ACS 5-year estimates (2024)


