Hastings SnackAbility
Overall SnackAbility
Crime in Hastings summary. We use data from the FBI to determine the crime rates in Hastings. Key points include:
There were 577 total crimes in Hastings in the last reporting year.
The overall crime rate per 100,000 people in Hastings is 2,325.2 / 100k people.
The violent crime rate per 100,000 people in Hastings is 318.4 / 100k people.
The property crime rate per 100,000 people in Hastings is 2,006.9 / 100k people.
Overall, crime in Hastings is 9.72% above the national average.
Total Crimes
Above National Average
Crime In Hastings Comparison Table
| Statistic | Count Raw |
Hastings / 100k People |
Nebraska / 100k People |
National / 100k People |
|---|---|---|---|---|
| Total Crimes Per 100K | 577 | 2,325.2 | 1,847.2 | 2,119.2 |
| Violent Crime | 79 | 318.4 | 220.5 | 359.0 |
| Murder | 0 | 0.0 | 2.1 | 5.0 |
| Robbery | 1 | 4.0 | 20.5 | 61.0 |
| Aggravated Assault | 50 | 201.5 | 154.5 | 256.0 |
| Property Crime | 498 | 2,006.9 | 1,626.7 | 1,760.0 |
| Burglary | 34 | 137.0 | 155.1 | 229.0 |
| Larceny | 424 | 1,708.6 | 1,218.9 | 1,272.0 |
| Car Theft | 40 | 161.2 | 252.6 | 259.0 |
Source: FBI Uniform Crime Reporting (2024)
Cost of living in Hastings summary. We use data on the cost of living to determine how expensive it is to live in Hastings. Real estate prices drive most of the variance in cost of living around Nebraska. Key points include:
The cost of living in Hastings is 90 with 100 being average.
The cost of living in Hastings is 0.9x lower than the national average.
The median home value in Hastings is $200,240.
The median income in Hastings is $64,048.
Hastings's Overall Cost Of Living
Lower Than The National Average
Cost Of Living In Hastings Comparison Table
| Living Expense | Hastings | Nebraska | National Average |
|---|---|---|---|
| Overall | 90 | 89 | 100 |
| Services | 95 | 98 | 100 |
| Groceries | 98 | 99 | 100 |
| Health | 72 | 77 | 100 |
| Housing | 98 | 99 | 100 |
| Transportation | 96 | 98 | 100 |
| Utilities | 97 | 96 | 100 |
Source: Cost of living index, normalized to US average = 100
Hastings, NE Weather
The average high in Hastings is 62.4° and the average low is 39.4°.
There are 51.6 days of precipitation each year.
Expect an average of 27.7 inches of precipitation each year with 26.6 inches of snow.
| Stat | Hastings |
|---|---|
| Average Annual High | 62.4 |
| Average Annual Low | 39.4 |
| Annual Precipitation Days | 51.6 |
| Average Annual Precipitation | 27.7 |
| Average Annual Snowfall | 26.6 |
Average High
Days of Rain
Source: NOAA climate normals (30-year)
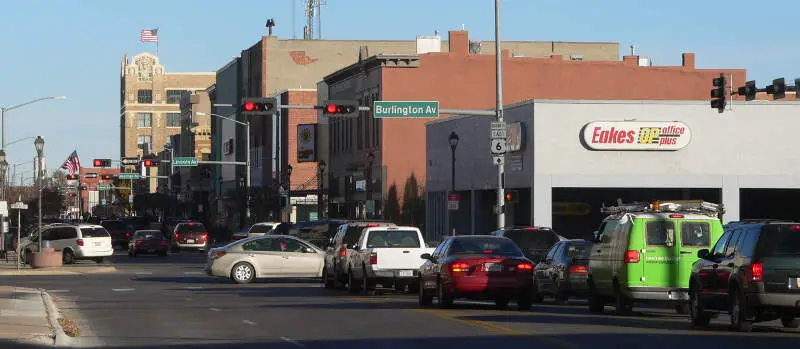
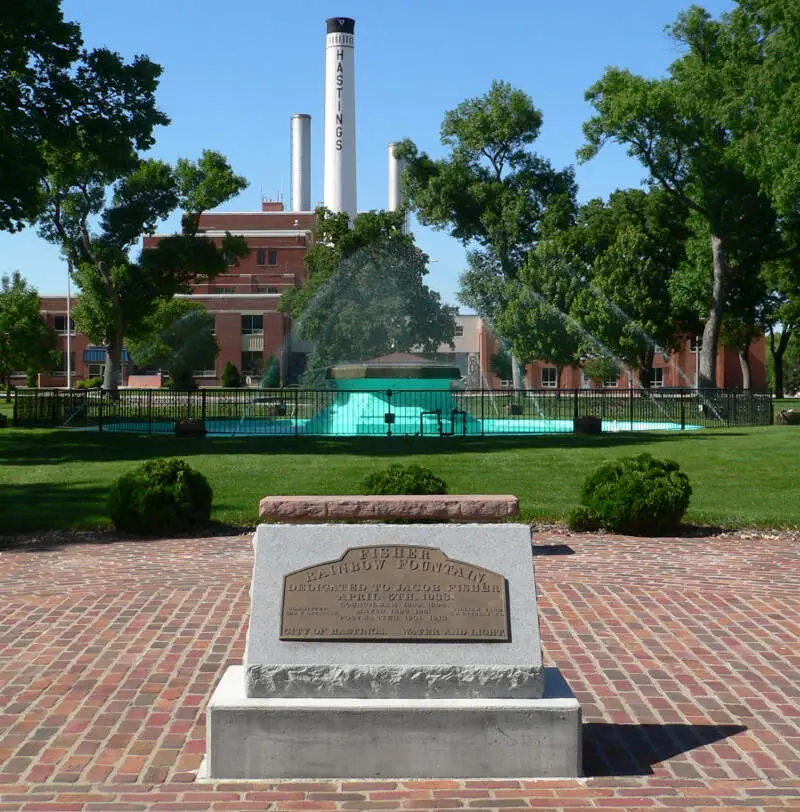
Hastings, NE Photos
1 Reviews & Comments About Hastings

nothing to do in fact the whole mall is closed theres like 3 stores left in the mall one of them includes Napolis, herbergers closed, the only thing teens really have to do is illegal activites, i lived in hastings for 15 years and now im currently in a group home in norfolk, teens in hastings are in all kinds of legal trouble, and hastings high is a bad place to be to, the teens there actually attack Mr. Szlanda the principle, almost every month.
the entire mall is now a place where old farts go and walk for exercise.
Rankings & Articles For Hastings


Locations Around Hastings
Map Of Hastings, NE
Best Places Around Hastings
Aurora, NE
Population 4,664
Kearney, NE
Population 34,246
York, NE
Population 8,141
Hastings Demographics And Statistics
Population over time in Hastings
The current population in Hastings is 25,008. The population has increased 1.2% from 2010.
| Year | Population | % Change |
|---|---|---|
| 2024 | 25,008 | 0.0% |
| 2023 | 25,005 | -0.4% |
| 2022 | 25,098 | -0.6% |
| 2021 | 25,247 | 1.5% |
| 2020 | 24,878 | -0.1% |
| 2019 | 24,906 | -0.1% |
| 2018 | 24,922 | -0.1% |
| 2017 | 24,948 | -0.1% |
| 2016 | 24,983 | 0.0% |
| 2015 | 24,973 | -0.2% |
| 2014 | 25,030 | 0.1% |
| 2013 | 25,003 | 0.2% |
| 2012 | 24,960 | 0.9% |
| 2011 | 24,738 | 0.1% |
| 2010 | 24,717 | - |
Race / Ethnicity in Hastings
See the full breakdown
Hastings is:
78.9% White with 19,731 White residents.
1.6% African American with 388 African American residents.
0.2% American Indian with 49 American Indian residents.
1.1% Asian with 277 Asian residents.
0.0% Hawaiian with 0 Hawaiian residents.
0.4% Other with 109 Other residents.
2.8% Two Or More with 696 Two Or More residents.
15.0% Hispanic with 3,758 Hispanic residents.
| Race | Hastings | NE | USA |
|---|---|---|---|
| White | 78.9% | 75.3% | 57.4% |
| African American | 1.6% | 4.6% | 11.9% |
| American Indian | 0.2% | 0.6% | 0.5% |
| Asian | 1.1% | 2.6% | 5.9% |
| Hawaiian | 0.0% | 0.0% | 0.2% |
| Other | 0.4% | 0.4% | 0.6% |
| Two Or More | 2.8% | 3.8% | 4.3% |
| Hispanic | 15.0% | 12.7% | 19.3% |
Gender in Hastings
See the full breakdown
Hastings is 51.5% female with 12,877 female residents.
Hastings is 48.5% male with 12,130 male residents.
| Gender | Hastings | NE | USA |
|---|---|---|---|
| Female | 51.5% | 49.7% | 50.5% |
| Male | 48.5% | 50.3% | 49.5% |
Highest level of educational attainment in Hastings for adults over 25
See the full breakdown
2.0% of adults in Hastings completed < 9th grade.
5.0% of adults in Hastings completed 9-12th grade.
23.0% of adults in Hastings completed high school / ged.
26.0% of adults in Hastings completed some college.
14.0% of adults in Hastings completed associate's degree.
17.0% of adults in Hastings completed bachelor's degree.
8.0% of adults in Hastings completed master's degree.
3.0% of adults in Hastings completed professional degree.
2.0% of adults in Hastings completed doctorate degree.
| Education | Hastings | NE | USA |
|---|---|---|---|
| < 9th Grade | 2.0% | 3.0% | 4.0% |
| 9-12th Grade | 5.0% | 4.0% | 6.0% |
| High School / GED | 23.0% | 25.0% | 26.0% |
| Some College | 26.0% | 22.0% | 19.0% |
| Associate's Degree | 14.0% | 11.0% | 9.0% |
| Bachelor's Degree | 17.0% | 22.0% | 22.0% |
| Master's Degree | 8.0% | 9.0% | 10.0% |
| Professional Degree | 3.0% | 2.0% | 2.0% |
| Doctorate Degree | 2.0% | 2.0% | 2.0% |
Household Income For Hastings, Nebraska
See the full breakdown
4.5% of households in Hastings earn Less than $10,000.
5.4% of households in Hastings earn $10,000 to $14,999.
11.7% of households in Hastings earn $15,000 to $24,999.
6.8% of households in Hastings earn $25,000 to $34,999.
11.7% of households in Hastings earn $35,000 to $49,999.
18.7% of households in Hastings earn $50,000 to $74,999.
10.0% of households in Hastings earn $75,000 to $99,999.
17.4% of households in Hastings earn $100,000 to $149,999.
7.2% of households in Hastings earn $150,000 to $199,999.
6.5% of households in Hastings earn $200,000 or more.
| Income | Hastings | NE | USA |
|---|---|---|---|
| Less than $10,000 | 4.5% | 4.3% | 5.0% |
| $10,000 to $14,999 | 5.4% | 3.1% | 3.4% |
| $15,000 to $24,999 | 11.7% | 6.4% | 6.3% |
| $25,000 to $34,999 | 6.8% | 6.9% | 6.6% |
| $35,000 to $49,999 | 11.7% | 11.1% | 10.1% |
| $50,000 to $74,999 | 18.7% | 17.3% | 15.5% |
| $75,000 to $99,999 | 10.0% | 13.5% | 12.6% |
| $100,000 to $149,999 | 17.4% | 18.9% | 17.5% |
| $150,000 to $199,999 | 7.2% | 9.1% | 9.6% |
| $200,000 or more | 6.5% | 9.4% | 13.4% |
Source: U.S. Census ACS 5-year estimates (2024)


