Franklin SnackAbility
Overall SnackAbility
Crime in Franklin summary. We use data from the FBI to determine the crime rates in Franklin. Key points include:
There were 119 total crimes in Franklin in the last reporting year.
The overall crime rate per 100,000 people in Franklin is 1,351.5 / 100k people.
The violent crime rate per 100,000 people in Franklin is 90.9 / 100k people.
The property crime rate per 100,000 people in Franklin is 1,260.6 / 100k people.
Overall, crime in Franklin is -36.23% below the national average.
Total Crimes
Below National Average
Crime In Franklin Comparison Table
| Statistic | Count Raw |
Franklin / 100k People |
New Hampshire / 100k People |
National / 100k People |
|---|---|---|---|---|
| Total Crimes Per 100K | 119 | 1,351.5 | 1,028.1 | 2,119.2 |
| Violent Crime | 8 | 90.9 | 110.1 | 359.0 |
| Murder | 0 | 0.0 | 1.0 | 5.0 |
| Robbery | 1 | 11.4 | 12.6 | 61.0 |
| Aggravated Assault | 7 | 79.5 | 62.8 | 256.0 |
| Property Crime | 111 | 1,260.6 | 918.0 | 1,760.0 |
| Burglary | 5 | 56.8 | 48.1 | 229.0 |
| Larceny | 101 | 1,147.1 | 805.4 | 1,272.0 |
| Car Theft | 5 | 56.8 | 64.4 | 259.0 |
Source: FBI Uniform Crime Reporting (2024)
Cost of living in Franklin summary. We use data on the cost of living to determine how expensive it is to live in Franklin. Real estate prices drive most of the variance in cost of living around New Hampshire. Key points include:
The cost of living in Franklin is 104 with 100 being average.
The cost of living in Franklin is 1.0x higher than the national average.
The median home value in Franklin is $376,959.
The median income in Franklin is $71,648.
Franklin's Overall Cost Of Living
Higher Than The National Average
Cost Of Living In Franklin Comparison Table
| Living Expense | Franklin | New Hampshire | National Average |
|---|---|---|---|
| Overall | 104 | 111 | 100 |
| Services | 106 | 103 | 100 |
| Groceries | 107 | 105 | 100 |
| Health | 103 | 126 | 100 |
| Housing | 102 | 104 | 100 |
| Transportation | 103 | 108 | 100 |
| Utilities | 100 | 102 | 100 |
Source: Cost of living index, normalized to US average = 100
Franklin, NH Weather
The average high in Franklin is 57.1° and the average low is 34.7°.
There are 92.0 days of precipitation each year.
Expect an average of 45.3 inches of precipitation each year with 64.2 inches of snow.
| Stat | Franklin |
|---|---|
| Average Annual High | 57.1 |
| Average Annual Low | 34.7 |
| Annual Precipitation Days | 92.0 |
| Average Annual Precipitation | 45.3 |
| Average Annual Snowfall | 64.2 |
Average High
Days of Rain
Source: NOAA climate normals (30-year)
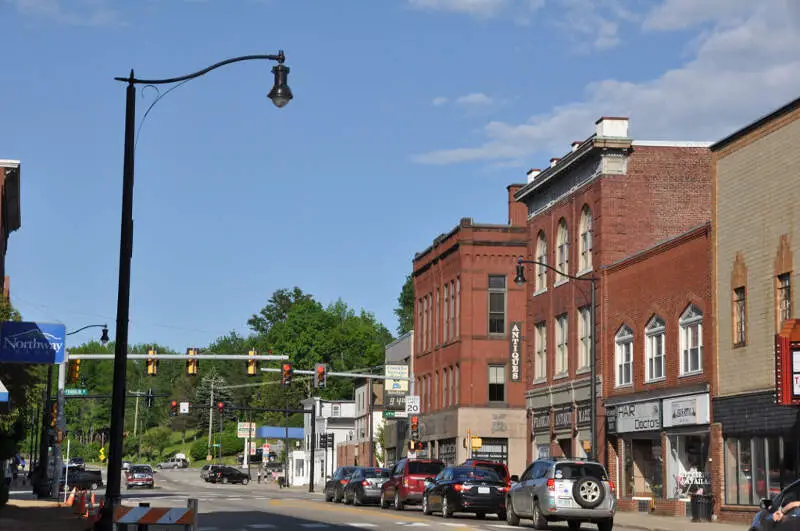
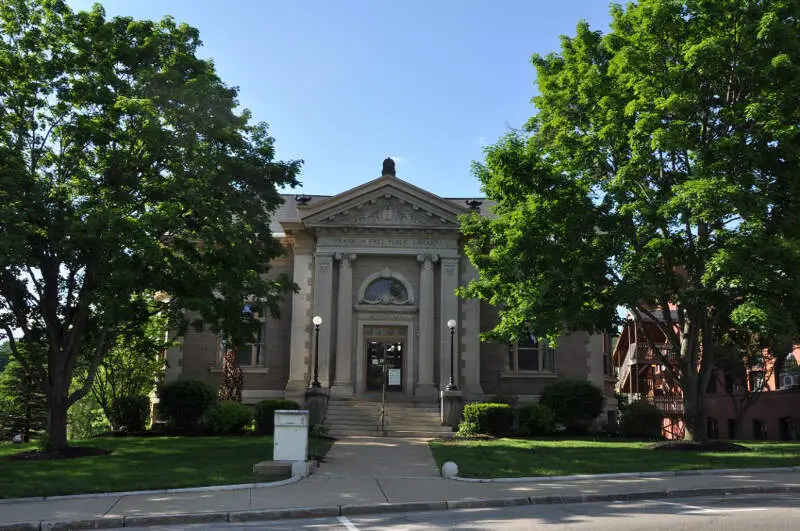
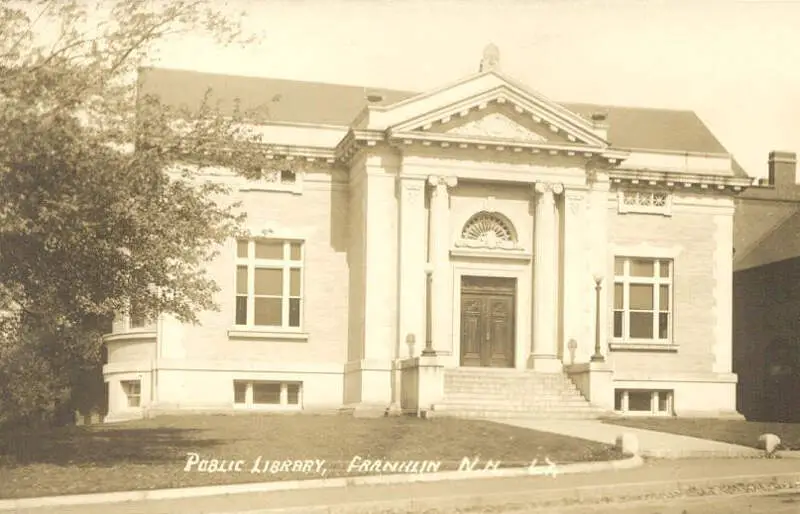
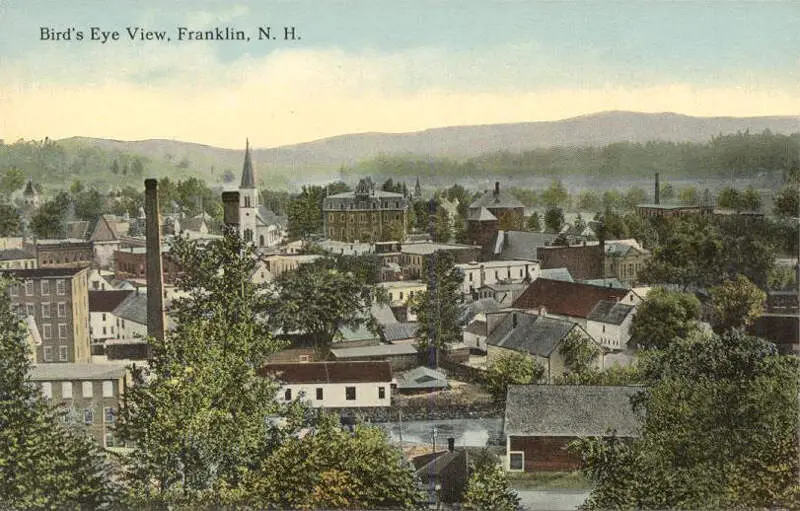
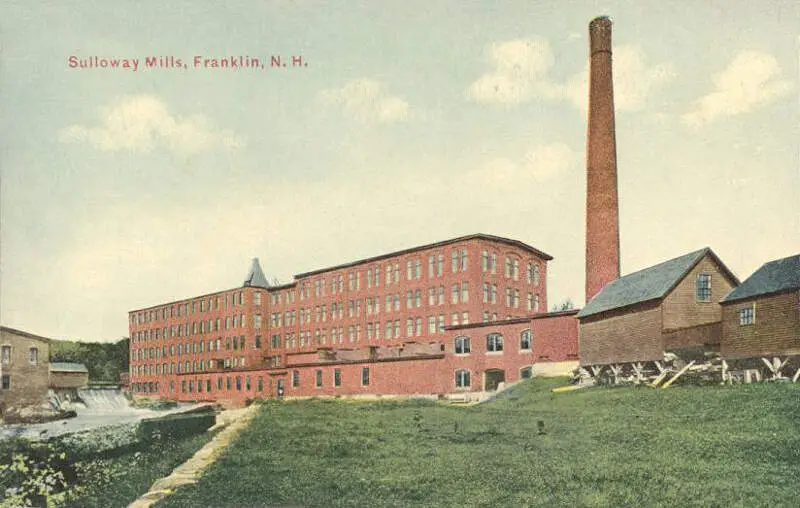
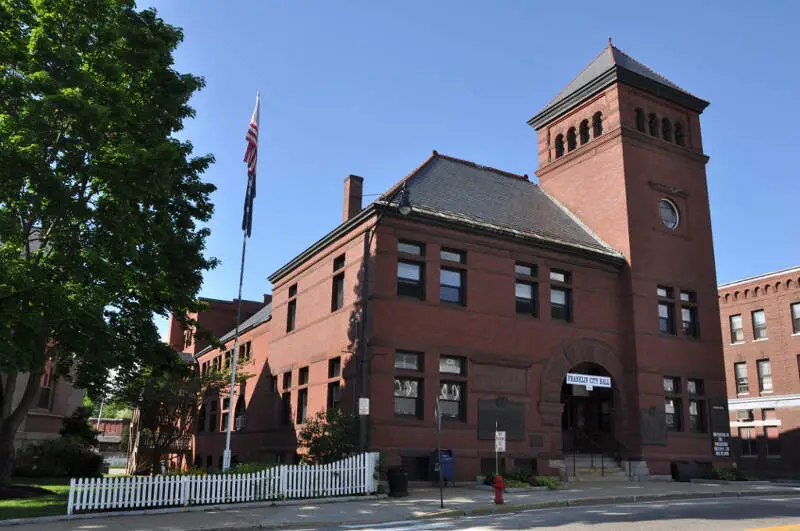
Franklin, NH Photos

3 Reviews & Comments About Franklin

Taught at a camp here. Kids seemed sweet and generally interested in learning. Town, however, was shockingly run down and there is a high population of low-lifes. I didn't even realize places like this exist in NH.
The beach in seems to be frequented by some serious scum bags. Also door to rest room opens inwards and HAS NO HANDLE ON THE INSIDE!
There is a decent amount of crime here. One of my coworkers houses was broken into while they weren't home. Some teenagers were telling me about a hill that the druggies go to get high. The school struggles due to lack of funding. Teens in the area say there is nothing to do and look forward to leaving Franklin and it's druggies behind. Franklin needs to address the serious drug and homeless issue that is happening under their noses. A promise with a grant to bring some tourism into Franklin may help improve the conditions.
The river is good for kayaking, if they can fix up the area with the grant I think it will improve the area.
Theres nothing to do in the down really /nothing to bring people to our town. THE SCHOOL STiNk specially the Franklin middle school they don't give a f about any of there students really that say they try to help but make things worse most of the time, a lot of them are rude and they hire bad teachers and cut a lot of programs kids like if it's not convenient for them to keep because of budget kits, a lot of the teachers swear and also there's a lot of drama in the town
favorite places are the library because it's like a safe place and also at the parks and at the rec watch out
Rankings & Articles For Franklin


Locations Around Franklin
Map Of Franklin, NH
Best Places Around Franklin
Hanover, NH
Population 8,479
South Hooksett, NH
Population 5,902
Newmarket, NH
Population 5,679
Exeter, NH
Population 9,964
Durham, NH
Population 10,681
Dover, NH
Population 33,364
Franklin Demographics And Statistics
Population over time in Franklin
The current population in Franklin is 8,799. The population has increased 2.5% from 2010.
| Year | Population | % Change |
|---|---|---|
| 2024 | 8,799 | 0.5% |
| 2023 | 8,757 | 0.1% |
| 2022 | 8,746 | -0.2% |
| 2021 | 8,766 | 0.8% |
| 2020 | 8,695 | 0.8% |
| 2019 | 8,623 | 0.4% |
| 2018 | 8,586 | 1.1% |
| 2017 | 8,491 | 0.6% |
| 2016 | 8,440 | -0.2% |
| 2015 | 8,460 | -0.0% |
| 2014 | 8,462 | -0.2% |
| 2013 | 8,479 | -0.2% |
| 2012 | 8,499 | -0.6% |
| 2011 | 8,552 | -0.3% |
| 2010 | 8,582 | - |
Race / Ethnicity in Franklin
See the full breakdown
Franklin is:
94.6% White with 8,327 White residents.
0.3% African American with 27 African American residents.
0.0% American Indian with 0 American Indian residents.
0.3% Asian with 28 Asian residents.
0.0% Hawaiian with 0 Hawaiian residents.
1.1% Other with 94 Other residents.
3.5% Two Or More with 309 Two Or More residents.
0.2% Hispanic with 14 Hispanic residents.
| Race | Franklin | NH | USA |
|---|---|---|---|
| White | 94.6% | 86.9% | 57.4% |
| African American | 0.3% | 1.3% | 11.9% |
| American Indian | 0.0% | 0.1% | 0.5% |
| Asian | 0.3% | 2.6% | 5.9% |
| Hawaiian | 0.0% | 0.0% | 0.2% |
| Other | 1.1% | 0.4% | 0.6% |
| Two Or More | 3.5% | 4.0% | 4.3% |
| Hispanic | 0.2% | 4.7% | 19.3% |
Gender in Franklin
See the full breakdown
Franklin is 53.6% female with 4,719 female residents.
Franklin is 46.4% male with 4,080 male residents.
| Gender | Franklin | NH | USA |
|---|---|---|---|
| Female | 53.6% | 50.1% | 50.5% |
| Male | 46.4% | 49.9% | 49.5% |
Highest level of educational attainment in Franklin for adults over 25
See the full breakdown
3.0% of adults in Franklin completed < 9th grade.
6.0% of adults in Franklin completed 9-12th grade.
35.0% of adults in Franklin completed high school / ged.
30.0% of adults in Franklin completed some college.
7.0% of adults in Franklin completed associate's degree.
11.0% of adults in Franklin completed bachelor's degree.
8.0% of adults in Franklin completed master's degree.
0.0% of adults in Franklin completed professional degree.
0.0% of adults in Franklin completed doctorate degree.
| Education | Franklin | NH | USA |
|---|---|---|---|
| < 9th Grade | 3.0% | 2.0% | 4.0% |
| 9-12th Grade | 6.0% | 4.0% | 6.0% |
| High School / GED | 35.0% | 27.0% | 26.0% |
| Some College | 30.0% | 17.0% | 19.0% |
| Associate's Degree | 7.0% | 10.0% | 9.0% |
| Bachelor's Degree | 11.0% | 24.0% | 22.0% |
| Master's Degree | 8.0% | 12.0% | 10.0% |
| Professional Degree | 0.0% | 2.0% | 2.0% |
| Doctorate Degree | 0.0% | 2.0% | 2.0% |
Household Income For Franklin, New Hampshire
See the full breakdown
4.2% of households in Franklin earn Less than $10,000.
2.9% of households in Franklin earn $10,000 to $14,999.
6.0% of households in Franklin earn $15,000 to $24,999.
3.7% of households in Franklin earn $25,000 to $34,999.
18.4% of households in Franklin earn $35,000 to $49,999.
18.4% of households in Franklin earn $50,000 to $74,999.
13.5% of households in Franklin earn $75,000 to $99,999.
22.2% of households in Franklin earn $100,000 to $149,999.
6.0% of households in Franklin earn $150,000 to $199,999.
4.8% of households in Franklin earn $200,000 or more.
| Income | Franklin | NH | USA |
|---|---|---|---|
| Less than $10,000 | 4.2% | 3.2% | 5.0% |
| $10,000 to $14,999 | 2.9% | 2.3% | 3.4% |
| $15,000 to $24,999 | 6.0% | 4.9% | 6.3% |
| $25,000 to $34,999 | 3.7% | 5.3% | 6.6% |
| $35,000 to $49,999 | 18.4% | 8.1% | 10.1% |
| $50,000 to $74,999 | 18.4% | 14.3% | 15.5% |
| $75,000 to $99,999 | 13.5% | 12.4% | 12.6% |
| $100,000 to $149,999 | 22.2% | 20.0% | 17.5% |
| $150,000 to $199,999 | 6.0% | 12.7% | 9.6% |
| $200,000 or more | 4.8% | 16.8% | 13.4% |
Source: U.S. Census ACS 5-year estimates (2024)


