Portsmouth SnackAbility
Overall SnackAbility
Crime in Portsmouth summary. We use data from the FBI to determine the crime rates in Portsmouth. Key points include:
There were 338 total crimes in Portsmouth in the last reporting year.
The overall crime rate per 100,000 people in Portsmouth is 1,471.5 / 100k people.
The violent crime rate per 100,000 people in Portsmouth is 187.2 / 100k people.
The property crime rate per 100,000 people in Portsmouth is 1,284.3 / 100k people.
Overall, crime in Portsmouth is -30.56% below the national average.
Total Crimes
Below National Average
Crime In Portsmouth Comparison Table
| Statistic | Count Raw |
Portsmouth / 100k People |
New Hampshire / 100k People |
National / 100k People |
|---|---|---|---|---|
| Total Crimes Per 100K | 338 | 1,471.5 | 1,028.1 | 2,119.2 |
| Violent Crime | 43 | 187.2 | 110.1 | 359.0 |
| Murder | 0 | 0.0 | 1.0 | 5.0 |
| Robbery | 2 | 8.7 | 12.6 | 61.0 |
| Aggravated Assault | 32 | 139.3 | 62.8 | 256.0 |
| Property Crime | 295 | 1,284.3 | 918.0 | 1,760.0 |
| Burglary | 7 | 30.5 | 48.1 | 229.0 |
| Larceny | 265 | 1,153.7 | 805.4 | 1,272.0 |
| Car Theft | 23 | 100.1 | 64.4 | 259.0 |
Source: FBI Uniform Crime Reporting (2024)
Cost of living in Portsmouth summary. We use data on the cost of living to determine how expensive it is to live in Portsmouth. Real estate prices drive most of the variance in cost of living around New Hampshire. Key points include:
The cost of living in Portsmouth is 137 with 100 being average.
The cost of living in Portsmouth is 1.4x higher than the national average.
The median home value in Portsmouth is $798,497.
The median income in Portsmouth is $106,219.
Portsmouth's Overall Cost Of Living
Higher Than The National Average
Cost Of Living In Portsmouth Comparison Table
| Living Expense | Portsmouth | New Hampshire | National Average |
|---|---|---|---|
| Overall | 137 | 111 | 100 |
| Services | 104 | 103 | 100 |
| Groceries | 101 | 105 | 100 |
| Health | 218 | 126 | 100 |
| Housing | 103 | 104 | 100 |
| Transportation | 108 | 108 | 100 |
| Utilities | 108 | 102 | 100 |
Source: Cost of living index, normalized to US average = 100
Portsmouth, NH Weather
The average high in Portsmouth is 57.3° and the average low is 37.5°.
There are 81.5 days of precipitation each year.
Expect an average of 48.8 inches of precipitation each year with 54.7 inches of snow.
| Stat | Portsmouth |
|---|---|
| Average Annual High | 57.3 |
| Average Annual Low | 37.5 |
| Annual Precipitation Days | 81.5 |
| Average Annual Precipitation | 48.8 |
| Average Annual Snowfall | 54.7 |
Average High
Days of Rain
Source: NOAA climate normals (30-year)
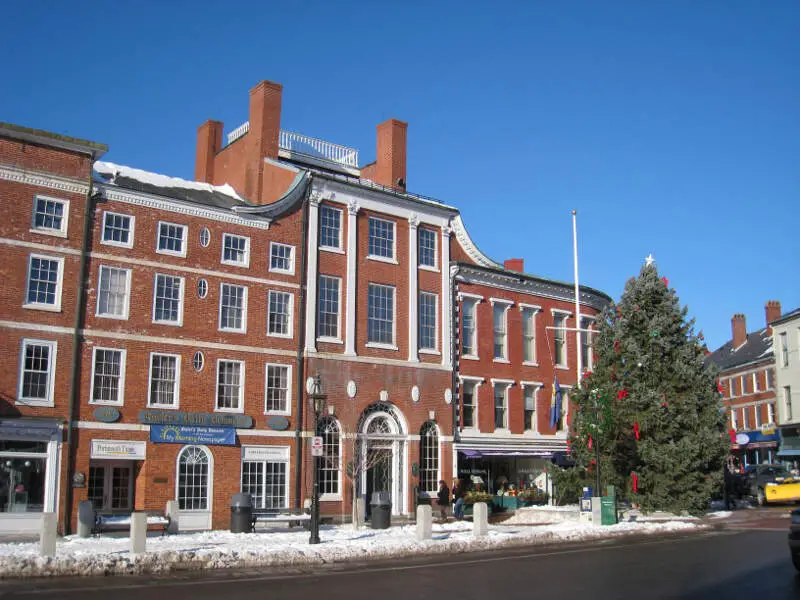
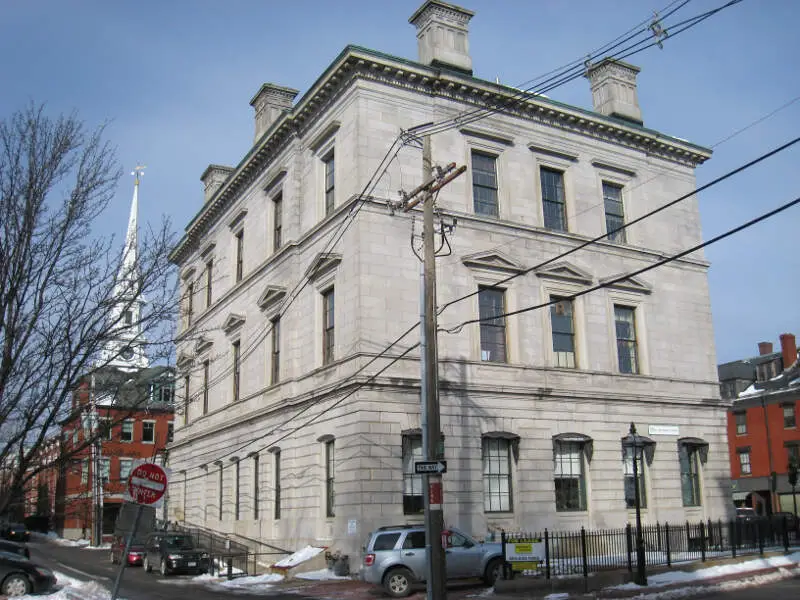
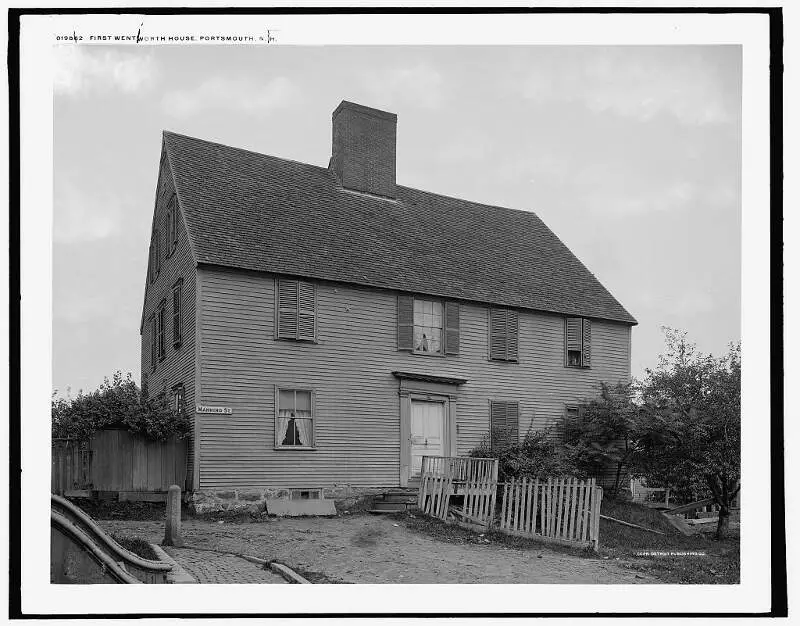
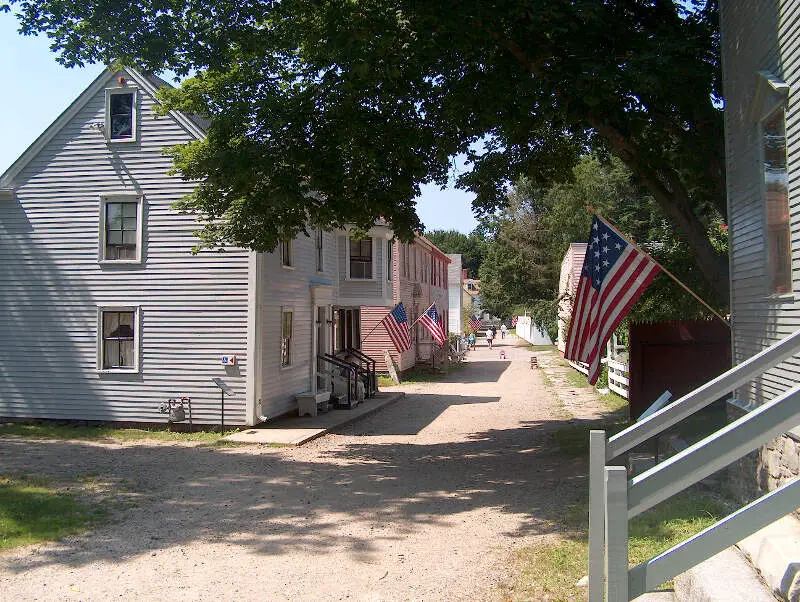
Portsmouth, NH Photos


Rankings & Articles For Portsmouth


Locations Around Portsmouth
Map Of Portsmouth, NH
Best Places Around Portsmouth
Newburyport, MA
Population 18,652
Newmarket, NH
Population 5,679
Exeter, NH
Population 9,964
Durham, NH
Population 10,681
Dover, NH
Population 33,364
Hampton, NH
Population 10,101
Somersworth, NH
Population 12,111
Rochester, NH
Population 33,144
Portsmouth Demographics And Statistics
Population over time in Portsmouth
The current population in Portsmouth is 22,545. The population has increased 7.5% from 2010.
| Year | Population | % Change |
|---|---|---|
| 2024 | 22,545 | 1.0% |
| 2023 | 22,332 | 0.9% |
| 2022 | 22,138 | 1.1% |
| 2021 | 21,897 | 2.2% |
| 2020 | 21,418 | -1.6% |
| 2019 | 21,775 | -0.0% |
| 2018 | 21,778 | 0.6% |
| 2017 | 21,644 | 0.9% |
| 2016 | 21,458 | 0.1% |
| 2015 | 21,426 | 0.3% |
| 2014 | 21,366 | 0.6% |
| 2013 | 21,237 | 0.5% |
| 2012 | 21,140 | 1.2% |
| 2011 | 20,899 | -0.3% |
| 2010 | 20,963 | - |
Race / Ethnicity in Portsmouth
See the full breakdown
Portsmouth is:
86.2% White with 19,431 White residents.
0.2% African American with 51 African American residents.
0.0% American Indian with 3 American Indian residents.
4.1% Asian with 919 Asian residents.
0.0% Hawaiian with 8 Hawaiian residents.
1.7% Other with 384 Other residents.
3.9% Two Or More with 885 Two Or More residents.
3.8% Hispanic with 864 Hispanic residents.
| Race | Portsmouth | NH | USA |
|---|---|---|---|
| White | 86.2% | 86.9% | 57.4% |
| African American | 0.2% | 1.3% | 11.9% |
| American Indian | 0.0% | 0.1% | 0.5% |
| Asian | 4.1% | 2.6% | 5.9% |
| Hawaiian | 0.0% | 0.0% | 0.2% |
| Other | 1.7% | 0.4% | 0.6% |
| Two Or More | 3.9% | 4.0% | 4.3% |
| Hispanic | 3.8% | 4.7% | 19.3% |
Gender in Portsmouth
See the full breakdown
Portsmouth is 50.3% female with 11,344 female residents.
Portsmouth is 49.7% male with 11,200 male residents.
| Gender | Portsmouth | NH | USA |
|---|---|---|---|
| Female | 50.3% | 50.1% | 50.5% |
| Male | 49.7% | 49.9% | 49.5% |
Highest level of educational attainment in Portsmouth for adults over 25
See the full breakdown
1.0% of adults in Portsmouth completed < 9th grade.
2.0% of adults in Portsmouth completed 9-12th grade.
16.0% of adults in Portsmouth completed high school / ged.
12.0% of adults in Portsmouth completed some college.
5.0% of adults in Portsmouth completed associate's degree.
41.0% of adults in Portsmouth completed bachelor's degree.
17.0% of adults in Portsmouth completed master's degree.
3.0% of adults in Portsmouth completed professional degree.
3.0% of adults in Portsmouth completed doctorate degree.
| Education | Portsmouth | NH | USA |
|---|---|---|---|
| < 9th Grade | 1.0% | 2.0% | 4.0% |
| 9-12th Grade | 2.0% | 4.0% | 6.0% |
| High School / GED | 16.0% | 27.0% | 26.0% |
| Some College | 12.0% | 17.0% | 19.0% |
| Associate's Degree | 5.0% | 10.0% | 9.0% |
| Bachelor's Degree | 41.0% | 24.0% | 22.0% |
| Master's Degree | 17.0% | 12.0% | 10.0% |
| Professional Degree | 3.0% | 2.0% | 2.0% |
| Doctorate Degree | 3.0% | 2.0% | 2.0% |
Household Income For Portsmouth, New Hampshire
See the full breakdown
4.2% of households in Portsmouth earn Less than $10,000.
2.3% of households in Portsmouth earn $10,000 to $14,999.
5.6% of households in Portsmouth earn $15,000 to $24,999.
4.2% of households in Portsmouth earn $25,000 to $34,999.
6.5% of households in Portsmouth earn $35,000 to $49,999.
12.8% of households in Portsmouth earn $50,000 to $74,999.
11.9% of households in Portsmouth earn $75,000 to $99,999.
22.9% of households in Portsmouth earn $100,000 to $149,999.
8.6% of households in Portsmouth earn $150,000 to $199,999.
21.1% of households in Portsmouth earn $200,000 or more.
| Income | Portsmouth | NH | USA |
|---|---|---|---|
| Less than $10,000 | 4.2% | 3.2% | 5.0% |
| $10,000 to $14,999 | 2.3% | 2.3% | 3.4% |
| $15,000 to $24,999 | 5.6% | 4.9% | 6.3% |
| $25,000 to $34,999 | 4.2% | 5.3% | 6.6% |
| $35,000 to $49,999 | 6.5% | 8.1% | 10.1% |
| $50,000 to $74,999 | 12.8% | 14.3% | 15.5% |
| $75,000 to $99,999 | 11.9% | 12.4% | 12.6% |
| $100,000 to $149,999 | 22.9% | 20.0% | 17.5% |
| $150,000 to $199,999 | 8.6% | 12.7% | 9.6% |
| $200,000 or more | 21.1% | 16.8% | 13.4% |
Source: U.S. Census ACS 5-year estimates (2024)


