Compare Providence to…
Providence SnackAbility
Overall SnackAbility
Crime in Providence summary. We use data from the FBI to determine the crime rates in Providence. Key points include:
There were 3,747 total crimes in Providence in the last reporting year.
The overall crime rate per 100,000 people in Providence is 1,934.6 / 100k people.
The violent crime rate per 100,000 people in Providence is 276.7 / 100k people.
The property crime rate per 100,000 people in Providence is 1,657.9 / 100k people.
Overall, crime in Providence is -8.71% below the national average.
Total Crimes
Below National Average
Crime In Providence Comparison Table
| Statistic | Count Raw |
Providence / 100k People |
Rhode Island / 100k People |
National / 100k People |
|---|---|---|---|---|
| Total Crimes Per 100K | 3,747 | 1,934.6 | 1,185.9 | 2,119.2 |
| Violent Crime | 536 | 276.7 | 153.6 | 359.0 |
| Murder | 12 | 6.2 | 2.1 | 5.0 |
| Robbery | 108 | 55.8 | 22.2 | 61.0 |
| Aggravated Assault | 376 | 194.1 | 99.8 | 256.0 |
| Property Crime | 3,211 | 1,657.9 | 1,032.4 | 1,760.0 |
| Burglary | 227 | 117.2 | 91.0 | 229.0 |
| Larceny | 2,576 | 1,330.0 | 820.5 | 1,272.0 |
| Car Theft | 408 | 210.7 | 120.9 | 259.0 |
Source: FBI Uniform Crime Reporting (2024)
Cost of living in Providence summary. We use data on the cost of living to determine how expensive it is to live in Providence. Real estate prices drive most of the variance in cost of living around Rhode Island. Key points include:
The cost of living in Providence is 111 with 100 being average.
The cost of living in Providence is 1.1x higher than the national average.
The median home value in Providence is $426,006.
The median income in Providence is $68,119.
Providence's Overall Cost Of Living
Higher Than The National Average
Cost Of Living In Providence Comparison Table
| Living Expense | Providence | Rhode Island | National Average |
|---|---|---|---|
| Overall | 111 | 112 | 100 |
| Services | 101 | 104 | 100 |
| Groceries | 103 | 102 | 100 |
| Health | 118 | 125 | 100 |
| Housing | 106 | 106 | 100 |
| Transportation | 104 | 107 | 100 |
| Utilities | 109 | 108 | 100 |
Source: Cost of living index, normalized to US average = 100
Providence, RI Weather
The average high in Providence is 59.9° and the average low is 42.4°.
There are 78.3 days of precipitation each year.
Expect an average of 48.8 inches of precipitation each year with 35.7 inches of snow.
| Stat | Providence |
|---|---|
| Average Annual High | 59.9 |
| Average Annual Low | 42.4 |
| Annual Precipitation Days | 78.3 |
| Average Annual Precipitation | 48.8 |
| Average Annual Snowfall | 35.7 |
Average High
Days of Rain
Source: NOAA climate normals (30-year)
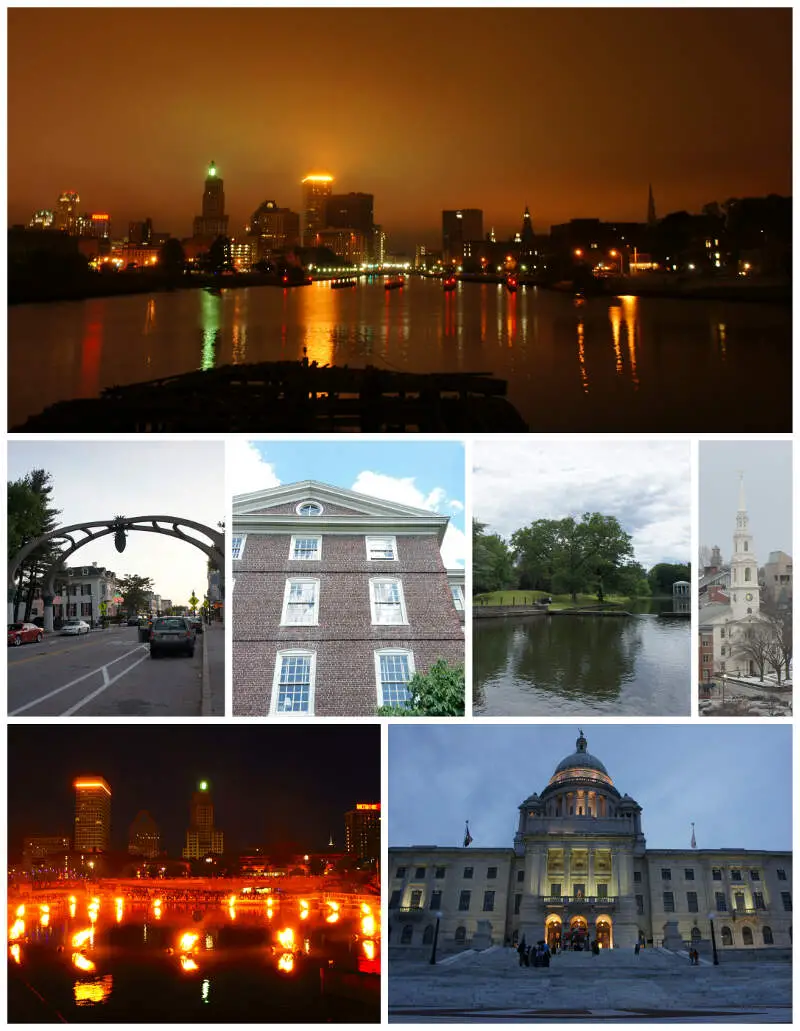
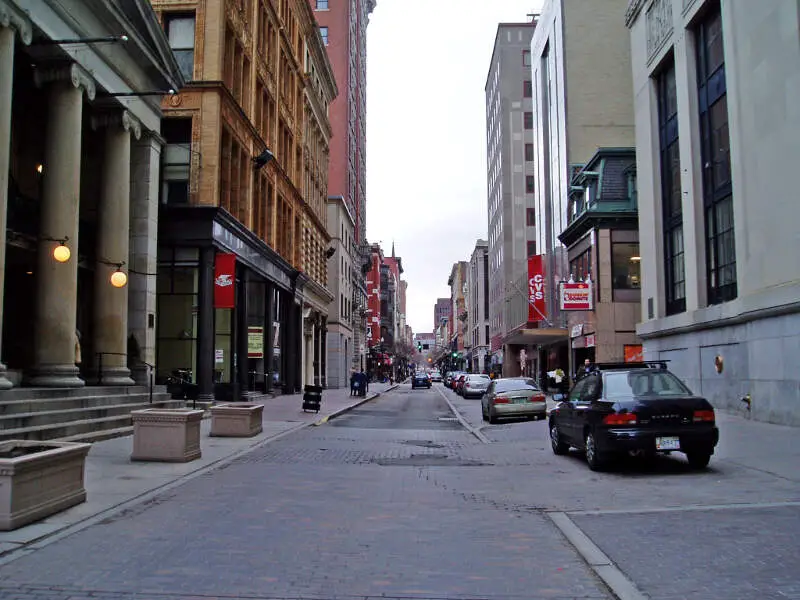
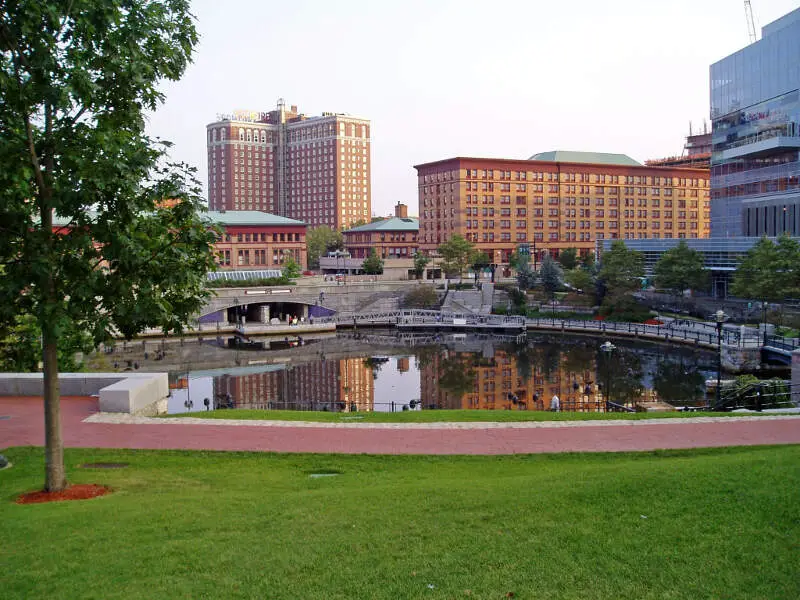
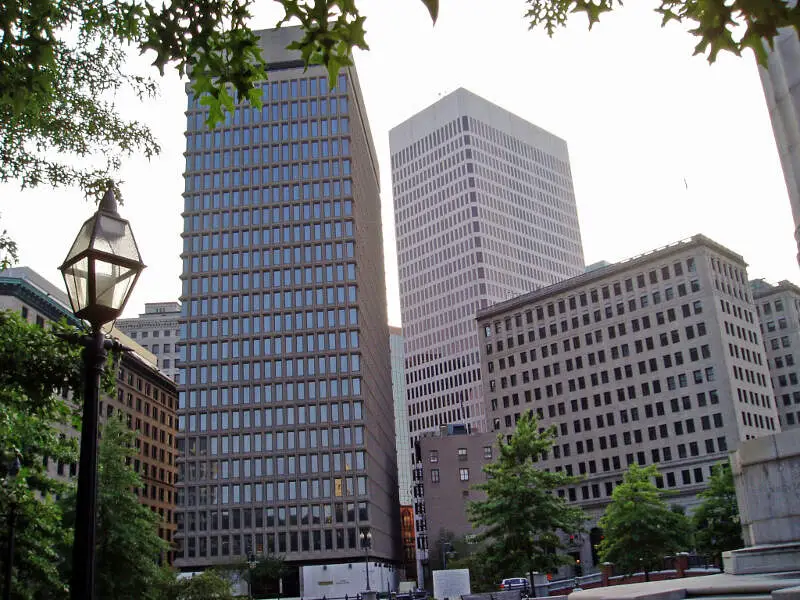
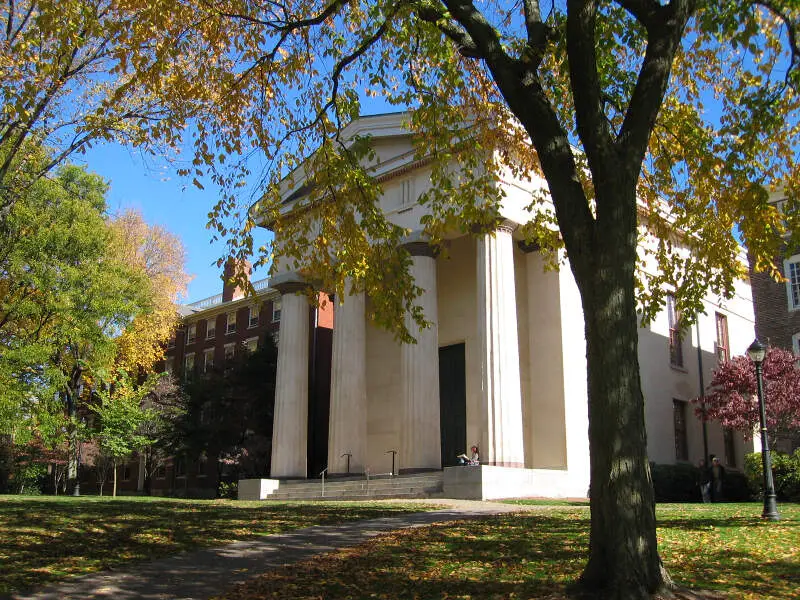
Providence, RI Photos


Rankings & Articles For Providence


Locations Around Providence
Map Of Providence, RI
Best Places Around Providence
Foxborough, MA
Population 6,251
Mansfield Center, MA
Population 7,222
Somerset, MA
Population 18,298
Pascoag, RI
Population 4,410
Woonsocket, RI
Population 43,521
Central Falls, RI
Population 22,701
Pawtucket, RI
Population 75,893
Providence Demographics And Statistics
Population over time in Providence
The current population in Providence is 191,767. The population has increased 7.6% from 2010.
| Year | Population | % Change |
|---|---|---|
| 2024 | 191,767 | 0.8% |
| 2023 | 190,214 | 0.3% |
| 2022 | 189,715 | 0.5% |
| 2021 | 188,812 | 5.2% |
| 2020 | 179,472 | -0.0% |
| 2019 | 179,494 | 0.0% |
| 2018 | 179,435 | -0.0% |
| 2017 | 179,509 | 0.4% |
| 2016 | 178,851 | 0.1% |
| 2015 | 178,680 | 0.1% |
| 2014 | 178,562 | 0.3% |
| 2013 | 178,056 | -0.1% |
| 2012 | 178,185 | 0.0% |
| 2011 | 178,130 | -0.1% |
| 2010 | 178,286 | - |
Race / Ethnicity in Providence
See the full breakdown
Providence is:
33.1% White with 63,482 White residents.
10.2% African American with 19,632 African American residents.
0.3% American Indian with 526 American Indian residents.
6.2% Asian with 11,856 Asian residents.
0.1% Hawaiian with 163 Hawaiian residents.
1.2% Other with 2,323 Other residents.
3.6% Two Or More with 6,950 Two Or More residents.
45.3% Hispanic with 86,835 Hispanic residents.
| Race | Providence | RI | USA |
|---|---|---|---|
| White | 33.1% | 68.0% | 57.4% |
| African American | 10.2% | 4.9% | 11.9% |
| American Indian | 0.3% | 0.1% | 0.5% |
| Asian | 6.2% | 3.5% | 5.9% |
| Hawaiian | 0.1% | 0.1% | 0.2% |
| Other | 1.2% | 0.8% | 0.6% |
| Two Or More | 3.6% | 4.9% | 4.3% |
| Hispanic | 45.3% | 17.7% | 19.3% |
Gender in Providence
See the full breakdown
Providence is 50.9% female with 97,586 female residents.
Providence is 49.1% male with 94,180 male residents.
| Gender | Providence | RI | USA |
|---|---|---|---|
| Female | 50.9% | 50.9% | 50.5% |
| Male | 49.1% | 49.1% | 49.5% |
Highest level of educational attainment in Providence for adults over 25
See the full breakdown
10.0% of adults in Providence completed < 9th grade.
8.0% of adults in Providence completed 9-12th grade.
28.0% of adults in Providence completed high school / ged.
15.0% of adults in Providence completed some college.
5.0% of adults in Providence completed associate's degree.
18.0% of adults in Providence completed bachelor's degree.
10.0% of adults in Providence completed master's degree.
3.0% of adults in Providence completed professional degree.
3.0% of adults in Providence completed doctorate degree.
| Education | Providence | RI | USA |
|---|---|---|---|
| < 9th Grade | 10.0% | 4.0% | 4.0% |
| 9-12th Grade | 8.0% | 6.0% | 6.0% |
| High School / GED | 28.0% | 27.0% | 26.0% |
| Some College | 15.0% | 17.0% | 19.0% |
| Associate's Degree | 5.0% | 8.0% | 9.0% |
| Bachelor's Degree | 18.0% | 22.0% | 22.0% |
| Master's Degree | 10.0% | 11.0% | 10.0% |
| Professional Degree | 3.0% | 3.0% | 2.0% |
| Doctorate Degree | 3.0% | 2.0% | 2.0% |
Household Income For Providence, Rhode Island
See the full breakdown
7.7% of households in Providence earn Less than $10,000.
6.9% of households in Providence earn $10,000 to $14,999.
7.6% of households in Providence earn $15,000 to $24,999.
5.9% of households in Providence earn $25,000 to $34,999.
10.2% of households in Providence earn $35,000 to $49,999.
16.6% of households in Providence earn $50,000 to $74,999.
13.0% of households in Providence earn $75,000 to $99,999.
14.2% of households in Providence earn $100,000 to $149,999.
8.2% of households in Providence earn $150,000 to $199,999.
9.8% of households in Providence earn $200,000 or more.
| Income | Providence | RI | USA |
|---|---|---|---|
| Less than $10,000 | 7.7% | 4.6% | 5.0% |
| $10,000 to $14,999 | 6.9% | 4.1% | 3.4% |
| $15,000 to $24,999 | 7.6% | 6.1% | 6.3% |
| $25,000 to $34,999 | 5.9% | 5.7% | 6.6% |
| $35,000 to $49,999 | 10.2% | 8.4% | 10.1% |
| $50,000 to $74,999 | 16.6% | 14.5% | 15.5% |
| $75,000 to $99,999 | 13.0% | 12.5% | 12.6% |
| $100,000 to $149,999 | 14.2% | 19.1% | 17.5% |
| $150,000 to $199,999 | 8.2% | 11.1% | 9.6% |
| $200,000 or more | 9.8% | 13.8% | 13.4% |
Source: U.S. Census ACS 5-year estimates (2024)


