Westerly SnackAbility
Overall SnackAbility
Crime in Westerly summary. We use data from the FBI to determine the crime rates in Westerly. Key points include:
There were 230 total crimes in Westerly in the last reporting year.
The overall crime rate per 100,000 people in Westerly is 977.1 / 100k people.
The violent crime rate per 100,000 people in Westerly is 63.7 / 100k people.
The property crime rate per 100,000 people in Westerly is 913.3 / 100k people.
Overall, crime in Westerly is -53.90% below the national average.
Total Crimes
Below National Average
Crime In Westerly Comparison Table
| Statistic | Count Raw |
Westerly / 100k People |
Rhode Island / 100k People |
National / 100k People |
|---|---|---|---|---|
| Total Crimes Per 100K | 230 | 977.1 | 1,185.9 | 2,119.2 |
| Violent Crime | 15 | 63.7 | 153.6 | 359.0 |
| Murder | 0 | 0.0 | 2.1 | 5.0 |
| Robbery | 0 | 0.0 | 22.2 | 61.0 |
| Aggravated Assault | 12 | 51.0 | 99.8 | 256.0 |
| Property Crime | 215 | 913.3 | 1,032.4 | 1,760.0 |
| Burglary | 12 | 51.0 | 91.0 | 229.0 |
| Larceny | 181 | 768.9 | 820.5 | 1,272.0 |
| Car Theft | 22 | 93.5 | 120.9 | 259.0 |
Source: FBI Uniform Crime Reporting (2024)
Cost of living in Westerly summary. We use data on the cost of living to determine how expensive it is to live in Westerly. Real estate prices drive most of the variance in cost of living around Rhode Island. Key points include:
The cost of living in Westerly is 119 with 100 being average.
The cost of living in Westerly is 1.2x higher than the national average.
The median home value in Westerly is $623,538.
The median income in Westerly is $95,207.
Westerly's Overall Cost Of Living
Higher Than The National Average
Cost Of Living In Westerly Comparison Table
| Living Expense | Westerly | Rhode Island | National Average |
|---|---|---|---|
| Overall | 119 | 112 | 100 |
| Services | 108 | 104 | 100 |
| Groceries | 107 | 102 | 100 |
| Health | 150 | 125 | 100 |
| Housing | 103 | 106 | 100 |
| Transportation | 108 | 107 | 100 |
| Utilities | 109 | 108 | 100 |
Source: Cost of living index, normalized to US average = 100
Westerly, RI Weather
The average high in Westerly is None° and the average low is None°.
There are None days of precipitation each year.
Expect an average of None inches of precipitation each year with None inches of snow.
| Stat | Westerly |
|---|---|
| Average Annual High | None |
| Average Annual Low | None |
| Annual Precipitation Days | None |
| Average Annual Precipitation | None |
| Average Annual Snowfall | None |
Average High
Days of Rain
Source: NOAA climate normals (30-year)
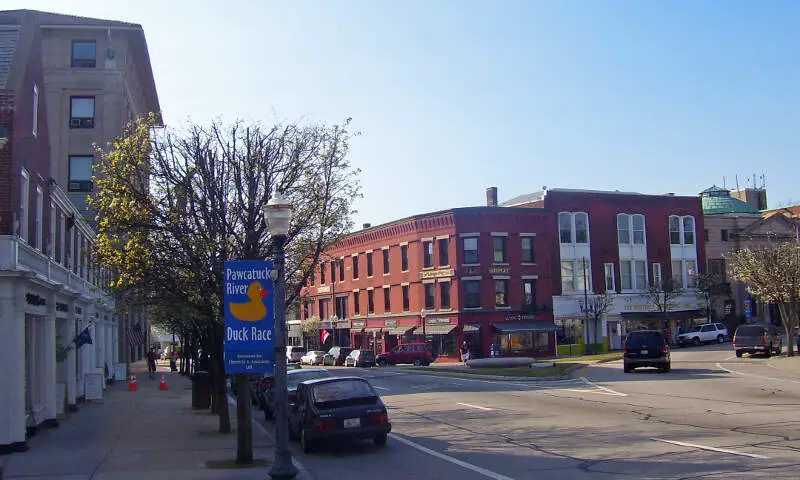
Westerly, RI Photos
1 Reviews & Comments About Westerly

I am proud to be from Westerly, which I consider a metropolitan town.
Rankings & Articles For Westerly


Locations Around Westerly
Map Of Westerly, RI
Best Places Around Westerly
Groton, CT
Population 9,490
Westerly Demographics And Statistics
Population over time in Westerly
The current population in Westerly is 18,411. The population has increased 4.9% from 2010.
| Year | Population | % Change |
|---|---|---|
| 2024 | 18,411 | -0.6% |
| 2023 | 18,528 | 1.4% |
| 2022 | 18,272 | 0.2% |
| 2021 | 18,241 | 2.2% |
| 2020 | 17,842 | 1.6% |
| 2019 | 17,553 | 0.7% |
| 2018 | 17,435 | 0.6% |
| 2017 | 17,323 | -1.8% |
| 2016 | 17,632 | -1.8% |
| 2015 | 17,957 | -0.2% |
| 2014 | 17,984 | 0.4% |
| 2013 | 17,908 | 1.1% |
| 2012 | 17,712 | 0.2% |
| 2011 | 17,675 | 0.7% |
| 2010 | 17,552 | - |
Race / Ethnicity in Westerly
See the full breakdown
Westerly is:
88.2% White with 16,236 White residents.
0.6% African American with 117 African American residents.
0.0% American Indian with 3 American Indian residents.
3.1% Asian with 571 Asian residents.
0.0% Hawaiian with 0 Hawaiian residents.
0.8% Other with 153 Other residents.
4.0% Two Or More with 730 Two Or More residents.
3.3% Hispanic with 601 Hispanic residents.
| Race | Westerly | RI | USA |
|---|---|---|---|
| White | 88.2% | 68.0% | 57.4% |
| African American | 0.6% | 4.9% | 11.9% |
| American Indian | 0.0% | 0.1% | 0.5% |
| Asian | 3.1% | 3.5% | 5.9% |
| Hawaiian | 0.0% | 0.1% | 0.2% |
| Other | 0.8% | 0.8% | 0.6% |
| Two Or More | 4.0% | 4.9% | 4.3% |
| Hispanic | 3.3% | 17.7% | 19.3% |
Gender in Westerly
See the full breakdown
Westerly is 48.3% female with 8,892 female residents.
Westerly is 51.7% male with 9,519 male residents.
| Gender | Westerly | RI | USA |
|---|---|---|---|
| Female | 48.3% | 50.9% | 50.5% |
| Male | 51.7% | 49.1% | 49.5% |
Highest level of educational attainment in Westerly for adults over 25
See the full breakdown
1.0% of adults in Westerly completed < 9th grade.
4.0% of adults in Westerly completed 9-12th grade.
29.0% of adults in Westerly completed high school / ged.
15.0% of adults in Westerly completed some college.
7.0% of adults in Westerly completed associate's degree.
25.0% of adults in Westerly completed bachelor's degree.
15.0% of adults in Westerly completed master's degree.
2.0% of adults in Westerly completed professional degree.
2.0% of adults in Westerly completed doctorate degree.
| Education | Westerly | RI | USA |
|---|---|---|---|
| < 9th Grade | 1.0% | 4.0% | 4.0% |
| 9-12th Grade | 4.0% | 6.0% | 6.0% |
| High School / GED | 29.0% | 27.0% | 26.0% |
| Some College | 15.0% | 17.0% | 19.0% |
| Associate's Degree | 7.0% | 8.0% | 9.0% |
| Bachelor's Degree | 25.0% | 22.0% | 22.0% |
| Master's Degree | 15.0% | 11.0% | 10.0% |
| Professional Degree | 2.0% | 3.0% | 2.0% |
| Doctorate Degree | 2.0% | 2.0% | 2.0% |
Household Income For Westerly, Rhode Island
See the full breakdown
3.8% of households in Westerly earn Less than $10,000.
3.0% of households in Westerly earn $10,000 to $14,999.
4.6% of households in Westerly earn $15,000 to $24,999.
5.2% of households in Westerly earn $25,000 to $34,999.
5.6% of households in Westerly earn $35,000 to $49,999.
15.3% of households in Westerly earn $50,000 to $74,999.
17.2% of households in Westerly earn $75,000 to $99,999.
19.5% of households in Westerly earn $100,000 to $149,999.
8.6% of households in Westerly earn $150,000 to $199,999.
17.3% of households in Westerly earn $200,000 or more.
| Income | Westerly | RI | USA |
|---|---|---|---|
| Less than $10,000 | 3.8% | 4.6% | 5.0% |
| $10,000 to $14,999 | 3.0% | 4.1% | 3.4% |
| $15,000 to $24,999 | 4.6% | 6.1% | 6.3% |
| $25,000 to $34,999 | 5.2% | 5.7% | 6.6% |
| $35,000 to $49,999 | 5.6% | 8.4% | 10.1% |
| $50,000 to $74,999 | 15.3% | 14.5% | 15.5% |
| $75,000 to $99,999 | 17.2% | 12.5% | 12.6% |
| $100,000 to $149,999 | 19.5% | 19.1% | 17.5% |
| $150,000 to $199,999 | 8.6% | 11.1% | 9.6% |
| $200,000 or more | 17.3% | 13.8% | 13.4% |
Source: U.S. Census ACS 5-year estimates (2024)


