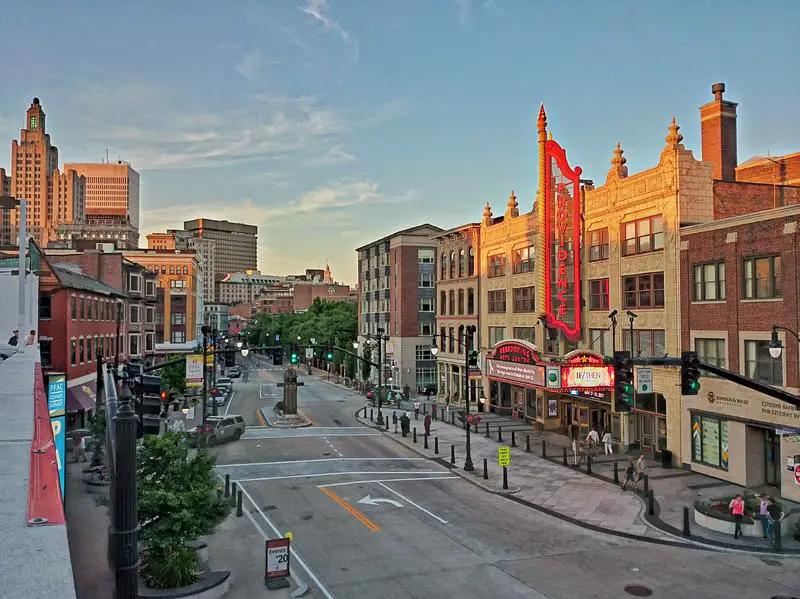
Every city has safe neighborhoods and dangerous neighborhhods. We believe you should know which neighborhoods in Providence are the safest before you move.
Every year, more than 30 million Americans move. Sometimes, its for a job, other times its to escape the big city. But no matter where you move, you want a neighborhood thats family friendly, clean, and most importantly, safe.
Weve analyzed the FBI crime reports data on violent and property crimes for every single neighborhood in Providence. Then, we calculated your chances of being the victim of a crime in each one.
What Providence neighborhoods can you leave your doors unlocked at night? Heres the list.
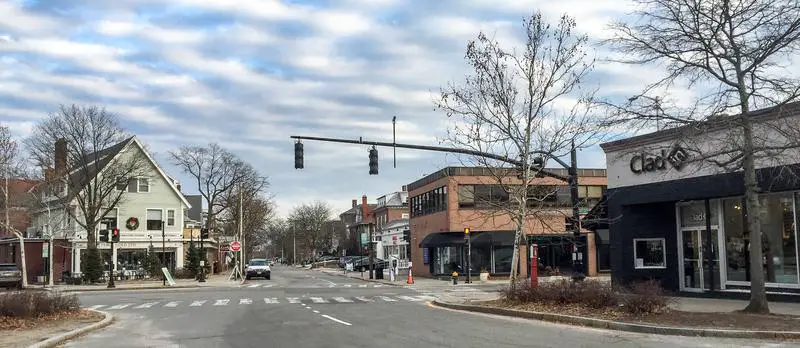
Which neighborhood is the safest in Providence in 2025? That would be Mount Pleasant. Thats according to the most recent FBI crime data, which takes into account everything from thefts and robberies to assaults and murders.
If you dont see a neighborhood youre looking for in our top , scroll down to the bottom, where we have all Providence neighborhoods listed in order from safest to most dangerous.
For more Rhode Island reading, check out:
- Safest Cities To Live In America
- Safest States To Live In America
- Worst neighborhoods in Providence
- Best neighborhoods to live in Providence.
Table Of Contents: Top 10 | Methodology | Summary | Table
The 10 Safest Neighborhoods To Live In Providence For 2025
/10
Population: 11,438
Violent Crimes Per 100k: 261
Property Crime Per 100k: 1,301
/10
Population: 10,551
Violent Crimes Per 100k: 221
Property Crime Per 100k: 1,544
/10
Population: 3,252
Violent Crimes Per 100k: 24
Property Crime Per 100k: 1,568
/10
Population: 11,958
Violent Crimes Per 100k: 332
Property Crime Per 100k: 1,410

/10
Population: 6,526
Violent Crimes Per 100k: 72
Property Crime Per 100k: 1,212
/10
Population: 2,444
Violent Crimes Per 100k: 281
Property Crime Per 100k: 1,661
/10
Population: 4,377
Violent Crimes Per 100k: 1,143
Property Crime Per 100k: 9,545
/10
Population: 8,697
Violent Crimes Per 100k: 77
Property Crime Per 100k: 1,298
/10
Population: 10,675
Violent Crimes Per 100k: 298
Property Crime Per 100k: 1,789
/10
Population: 3,175
Violent Crimes Per 100k: 192
Property Crime Per 100k: 2,081
Methodology: How We Determined The Safest Providence Hoods In 2025
You can ask people which neighborhoods are the safest, or you can look at the unbiased raw data. We choose data.
Instead of relying on speculation and opinion, we used Saturday Night Science to analyze the numbers from the FBI’s most recent crime report for every neighborhood in Providence.
To be more specific, we analyzed the FBI’s Uniform Crime Report. We then ran an analysis to calculate each neighborhood’s property and violent crimes per capita. We used the following criteria:
- Total Crimes Per Capita
- Violent Crimes Per Capita
- Property Crimes Per Capita
We then ranked each neighborhood with scores from 1 to 23 in each category, where 1 was the safest.
Next, we averaged the rankings for each neighborhood to create a safe neighborhood index.
Finally, we crowned the neighborhood with the lowest safest neighborhood index the “Safest City Neighborhood In Providence.” We’re lookin’ at you, Mount Pleasant.
We updated this article for 2025. This is our fourth time ranking the safest neighborhoods in Providence.
Skip to the end to see the list of all the neighborhoods in the city, from safest to most expensive.
Summary: The Safest Places In Providence
Looking at the data, you can tell that Mount Pleasant is as safe as they come, according to science and data.
The safest neighborhoods in Providence are Mount Pleasant, Elmhurst, Wayland, Silverlake, Blackstone, Reservoir, Downtown, College Hill, Elmwood, and Hope.
But as most Rhode Island residents would agree, almost every place here has its safe and not safe parts. So make sure you’re informed ahead of time.
The most dangerous neighborhoods in Providence are Olneyville, Federal Hill, Smith Hill, Charles, and Fox Point.
We ranked the neighborhoods from safest to most dangerous in the chart below.
For more Rhode Island reading, check out:
- Best Places To Live In Rhode Island
- Cheapest Places To Live In Rhode Island
- Most Dangerous Cities In Rhode Island
- Richest Cities In Rhode Island
- Safest Places In Rhode Island
- Worst Places To Live In Rhode Island
Detailed List Of The Safest Neighborhoods To Live In Providence For 2025
| Rank | Neighborhood | Crime Per 100K |
|---|---|---|
| 1 | Mount Pleasant | 1,562 |
| 2 | Elmhurst | 1,765 |
| 3 | Wayland | 1,592 |
| 4 | Silverlake | 1,742 |
| 5 | Blackstone | 1,284 |
| 6 | Reservoir | 1,942 |
| 7 | Downtown | 10,688 |
| 8 | College Hill | 1,375 |
| 9 | Elmwood | 2,087 |
| 10 | Hope | 2,273 |
| 11 | Lower South Providence | 2,185 |
| 12 | Mount Hope | 2,351 |
| 13 | Hartford | 2,093 |
| 14 | West End | 2,292 |
| 15 | Wanskuck | 2,332 |
| 16 | Valley | 2,859 |
| 17 | Washington Park | 2,512 |
| 18 | South Elmwood | 991 |
| 19 | Fox Point | 4,071 |
| 20 | Charles | 3,384 |
| 21 | Smith Hill | 3,126 |
| 22 | Federal Hill | 4,294 |
| 23 | Olneyville | 3,824 |