Mitchell SnackAbility
Overall SnackAbility
Crime in Mitchell summary. We use data from the FBI to determine the crime rates in Mitchell. Key points include:
There were 348 total crimes in Mitchell in the last reporting year.
The overall crime rate per 100,000 people in Mitchell is 2,229.8 / 100k people.
The violent crime rate per 100,000 people in Mitchell is 262.7 / 100k people.
The property crime rate per 100,000 people in Mitchell is 1,967.1 / 100k people.
Overall, crime in Mitchell is 5.22% above the national average.
Total Crimes
Above National Average
Crime In Mitchell Comparison Table
| Statistic | Count Raw |
Mitchell / 100k People |
South Dakota / 100k People |
National / 100k People |
|---|---|---|---|---|
| Total Crimes Per 100K | 348 | 2,229.8 | 1,948.3 | 2,119.2 |
| Violent Crime | 41 | 262.7 | 362.3 | 359.0 |
| Murder | 1 | 6.4 | 4.7 | 5.0 |
| Robbery | 3 | 19.2 | 22.6 | 61.0 |
| Aggravated Assault | 31 | 198.6 | 283.6 | 256.0 |
| Property Crime | 307 | 1,967.1 | 1,586.0 | 1,760.0 |
| Burglary | 26 | 166.6 | 194.7 | 229.0 |
| Larceny | 249 | 1,595.4 | 1,195.5 | 1,272.0 |
| Car Theft | 32 | 205.0 | 195.9 | 259.0 |
Source: FBI Uniform Crime Reporting (2024)
Cost of living in Mitchell summary. We use data on the cost of living to determine how expensive it is to live in Mitchell. Real estate prices drive most of the variance in cost of living around South Dakota. Key points include:
The cost of living in Mitchell is 93 with 100 being average.
The cost of living in Mitchell is 0.9x lower than the national average.
The median home value in Mitchell is $247,682.
The median income in Mitchell is $58,620.
Mitchell's Overall Cost Of Living
Lower Than The National Average
Cost Of Living In Mitchell Comparison Table
| Living Expense | Mitchell | South Dakota | National Average |
|---|---|---|---|
| Overall | 93 | 91 | 100 |
| Services | 96 | 98 | 100 |
| Groceries | 96 | 97 | 100 |
| Health | 81 | 77 | 100 |
| Housing | 95 | 98 | 100 |
| Transportation | 103 | 102 | 100 |
| Utilities | 91 | 93 | 100 |
Source: Cost of living index, normalized to US average = 100
Mitchell, SD Weather
The average high in Mitchell is 58.4° and the average low is 36.0°.
There are 46.7 days of precipitation each year.
Expect an average of 24.8 inches of precipitation each year with 34.0 inches of snow.
| Stat | Mitchell |
|---|---|
| Average Annual High | 58.4 |
| Average Annual Low | 36.0 |
| Annual Precipitation Days | 46.7 |
| Average Annual Precipitation | 24.8 |
| Average Annual Snowfall | 34.0 |
Average High
Days of Rain
Source: NOAA climate normals (30-year)
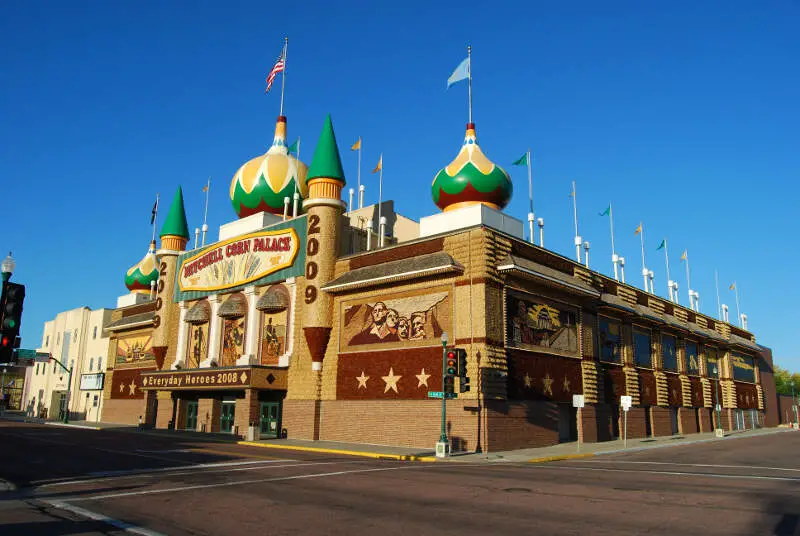
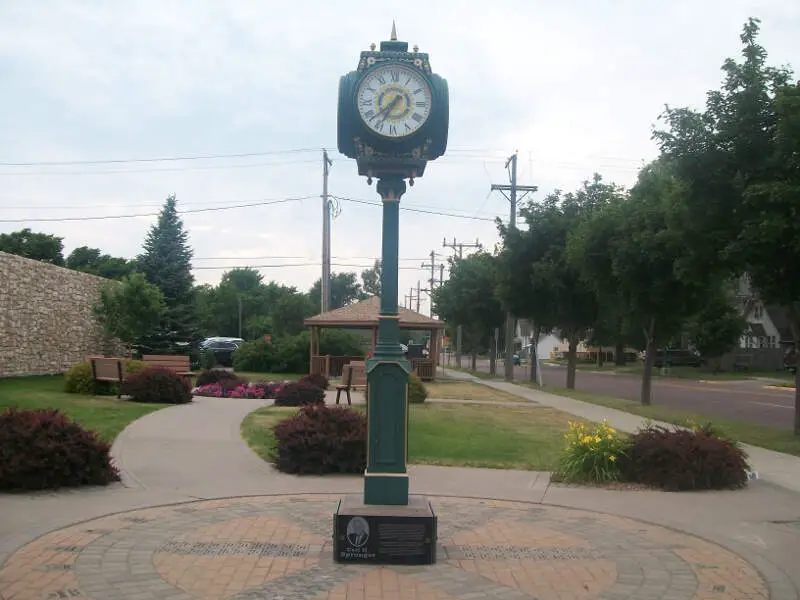
Mitchell, SD Photos
1 Reviews & Comments About Mitchell

Crimes aren't quietly heard of here, if so mostly drugs, c*****e, m**h, marijuana, etc. Schools are great here, teachers very respectful and discipline well. Neighborhoods usually quiet and quite peaceful.
Twin Dragon Chinese, Bike Trail, Pump Track.
Rankings & Articles For Mitchell


Locations Around Mitchell
Map Of Mitchell, SD
Mitchell Demographics And Statistics
Population over time in Mitchell
The current population in Mitchell is 15,649. The population has increased 3.2% from 2010.
| Year | Population | % Change |
|---|---|---|
| 2024 | 15,649 | 0.1% |
| 2023 | 15,637 | -0.1% |
| 2022 | 15,656 | -0.1% |
| 2021 | 15,677 | 0.5% |
| 2020 | 15,599 | -0.8% |
| 2019 | 15,727 | 0.0% |
| 2018 | 15,722 | 1.0% |
| 2017 | 15,566 | -0.3% |
| 2016 | 15,610 | 0.4% |
| 2015 | 15,543 | 0.3% |
| 2014 | 15,490 | 0.8% |
| 2013 | 15,367 | 0.7% |
| 2012 | 15,266 | 0.4% |
| 2011 | 15,205 | 0.3% |
| 2010 | 15,166 | - |
Race / Ethnicity in Mitchell
See the full breakdown
Mitchell is:
87.6% White with 13,711 White residents.
0.5% African American with 77 African American residents.
3.8% American Indian with 601 American Indian residents.
0.6% Asian with 99 Asian residents.
0.0% Hawaiian with 0 Hawaiian residents.
0.0% Other with 0 Other residents.
1.8% Two Or More with 280 Two Or More residents.
5.6% Hispanic with 881 Hispanic residents.
| Race | Mitchell | SD | USA |
|---|---|---|---|
| White | 87.6% | 79.8% | 57.4% |
| African American | 0.5% | 2.1% | 11.9% |
| American Indian | 3.8% | 7.1% | 0.5% |
| Asian | 0.6% | 1.4% | 5.9% |
| Hawaiian | 0.0% | 0.0% | 0.2% |
| Other | 0.0% | 0.3% | 0.6% |
| Two Or More | 1.8% | 4.4% | 4.3% |
| Hispanic | 5.6% | 4.8% | 19.3% |
Gender in Mitchell
See the full breakdown
Mitchell is 51.0% female with 7,974 female residents.
Mitchell is 49.0% male with 7,675 male residents.
| Gender | Mitchell | SD | USA |
|---|---|---|---|
| Female | 51.0% | 49.2% | 50.5% |
| Male | 49.0% | 50.8% | 49.5% |
Highest level of educational attainment in Mitchell for adults over 25
See the full breakdown
1.0% of adults in Mitchell completed < 9th grade.
5.0% of adults in Mitchell completed 9-12th grade.
33.0% of adults in Mitchell completed high school / ged.
22.0% of adults in Mitchell completed some college.
14.0% of adults in Mitchell completed associate's degree.
18.0% of adults in Mitchell completed bachelor's degree.
4.0% of adults in Mitchell completed master's degree.
2.0% of adults in Mitchell completed professional degree.
1.0% of adults in Mitchell completed doctorate degree.
| Education | Mitchell | SD | USA |
|---|---|---|---|
| < 9th Grade | 1.0% | 3.0% | 4.0% |
| 9-12th Grade | 5.0% | 4.0% | 6.0% |
| High School / GED | 33.0% | 29.0% | 26.0% |
| Some College | 22.0% | 20.0% | 19.0% |
| Associate's Degree | 14.0% | 12.0% | 9.0% |
| Bachelor's Degree | 18.0% | 22.0% | 22.0% |
| Master's Degree | 4.0% | 7.0% | 10.0% |
| Professional Degree | 2.0% | 2.0% | 2.0% |
| Doctorate Degree | 1.0% | 1.0% | 2.0% |
Household Income For Mitchell, South Dakota
See the full breakdown
3.2% of households in Mitchell earn Less than $10,000.
4.5% of households in Mitchell earn $10,000 to $14,999.
13.0% of households in Mitchell earn $15,000 to $24,999.
7.4% of households in Mitchell earn $25,000 to $34,999.
12.0% of households in Mitchell earn $35,000 to $49,999.
18.8% of households in Mitchell earn $50,000 to $74,999.
16.5% of households in Mitchell earn $75,000 to $99,999.
14.3% of households in Mitchell earn $100,000 to $149,999.
6.2% of households in Mitchell earn $150,000 to $199,999.
4.2% of households in Mitchell earn $200,000 or more.
| Income | Mitchell | SD | USA |
|---|---|---|---|
| Less than $10,000 | 3.2% | 4.2% | 5.0% |
| $10,000 to $14,999 | 4.5% | 3.2% | 3.4% |
| $15,000 to $24,999 | 13.0% | 6.7% | 6.3% |
| $25,000 to $34,999 | 7.4% | 7.0% | 6.6% |
| $35,000 to $49,999 | 12.0% | 11.5% | 10.1% |
| $50,000 to $74,999 | 18.8% | 17.4% | 15.5% |
| $75,000 to $99,999 | 16.5% | 14.6% | 12.6% |
| $100,000 to $149,999 | 14.3% | 18.9% | 17.5% |
| $150,000 to $199,999 | 6.2% | 8.5% | 9.6% |
| $200,000 or more | 4.2% | 8.1% | 13.4% |
Source: U.S. Census ACS 5-year estimates (2024)


