Rapid City SnackAbility
Overall SnackAbility
Crime in Rapid City summary. We use data from the FBI to determine the crime rates in Rapid City. Key points include:
There were 3,652 total crimes in Rapid City in the last reporting year.
The overall crime rate per 100,000 people in Rapid City is 4,511.0 / 100k people.
The violent crime rate per 100,000 people in Rapid City is 718.9 / 100k people.
The property crime rate per 100,000 people in Rapid City is 3,792.1 / 100k people.
Overall, crime in Rapid City is 112.86% above the national average.
Total Crimes
Above National Average
Crime In Rapid City Comparison Table
| Statistic | Count Raw |
Rapid City / 100k People |
South Dakota / 100k People |
National / 100k People |
|---|---|---|---|---|
| Total Crimes Per 100K | 3,652 | 4,511.0 | 1,948.3 | 2,119.2 |
| Violent Crime | 582 | 718.9 | 362.3 | 359.0 |
| Murder | 5 | 6.2 | 4.7 | 5.0 |
| Robbery | 84 | 103.8 | 22.6 | 61.0 |
| Aggravated Assault | 383 | 473.1 | 283.6 | 256.0 |
| Property Crime | 3,070 | 3,792.1 | 1,586.0 | 1,760.0 |
| Burglary | 346 | 427.4 | 194.7 | 229.0 |
| Larceny | 2,418 | 2,986.8 | 1,195.5 | 1,272.0 |
| Car Theft | 306 | 378.0 | 195.9 | 259.0 |
Source: FBI Uniform Crime Reporting (2024)
Cost of living in Rapid City summary. We use data on the cost of living to determine how expensive it is to live in Rapid City. Real estate prices drive most of the variance in cost of living around South Dakota. Key points include:
The cost of living in Rapid City is 99 with 100 being average.
The cost of living in Rapid City is 1.0x lower than the national average.
The median home value in Rapid City is $361,495.
The median income in Rapid City is $70,870.
Rapid City's Overall Cost Of Living
Lower Than The National Average
Cost Of Living In Rapid City Comparison Table
| Living Expense | Rapid City | South Dakota | National Average |
|---|---|---|---|
| Overall | 99 | 91 | 100 |
| Services | 101 | 98 | 100 |
| Groceries | 96 | 97 | 100 |
| Health | 102 | 77 | 100 |
| Housing | 99 | 98 | 100 |
| Transportation | 104 | 102 | 100 |
| Utilities | 95 | 93 | 100 |
Source: Cost of living index, normalized to US average = 100
Rapid City, SD Weather
The average high in Rapid City is 59.3° and the average low is 35.1°.
There are 42.3 days of precipitation each year.
Expect an average of 18.6 inches of precipitation each year with 42.3 inches of snow.
| Stat | Rapid City |
|---|---|
| Average Annual High | 59.3 |
| Average Annual Low | 35.1 |
| Annual Precipitation Days | 42.3 |
| Average Annual Precipitation | 18.6 |
| Average Annual Snowfall | 42.3 |
Average High
Days of Rain
Source: NOAA climate normals (30-year)
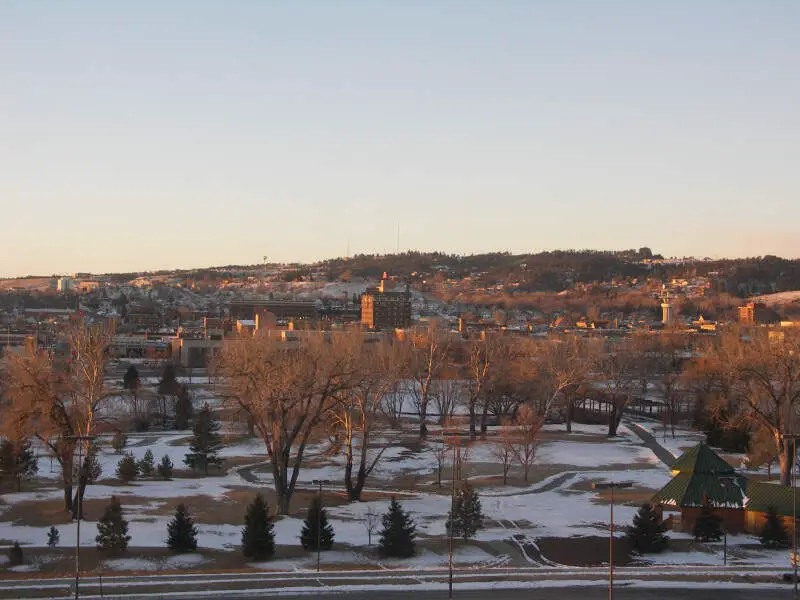
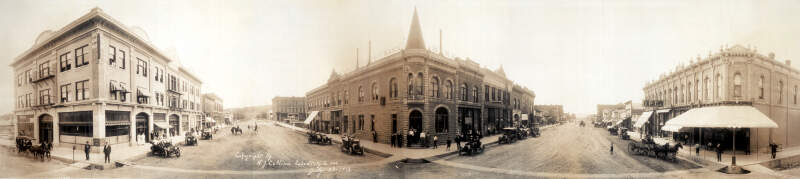
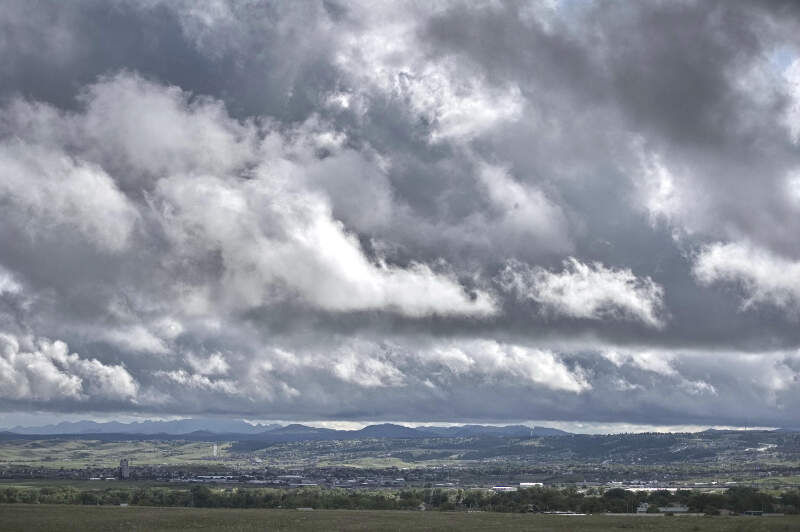
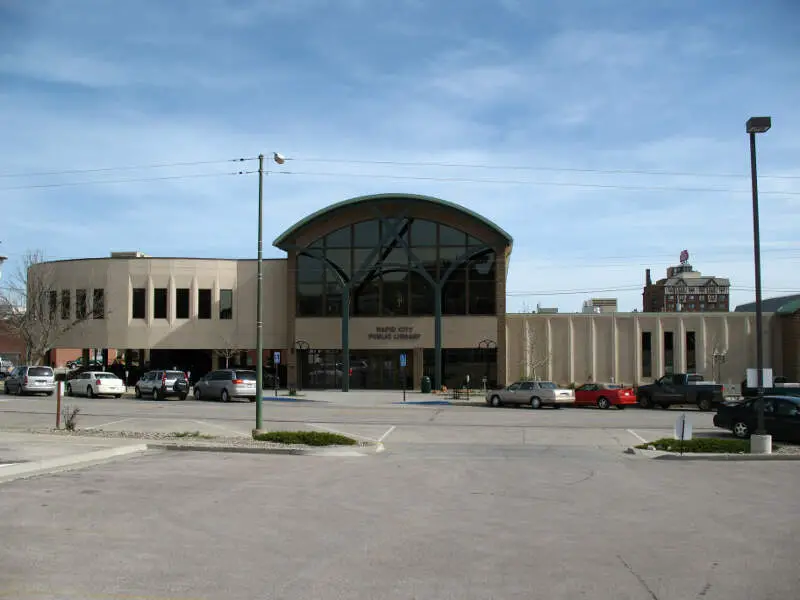
Rapid City, SD Photos
1 Reviews & Comments About Rapid City

Downtown is beautiful and there are plenty of things to do in the Black Hills. The schools are nice and the city is relatively safe. The scenery is absolutely beautiful.
Love the revamped downtown, hiking trails on 'M' hill and Dinosaur Park. Lots of things to do with kids. And when you really want to get out, just go out to the Black Hills or Badlands.
Rankings & Articles For Rapid City


Locations Around Rapid City
Map Of Rapid City, SD
Best Places Around Rapid City
Rapid City Demographics And Statistics
Population over time in Rapid City
The current population in Rapid City is 77,946. The population has increased 17.8% from 2010.
| Year | Population | % Change |
|---|---|---|
| 2024 | 77,946 | 1.4% |
| 2023 | 76,836 | 1.6% |
| 2022 | 75,632 | 2.3% |
| 2021 | 73,942 | -3.4% |
| 2020 | 76,541 | 1.7% |
| 2019 | 75,258 | 2.1% |
| 2018 | 73,721 | 1.2% |
| 2017 | 72,841 | 0.6% |
| 2016 | 72,441 | 1.0% |
| 2015 | 71,692 | 2.2% |
| 2014 | 70,126 | 1.6% |
| 2013 | 69,000 | 1.4% |
| 2012 | 68,060 | 1.3% |
| 2011 | 67,193 | 1.6% |
| 2010 | 66,144 | - |
Race / Ethnicity in Rapid City
See the full breakdown
Rapid City is:
76.3% White with 59,460 White residents.
1.2% African American with 955 African American residents.
7.1% American Indian with 5,496 American Indian residents.
1.3% Asian with 1,031 Asian residents.
0.0% Hawaiian with 20 Hawaiian residents.
0.6% Other with 478 Other residents.
7.4% Two Or More with 5,761 Two Or More residents.
6.1% Hispanic with 4,745 Hispanic residents.
| Race | Rapid City | SD | USA |
|---|---|---|---|
| White | 76.3% | 79.8% | 57.4% |
| African American | 1.2% | 2.1% | 11.9% |
| American Indian | 7.1% | 7.1% | 0.5% |
| Asian | 1.3% | 1.4% | 5.9% |
| Hawaiian | 0.0% | 0.0% | 0.2% |
| Other | 0.6% | 0.3% | 0.6% |
| Two Or More | 7.4% | 4.4% | 4.3% |
| Hispanic | 6.1% | 4.8% | 19.3% |
Gender in Rapid City
See the full breakdown
Rapid City is 49.1% female with 38,256 female residents.
Rapid City is 50.9% male with 39,689 male residents.
| Gender | Rapid City | SD | USA |
|---|---|---|---|
| Female | 49.1% | 49.2% | 50.5% |
| Male | 50.9% | 50.8% | 49.5% |
Highest level of educational attainment in Rapid City for adults over 25
See the full breakdown
3.0% of adults in Rapid City completed < 9th grade.
4.0% of adults in Rapid City completed 9-12th grade.
25.0% of adults in Rapid City completed high school / ged.
22.0% of adults in Rapid City completed some college.
10.0% of adults in Rapid City completed associate's degree.
23.0% of adults in Rapid City completed bachelor's degree.
8.0% of adults in Rapid City completed master's degree.
3.0% of adults in Rapid City completed professional degree.
2.0% of adults in Rapid City completed doctorate degree.
| Education | Rapid City | SD | USA |
|---|---|---|---|
| < 9th Grade | 3.0% | 3.0% | 4.0% |
| 9-12th Grade | 4.0% | 4.0% | 6.0% |
| High School / GED | 25.0% | 29.0% | 26.0% |
| Some College | 22.0% | 20.0% | 19.0% |
| Associate's Degree | 10.0% | 12.0% | 9.0% |
| Bachelor's Degree | 23.0% | 22.0% | 22.0% |
| Master's Degree | 8.0% | 7.0% | 10.0% |
| Professional Degree | 3.0% | 2.0% | 2.0% |
| Doctorate Degree | 2.0% | 1.0% | 2.0% |
Household Income For Rapid City, South Dakota
See the full breakdown
4.3% of households in Rapid City earn Less than $10,000.
4.2% of households in Rapid City earn $10,000 to $14,999.
7.1% of households in Rapid City earn $15,000 to $24,999.
7.6% of households in Rapid City earn $25,000 to $34,999.
11.2% of households in Rapid City earn $35,000 to $49,999.
18.0% of households in Rapid City earn $50,000 to $74,999.
15.1% of households in Rapid City earn $75,000 to $99,999.
17.2% of households in Rapid City earn $100,000 to $149,999.
6.6% of households in Rapid City earn $150,000 to $199,999.
8.6% of households in Rapid City earn $200,000 or more.
| Income | Rapid City | SD | USA |
|---|---|---|---|
| Less than $10,000 | 4.3% | 4.2% | 5.0% |
| $10,000 to $14,999 | 4.2% | 3.2% | 3.4% |
| $15,000 to $24,999 | 7.1% | 6.7% | 6.3% |
| $25,000 to $34,999 | 7.6% | 7.0% | 6.6% |
| $35,000 to $49,999 | 11.2% | 11.5% | 10.1% |
| $50,000 to $74,999 | 18.0% | 17.4% | 15.5% |
| $75,000 to $99,999 | 15.1% | 14.6% | 12.6% |
| $100,000 to $149,999 | 17.2% | 18.9% | 17.5% |
| $150,000 to $199,999 | 6.6% | 8.5% | 9.6% |
| $200,000 or more | 8.6% | 8.1% | 13.4% |
Source: U.S. Census ACS 5-year estimates (2024)


