Sioux Falls SnackAbility
Overall SnackAbility
Crime in Sioux Falls summary. We use data from the FBI to determine the crime rates in Sioux Falls. Key points include:
There were 7,260 total crimes in Sioux Falls in the last reporting year.
The overall crime rate per 100,000 people in Sioux Falls is 3,442.0 / 100k people.
The violent crime rate per 100,000 people in Sioux Falls is 526.7 / 100k people.
The property crime rate per 100,000 people in Sioux Falls is 2,915.2 / 100k people.
Overall, crime in Sioux Falls is 62.42% above the national average.
Total Crimes
Above National Average
Crime In Sioux Falls Comparison Table
| Statistic | Count Raw |
Sioux Falls / 100k People |
South Dakota / 100k People |
National / 100k People |
|---|---|---|---|---|
| Total Crimes Per 100K | 7,260 | 3,442.0 | 1,948.3 | 2,119.2 |
| Violent Crime | 1,111 | 526.7 | 362.3 | 359.0 |
| Murder | 14 | 6.6 | 4.7 | 5.0 |
| Robbery | 100 | 47.4 | 22.6 | 61.0 |
| Aggravated Assault | 938 | 444.7 | 283.6 | 256.0 |
| Property Crime | 6,149 | 2,915.2 | 1,586.0 | 1,760.0 |
| Burglary | 639 | 302.9 | 194.7 | 229.0 |
| Larceny | 4,587 | 2,174.7 | 1,195.5 | 1,272.0 |
| Car Theft | 923 | 437.6 | 195.9 | 259.0 |
Source: FBI Uniform Crime Reporting (2024)
Cost of living in Sioux Falls summary. We use data on the cost of living to determine how expensive it is to live in Sioux Falls. Real estate prices drive most of the variance in cost of living around South Dakota. Key points include:
The cost of living in Sioux Falls is 99 with 100 being average.
The cost of living in Sioux Falls is 1.0x lower than the national average.
The median home value in Sioux Falls is $329,722.
The median income in Sioux Falls is $75,970.
Sioux Falls's Overall Cost Of Living
Lower Than The National Average
Cost Of Living In Sioux Falls Comparison Table
| Living Expense | Sioux Falls | South Dakota | National Average |
|---|---|---|---|
| Overall | 99 | 91 | 100 |
| Services | 100 | 98 | 100 |
| Groceries | 97 | 97 | 100 |
| Health | 105 | 77 | 100 |
| Housing | 92 | 98 | 100 |
| Transportation | 103 | 102 | 100 |
| Utilities | 92 | 93 | 100 |
Source: Cost of living index, normalized to US average = 100
Sioux Falls, SD Weather
The average high in Sioux Falls is 56.7° and the average low is 34.9°.
There are 52.1 days of precipitation each year.
Expect an average of 26.6 inches of precipitation each year with 40.6 inches of snow.
| Stat | Sioux Falls |
|---|---|
| Average Annual High | 56.7 |
| Average Annual Low | 34.9 |
| Annual Precipitation Days | 52.1 |
| Average Annual Precipitation | 26.6 |
| Average Annual Snowfall | 40.6 |
Average High
Days of Rain
Source: NOAA climate normals (30-year)
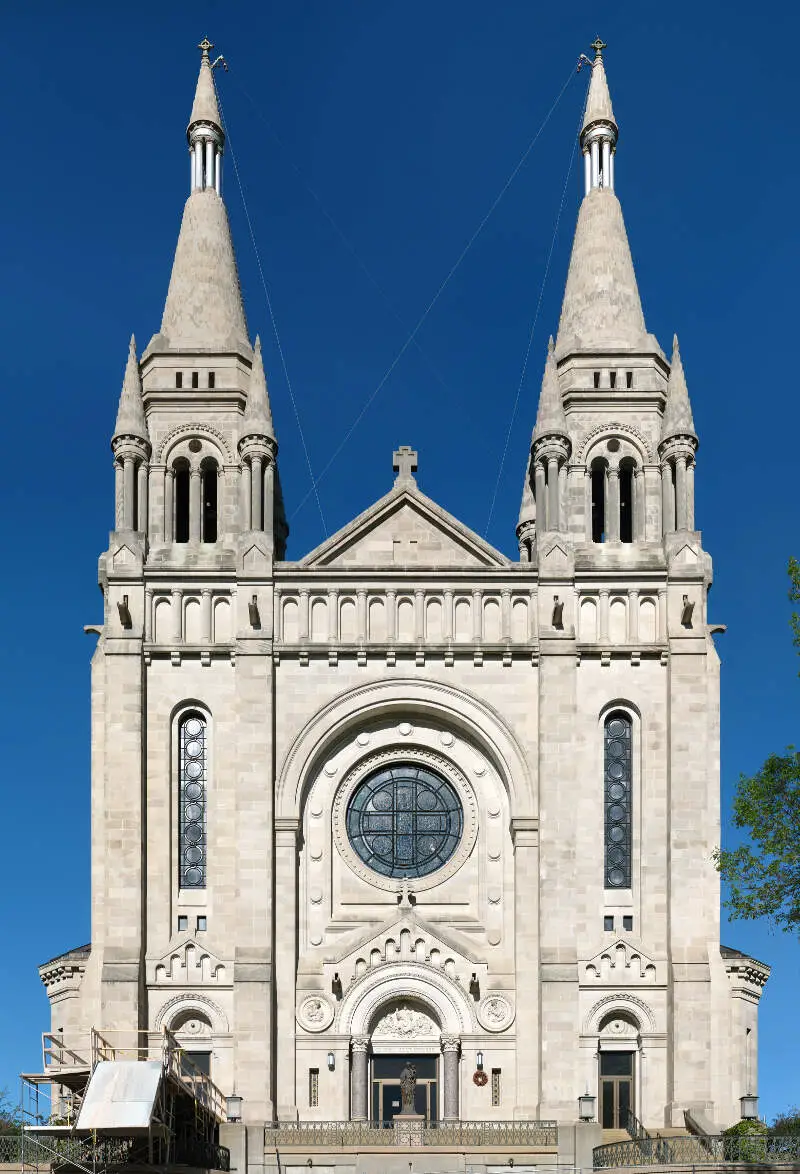
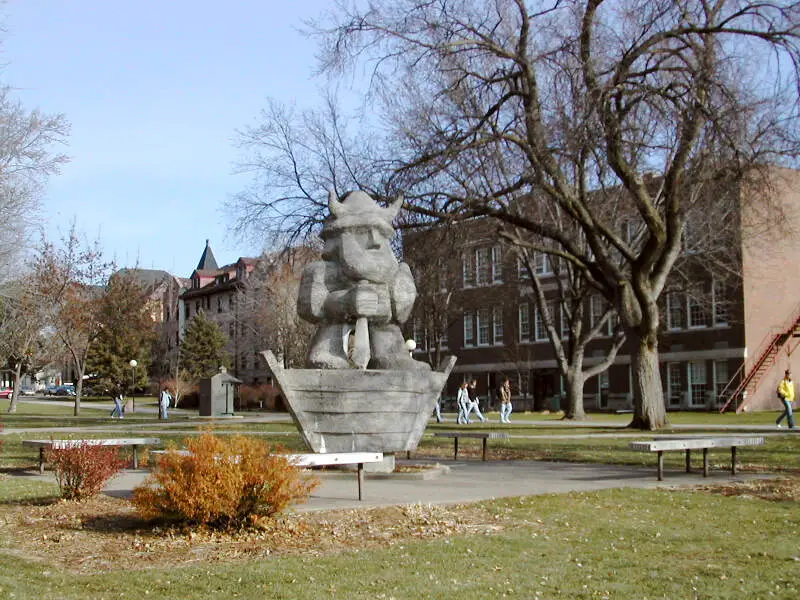
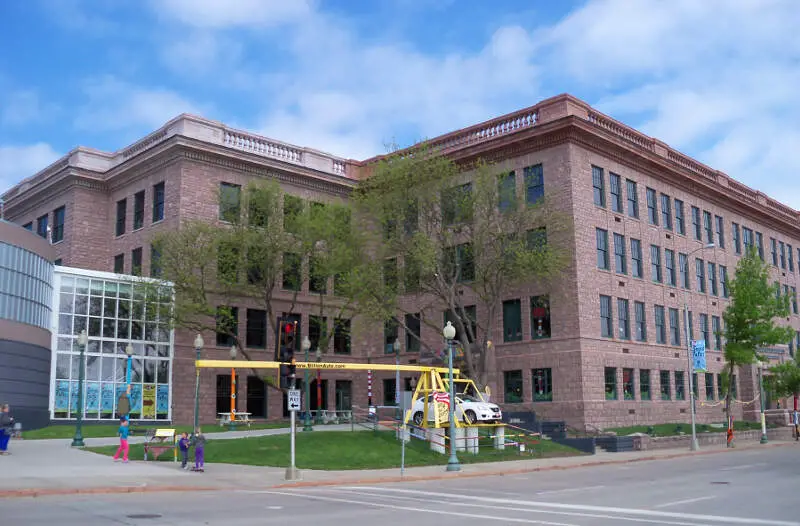
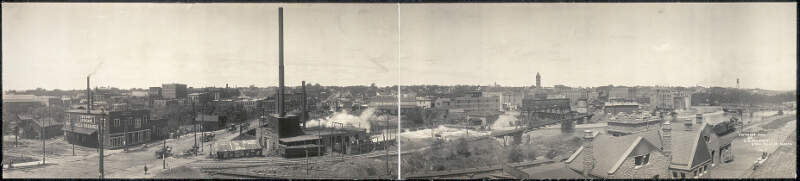
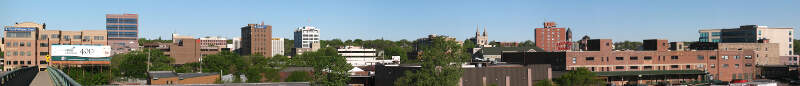
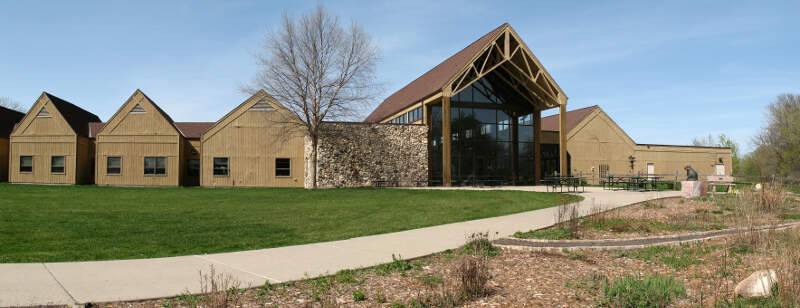
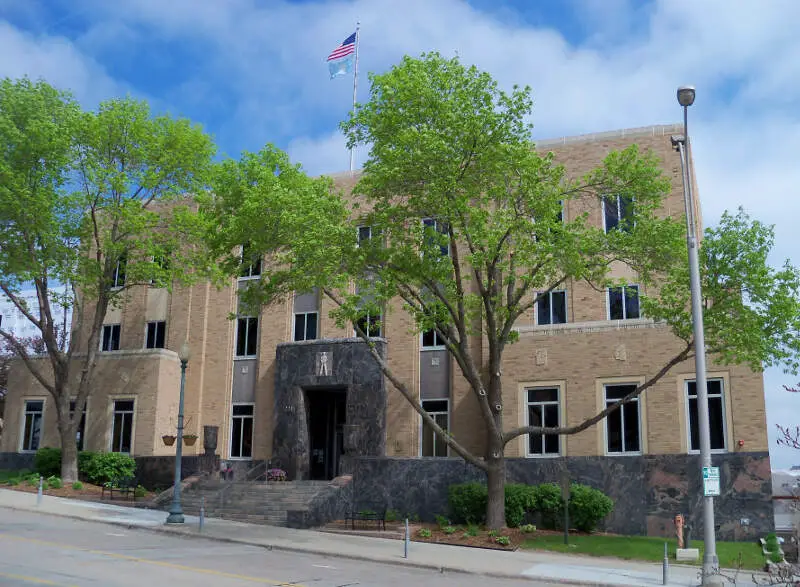
Sioux Falls, SD Photos
3 Reviews & Comments About Sioux Falls

I enjoy Sioux Falls since there's a little bit of everything. Airport near the north end for when I go on vacation, plenty of great restaurants around, some really nice bars downtown, and I can generally find what I'm looking for here.
The amount of construction going around where I live and work
It's a great city to raise your family. The biggest city in South Dakota, there is plenty to do in Sioux Falls. The schools are great, there is plenty of recreation and the people are super nice.
Visit Falls Park, the bike trail, Palisades and go for a walk downtown to see all the sculptures of Sculpture Walk.
The crime seems to be a lot lower compared to other places I lived. The worst thing I see is that the people drive really terribly here, major road rage all of the time and swerving. My favorite part of this town is easily our accessible everything is.
How close everything is. With the bonus of the very tolerable weather, it's very easy to just walk to where you need to get to here without a car being 100% necessary.
Rankings & Articles For Sioux Falls


Locations Around Sioux Falls
Map Of Sioux Falls, SD
Best Places Around Sioux Falls
Harrisburg, SD
Population 8,519
Tea, SD
Population 6,786
Brandon, SD
Population 10,996
Hartford, SD
Population 3,478
Dell Rapids, SD
Population 3,905
Canton, SD
Population 3,033
Sioux Falls Demographics And Statistics
Population over time in Sioux Falls
The current population in Sioux Falls is 201,469. The population has increased 35.4% from 2010.
| Year | Population | % Change |
|---|---|---|
| 2024 | 201,469 | 1.9% |
| 2023 | 197,642 | 2.2% |
| 2022 | 193,401 | 2.2% |
| 2021 | 189,258 | 4.6% |
| 2020 | 180,927 | 2.2% |
| 2019 | 177,117 | 1.7% |
| 2018 | 174,151 | 2.2% |
| 2017 | 170,401 | 1.5% |
| 2016 | 167,884 | 2.2% |
| 2015 | 164,341 | 2.1% |
| 2014 | 160,964 | 2.1% |
| 2013 | 157,675 | 2.0% |
| 2012 | 154,526 | 1.8% |
| 2011 | 151,727 | 1.9% |
| 2010 | 148,848 | - |
Race / Ethnicity in Sioux Falls
See the full breakdown
Sioux Falls is:
78.0% White with 157,056 White residents.
6.6% African American with 13,359 African American residents.
1.7% American Indian with 3,332 American Indian residents.
2.1% Asian with 4,136 Asian residents.
0.0% Hawaiian with 78 Hawaiian residents.
0.4% Other with 788 Other residents.
4.8% Two Or More with 9,606 Two Or More residents.
6.5% Hispanic with 13,114 Hispanic residents.
| Race | Sioux Falls | SD | USA |
|---|---|---|---|
| White | 78.0% | 79.8% | 57.4% |
| African American | 6.6% | 2.1% | 11.9% |
| American Indian | 1.7% | 7.1% | 0.5% |
| Asian | 2.1% | 1.4% | 5.9% |
| Hawaiian | 0.0% | 0.0% | 0.2% |
| Other | 0.4% | 0.3% | 0.6% |
| Two Or More | 4.8% | 4.4% | 4.3% |
| Hispanic | 6.5% | 4.8% | 19.3% |
Gender in Sioux Falls
See the full breakdown
Sioux Falls is 49.5% female with 99,800 female residents.
Sioux Falls is 50.5% male with 101,669 male residents.
| Gender | Sioux Falls | SD | USA |
|---|---|---|---|
| Female | 49.5% | 49.2% | 50.5% |
| Male | 50.5% | 50.8% | 49.5% |
Highest level of educational attainment in Sioux Falls for adults over 25
See the full breakdown
5.0% of adults in Sioux Falls completed < 9th grade.
4.0% of adults in Sioux Falls completed 9-12th grade.
24.0% of adults in Sioux Falls completed high school / ged.
19.0% of adults in Sioux Falls completed some college.
11.0% of adults in Sioux Falls completed associate's degree.
26.0% of adults in Sioux Falls completed bachelor's degree.
8.0% of adults in Sioux Falls completed master's degree.
2.0% of adults in Sioux Falls completed professional degree.
1.0% of adults in Sioux Falls completed doctorate degree.
| Education | Sioux Falls | SD | USA |
|---|---|---|---|
| < 9th Grade | 5.0% | 3.0% | 4.0% |
| 9-12th Grade | 4.0% | 4.0% | 6.0% |
| High School / GED | 24.0% | 29.0% | 26.0% |
| Some College | 19.0% | 20.0% | 19.0% |
| Associate's Degree | 11.0% | 12.0% | 9.0% |
| Bachelor's Degree | 26.0% | 22.0% | 22.0% |
| Master's Degree | 8.0% | 7.0% | 10.0% |
| Professional Degree | 2.0% | 2.0% | 2.0% |
| Doctorate Degree | 1.0% | 1.0% | 2.0% |
Household Income For Sioux Falls, South Dakota
See the full breakdown
3.4% of households in Sioux Falls earn Less than $10,000.
2.3% of households in Sioux Falls earn $10,000 to $14,999.
5.3% of households in Sioux Falls earn $15,000 to $24,999.
7.5% of households in Sioux Falls earn $25,000 to $34,999.
12.2% of households in Sioux Falls earn $35,000 to $49,999.
18.6% of households in Sioux Falls earn $50,000 to $74,999.
14.1% of households in Sioux Falls earn $75,000 to $99,999.
18.4% of households in Sioux Falls earn $100,000 to $149,999.
8.9% of households in Sioux Falls earn $150,000 to $199,999.
9.2% of households in Sioux Falls earn $200,000 or more.
| Income | Sioux Falls | SD | USA |
|---|---|---|---|
| Less than $10,000 | 3.4% | 4.2% | 5.0% |
| $10,000 to $14,999 | 2.3% | 3.2% | 3.4% |
| $15,000 to $24,999 | 5.3% | 6.7% | 6.3% |
| $25,000 to $34,999 | 7.5% | 7.0% | 6.6% |
| $35,000 to $49,999 | 12.2% | 11.5% | 10.1% |
| $50,000 to $74,999 | 18.6% | 17.4% | 15.5% |
| $75,000 to $99,999 | 14.1% | 14.6% | 12.6% |
| $100,000 to $149,999 | 18.4% | 18.9% | 17.5% |
| $150,000 to $199,999 | 8.9% | 8.5% | 9.6% |
| $200,000 or more | 9.2% | 8.1% | 13.4% |
Source: U.S. Census ACS 5-year estimates (2024)


